Table of Contents
Advertisement
Advertisement
Table of Contents

Related Manuals for Xylem Sontek River Surveyor RS5


Summary of Contents for Xylem Sontek River Surveyor RS5
-
Page 1: Rs5
USER MANUAL XA00125... -
Page 2: Declarations Of Conformity
The undersigned hereby declares that the product listed below conforms to all applicable requirements of FCC Part 15, B for the U.S. and Industry Canada (IC) ICES-001 for Canada. Manufacturer: SonTek – a Xylem brand 9940 Summers Ridge Road San Diego, CA 92121 USA... - Page 3 and/or bystander and the antenna and/or radiating element ensures that the maximum output power of NINA-B3 is below the SAR test exclusion limits. RSS-102 issue 5, Industry Canada (IC) SAR limits - The NINA-B3 series modules comply with IC RSS-102 issue 5 radiation exposure limits set forth for an uncontrolled environment;...
- Page 4 The undersigned hereby declares that the product listed below conforms to all applicable Essential Requirements of the listed Directives and Standards and carry the CE mark. Manufacturer: SonTek – a Xylem brand 9940 Summers Ridge Road San Diego, CA 92121 USA...
- Page 5 ETSI EN 301 489-17 V3.2.0 (2017-03), Electromagnetic compatibility (EMC) standard for radio equipment and services; Part 17: Specific conditions for Broadband Data Transmission Systems; Harmonized Standard covering the essential requirements of article 3.1(b) of Directive 2014/53/EU ETSI EN 301 489-19 V2.1.0 (2017-03), Electromagnetic compatibility (EMC) standard for radio equipment and services;...
- Page 6 The undersigned hereby declares that the product listed below conforms to the Australian and New Zealand Electromagnetic Compatibility (EMC) requirements. Manufacturer: SonTek – a Xylem brand 9940 Summers Ridge Road San Diego, CA 92121 USA Equipment name: River Surveyor RS5...
- Page 7 The undersigned hereby declares that the product listed below conforms to all applicable requirements of the Radio Wave Act of Korea. Manufacturer: SonTek – a Xylem brand 9940 Summers Ridge Road San Diego, CA 92121 USA Equipment name: River Surveyor RS5...
- Page 8 The undersigned hereby declares that the product listed below conforms to all applicable requirements of the Japanese Technical Regulation Conformity Certification of Specified Radio Equipment. Manufacturer: SonTek – a Xylem brand 9940 Summers Ridge Road San Diego, CA 92121 USA Equipment name:...
- Page 9 The undersigned hereby declares that the product listed below conforms to all applicable requirements of the NCC for the Taiwanese market. Manufacturer: SonTek – a Xylem brand 9940 Summers Ridge Road San Diego, CA 92121 USA Equipment name: River Surveyor RS5...
- Page 10 The undersigned hereby declares that the product accessory listed below conforms to all applicable requirements for the handling and shipping of Li -Ion batteries and is safe to use with the model number listed. Manufacturer: SonTek – a Xylem brand 9940 Summers Ridge Road San Diego, CA 92121 USA Equipment name:...
- Page 11 The undersigned hereby declares that the product listed be low is IP-67 rated and tested in accordance with IEC test specifications. Manufacturer: SonTek – a Xylem brand 9940 Summers Ridge Road San Diego, CA 92121 USA Equipment name: River Surveyor RS5...
-
Page 12: Release Notice
RS5 firmware version 1.0 RSQ software version 1.0 Trademarks The term RS5 is a registered trademark of Xylem Inc. All rights are reserved. All other brand names are trademarks of their respective holders. Warranty, Terms, and Conditions Thank you for purchasing the . - Page 13 FCC INFORMATION This device complies with Part 15 of the FCC Rules. Operation is subject to the following two conditions: 1. This device may not cause harmful interference, and This device must accept any interference received, including interference that may cause undesired operation. SonTek RS5 User Manual (August 2020) 13...
-
Page 14: Table Of Contents
Table of Contents RS5 ............................1 DECLARATIONS OF CONFORMITY ................. 2 Release Notice........................12 Table of Contents........................ 14 List of Tables ........................18 List of Equations ......................... 19 Section 1. Introduction ......................20 1.1. SonTek RS5 ADP ....................20 1.2. SonTek RSQ Software .................. - Page 15 5.3. Secure RS5 in Hydroboard II – Micro ..............36 5.4. Connect Bluetooth Radio Antenna............... 36 5.5. Connect GNSS Antenna Cable ................37 Section 6. RSQ for PC – Moving Boat................38 6.1. Overview – RSQ Software for PC ................ 38 6.2.
- Page 16 7.3.2 Manual Device Connection (serial number) ..............59 7.3.3 Manual Device Connection for Windows 7 Users (COM port selection)......60 7.3.4 Connection Status ....................61 7.3.5 Repair Device Without Firmware ................62 7.4. Starting a Moving Boat Measurement ..............64 7.5. Smart Page (Pre-measurement Setup and Checks) .......... 64 7.5.1 System Information ....................65 7.5.2...
- Page 17 8.3. Opening RiverSurveyor M9/S5 Data Files............102 8.4. Data Review/Processing View ................102 8.5. Measurement Session Options ................103 8.5.1 Save ........................ 104 8.5.2 Save As…......................104 8.5.3 Close ....................... 104 8.5.4 Import....................... 104 8.5.5 Delete Transect ....................105 8.5.6 Properties ......................
-
Page 18: List Of Tables
List of Tables Table 1. RS5 Supported NMEA GPS Messages .............. 35 Table 2. Status Icon Meanings ..................41 Table 3. QA/QC Warnings and Errors Rules and Meanings ..........44 Table 4. Hot Keys/Accelerators ..................53 Table 5. Connection Status Icons ..................61 SonTek RS5 User Manual (August 2020) 18... -
Page 19: List Of Equations
List of Equations Equation 1. Velocity Profile Power Law................57 SonTek RS5 User Manual (August 2020) 19... -
Page 20: Section 1. Introduction
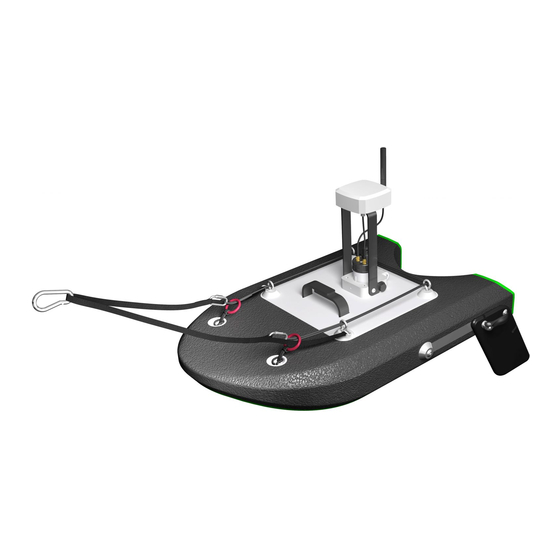
Section 1. Introduction 1.1. SonTek RS5 ADP The SonTek RS5 is the newest member of the time tested RiverSurveyor family of acoustic Doppler profilers (ADPs). The RS5 builds upon the acoustic technology developed for the RiverSurveyor S5 and M9. We have drawn heavily on customer feedback and suggestions for both the hardware and software development. -
Page 21: Sontek Rsq Software
GNSS receiver all day on a single charge. A second battery is included with each system so you will have a backup/spare. Enhanced Portability – The RS5 is the smallest, lightest and most portable ADP for discharge measurement available. Pair it with the HydroBoard II-Micro, equipped with folding antenna mast and board bag with backpack straps and you can travel from site to site, without disassembling, while protecting your valuable equipment. - Page 22 Resolution 0.001m/s Accuracy (Long Term Average) 1%±0.002m/s Cell Size 2.5cm to 30cm Min Profiling Depth 0.15m Max Profiling Depth 5.0m First Cell Start(Min) @ 5cm from system tip # Of Cells Up To 128 Temperature Sensor Resolution: ±0.01°C Accuracy: ±0.5°C Compass/Tilt Sensor Range: ±180 Pitch/Roll, 0-360...
- Page 23 1 x size 7 hours continuous use, typical settings* Battery 18650 Life *Defined as continuous sampling with Geode GPS Power Consumption 1.0 W (Average) Horizontal RMS SBAS (WAAS): <0.3 m (0.98 ft) GPS (Geode) 2DRMS SBAS (WAAS): <0.6m (1.96 ft) Frequency L1, GNSS Operating...
-
Page 24: Section 3. Rs5 Configuration Options And Setup
Section 3. RS5 Configuration Options and Setup The RS5 is available in two models: the RS5 Basic and the RS5 Max. Whereas the models are physically identical, the RS5 Max has an integrated GNSS option and compass while the RS5 does not. 3.1. - Page 25 Radio Antenna GPS Mast (unused) HydroBoard II-Micro Figure 2. RS5 Basic Hardw are and Accessories HydroBoard II-Micro Radio Antenna Radio Antenna Extension Cable (Use this cable if elevating the radio antenna is desired) USB + Radio Antenna Batteries (x2 plus case) SonTek RS5 User Manual (August 2020) 25...
-
Page 26: Rs5 Max - Compass And Gnss Options
Battery Charger Battery Charger Wall Adapter GPS Connector Cap 3.3. RS5 MAX – Compass and GNSS Options 3.3.1 Differential GNSS Components – Optional The RS5 Differential GNSS option comes standard with the Geode antenna (manufactured by Juniper Systems). The RS5 Max differential solution hardware and accessories are shown in Figure 3 and are explained below. - Page 27 Radio Antenna Geode DGPS Antenna GPS Mast HydroBoard II-Micro Figure 3. RS5 Max and Differential GNSS Com ponents HydroBoard II-Micro Geode DGPS Antenna Geode Antenna Bracket GNSS/GPS cable SonTek RS5 User Manual (August 2020) 27...
-
Page 28: Rtk Gnss Components - Optional
Radio Antenna Radio Antenna Extension Cable (Using this cable to elevate the radio antenna is highly recommended) USB + Radio Antenna Batteries (x2 plus case) Battery Charger Battery Charger Wall Adapter GPS Connector Cap (Use this optionally when the Geode is not connected) 3.3.2 RTK GNSS Components –... -
Page 29: Gnss Unlock Code (For Externally-Supplied Gnss Antenna)
Figure 4. RS5 Max and RTK GNSS Com ponents 3.3.3 GNSS Unlock Code (for externally-supplied GNSS antenna) For users who prefer to use their own GNSS antenna systems, a GPS unlock code can be purchased through SonTek (please contact support@sontek.com for details). -
Page 30: Carrying Case Options
Figure 5. RS5 Hydroboard II-Micro (right) w ith the Hydroboard Fam ily 3.5. Carrying Case Options 3.5.1 Pelican Case (RS5 System Only) A carrying case is available for the RS5 system and its accessories, shown in Figure 6. SonTek RS5 User Manual (August 2020) 30... -
Page 31: Backpack For Hydroboard And System - Optional
Figure 6. RS5 Pelican Case 3.5.2 Backpack for HydroBoard and System - Optional An optional convenient backpack is available to store and carry the RS5 with Hydroboard II – Micro, shown in Figure 7. The backpack allows the user to leave the RS5 assembled on the board when transporting or storing the system and provides an easy way to travel to various locations with the entire system together. -
Page 32: Section 4. System Maintenance
Figure 7. RS5 Backpack – Front and Back View s The center straps on the Hydroboard II-Micro hold down the GPS stand when in storage (shown in Figure 8). The user can optionally keep the GPS cable attached to the antenna. -
Page 33: Cleaning The Transducers
4.1. Cleaning the Transducers Periodic cleaning of the ADP transducer face may be needed to maintain optimal performance in areas of high biological activity or mineral build-up. To remove material build-up on the transducer faces, simply clean with a stiff (non-metallic) brush or apply soapy water and clean with a sponge. -
Page 34: Powering On Gnss Accessories (Max)
Figure 9. Place Battery Inside Com partm ent The system’s LED light will flash white quickly, followed by two fast red flashes. After a few seconds of delay, the LED will flash slowly red, indicating that it is powered on and in Stand-by mode and ready for connection. -
Page 35: Rtk Gnss
for a complete list of light indicators and meanings. The complete manual for the Geode antenna can be found from the Juniper Systems website at https://junipersys.com/data/support/geode/Geode-manual-English.pdf. The Geode system will be configured to connect directly to your RS5 (through the cable) with no other setup required, but if the user is interested in viewing antenna diagnostics (number of satellites, quality of fix, etc.) or changing settings for other purposes, Juniper Systems provides both a Phone App as well as a desktop software to... -
Page 36: Secure Rs5 In Hydroboard Ii - Micro
Please see Appendix D for detailed instructions on how to enable an external GNSS/GPS antenna for the first time. The external GNSS/GPS antenna must supply its own power. Please follow the antenna manufacturer’s instructions on how to power their system. 5.3. -
Page 37: Connect Gnss Antenna Cable
Figure 12. Radio Antenna Configuration w ith GPS (left) and Without (right). Connect the second Bluetooth radio antenna to the USB dongle (described in Section 3.2), and insert the dongle into the computer. 5.5. Connect GNSS Antenna Cable If using a GNSS solution, connect the antenna with the appropriate cable to the GPS connector of the RS5. -
Page 38: Section 6. Rsq For Pc - Moving Boat
Section 6. RSQ for PC – Moving Boat 6.1. Overview – RSQ Software for PC This section describes the RSQ software for RS5 data collection, viewing, and post -processing. The software includes everything needed to make real-time discharge measurements as well as post-process the data. -
Page 39: Software Layout During Data Collection
Figure 14. RSQ Softw are Icon 6.5. Software Layout During Data Collection Whether in data collection or viewing/post-processing mode, the RSQ software is divided into multiple areas. When first starting RSQ, the user will have the option to either open a data file Figure 15 for viewing/post-processing, or to start a new measurement (shown in ). -
Page 40: Main Toolbar
Main Toolbar Transect Tabs Status Icons Side Bar Main Data Display QA/QC Warnings (CTRL+Q) Profile Plot Data Tabs Discharge Summary (CTRL+S) Figure 16. RSQ Interface During Active Data Collection 6.5.1 Main Toolbar Once a new measurement is started, the main toolbar will change slightly to accommodate various options during the measurement. -
Page 41: Transect Tabs
Window – options to show the QC window (real-time and post-processing) and the Toolbox (post-processing only) Manual – open the RS5 User Manual (this document) About – view RSQ software version When the first transect is complete, the user will see an expanded main toolbar, shown in Figure 18. - Page 42 Bluetooth Unknown Bluetooth Unavailable Bottom Track Status Bottom Track Valid Bottom Track Valid (Depth Only) Bottom Track Invalid Bottom Track Not Available GPS – GGA Status GPS GGA RTK GPS GGA Differential GPS GGA Uncorrected GPS GGA Invalid GPS GGA Not Available GPS –...
-
Page 43: Sidebar
Battery 40% Battery 20% Battery 10% Battery Not Available Data Collection Status Data Collection Running Data Collection Waiting 6.5.4 Sidebar The sidebar can be found on the left upper portion of the software during a measurement, and is highlighted in Figure 16. The side bar is a sample-by-sample table displaying various real-time parameters.The variables displayed in the side bar can be configured by right-clicking... -
Page 44: Table 3. Qa/Qc Warnings And Errors Rules And Meanings
right-clicking warnings displayed can be configured by on the QA/QC warning window, and options are shown in Figure 20. Figure 20. QA/QC Warnings Display Options The QA/QC Process is based on international standards and well developed operational procedures from various organizations. The process is designed around system configuration, measurement components associated with moving boat measurements and system operation. - Page 45 Measurement Criteria Variable Action Message Component Transducer Transducer depth is 0. Please set in Warning Depth system settings Magnetic Magnetic declination is 0. Please set in Warning Declination system settings Pitch/Roll Warning Pitch/Roll exceeded calibrated value Compass Magnetic Error Warning Magnetic error is greater than 3.5 Counter / Samples with beam separation...
- Page 46 Measurement Criteria Variable Action Message Component Boat Speed Warning Boat Speed is greater than 0.7m/s 0.7m/s Counter / Samples with bad BT Warning Counter / Samples with bad BT (edited) Warning Bottom Track Warning 9 Consecutive samples with bad BT 9 Samples Warning Discharge will be biased low...
- Page 47 Measurement Criteria Variable Action Message Component Variation in Area from the previous Warning transect is more than 5 percent Area Warning COV of Area is greater than 5 percent Variation in Total Q from the previous Warning transect is more than 5 percent Discharge COV of Total Q is greater than 5 Warning...
-
Page 48: Profile Plot
Measurement Criteria Variable Action Message Component Battery Voltage Warning Replace Batteries Counter / Missing Samples Warning Counter Start Edge System Counter Transect Operation Missing Sample Counter End Edge Warning 9 consecutive missing samples. Total 9 Samples discharge will be biased low. Matlab No automated Matlab export if missing samples are present... -
Page 49: Software Tools
CTRL+S shown by using [ ], and right-clicking on the header or body of the summary allows the user to choose what parameters are displayed. See Section 7.11 for details on how to manipulate different functions from within the Discharge Summary. 6.6. - Page 50 Figure 22. Create a new site tem plate Clicking will bring up the Smart Page, where the desired configuration and settings can be entered (Figure 23). SonTek RS5 User Manual (August 2020) 50...
-
Page 51: Run Translator
Figure 23. Enter configurations and settings for a site tem plate Clicking Close will save the current template. All templates are saved in a Site Templates folder which can be opened by clicking the Open Folder button. The Rename Delete button will allow the user to rename the current template, and the button will delete the current template. -
Page 52: Import Language File
Figure 24. Run Translator Tool 6.6.4 Import Language File To import a custom language file (other than the RSQ defaults, described in Appendix B), use the Import Language File tool. The Import tool will prompt the user to locate the desired language file. -
Page 53: General Plot/Display Functionality Features
Table 4. Hot Keys/Accelerators Keys highlighted in BLUE are also available in Data Collection and Post-Processing. Keys highlighted in ORANGE are only available in Post-Processing. Hot Key/Accelerator Action Move forward action (refers to active button) Stop System CTRL+N Open connection dialog CTRL+O Open file CTRL+T... -
Page 54: Double-Click On Legend
6.8.5 Double-click on legend Double-clicking on a legend allows the user to manually change the limits of the colors plotted. 6.8.6 Copy to clipboard Generally, right-clicking on plots or tables in the software will bring up the ability to copy the plot or table to the clipboard in your laptop to paste onto a separate document. 6.8.7 Change horizontal axis right-clicking... - Page 55 Figure 25. A Measurem ent Section Break Dow n The middle area of the transect measured by the RS5. The top and bottom areas are estimated by various means of extrapolation, and the edge areas are estimated by an average measurement. This further division of regions is shown in Figure 26. SonTek RS5 User Manual (August 2020) 55...
- Page 56 Figure 26. Measured Areas Versus Top/Bottom Estim ates Discharge is calculated by summing the edge, measured, and estimated areas. Only the measured area and edge estimates are measured by the acoustic Doppler profiler. The top and bottom regions are determined using industry-standard calculations for extrapolation.
-
Page 57: Starting The System
Velocity Profile Extrapolation is used to estimate the unmeasured areas at the top and bottom of the water column. The standard method uses a power law velocity profile proposed by Simpson and Oltmann (1990) and Chen (1991) to calculate velocities Equation 1 above and below the measured area according to Equation 1. -
Page 58: Automatic Device Scanning
The Connect dialog is shown in Figure 27, and the user must ensure that the Connection Type is SonTek BLE Dongle. Figure 27. Connection Type: SonTek BLE Dongle 7.3.1 Automatic Device Scanning Choosing Scan for Devices from the Connect dialog (highlighted in Figure 28) brings up a list of active RS5 systems that are within detection range of the Bluetooth dongle. -
Page 59: Manual Device Connection (Serial Number)
Figure 29. Double-Click on the Serial Num ber to Connect Updates on the connection progress will appear in the Connect dialog, as shown in Figure 30. Any connection errors or failures will also appear in this screen. Figure 30. Connection Progress 7.3.2 Manual Device Connection (serial number) To manually connect to an RS5 using its serial number, from the Connect dialog, simply... -
Page 60: Manual Device Connection For Windows 7 Users (Com Port Selection)
Figure 31. Connect to Instrum ent via Serial Num ber The same connection progress messages will appear as shown in Figure 30. 7.3.3 Manual Device Connection for Windows 7 Users (COM port selection) For users operating computers on Windows 7, a manual COM port option will appear in the Connection dialog, shown in Figure 32. -
Page 61: Connection Status
Figure 33. Device Manager 7.3.4 Connection Status The status of the connection is indicated by the icon on the Connect button. Table 5 shows the various connection status icons and their associated meanings. Table 5. Connection Status Icons Icon Status Excellent (>-70 dBm) SonTek RS5 User Manual (August 2020) 61... -
Page 62: Repair Device Without Firmware
Good (-70 to -85 dBm) Poor (<-85 dBm) Attempting to reconnect Disconnected Details on the connection can be viewed by clicking the Connect button, as shown in Figure 34. Clicking the Connect button while connected also offers the option to Disconnect. - Page 63 (support@sontek.com) before using this option. This can be done through the Repair Device Without Firmware feature from the Connect dialog, highlighted in Figure 35. Figure 35. Repair Device Without Firm w are The Repair Device Without Firmware dialog (Figure 36) will prompt the user for the instrument serial number and the firmware file the user wishes to use.
-
Page 64: Starting A Moving Boat Measurement
7.4. Starting a Moving Boat Measurement Once the RS5 is connected in the RSQ software, click the New Data Collection button (Figure 38). Click the Moving Boat button. The Stationary option will be coming soon. Figure 38. New Data Collection 7.5. -
Page 65: System Information
Figure 39. Sm art Page In general, sections with a red X must be addressed before starting a new measurement. Sections with a green check mark indicate those items are ready for a measurement to begin. Aside from the System Test and Compass Calibration, entries in the Smart Page can be changed in Post-processing (see Section 8). -
Page 66: System Test
Figure 41. Load Tem plate Dialog From the System Information section, the user also has the option to save their existing Smart Page settings to a template by clicking the Save as Template link. 7.5.2 System Test A system test should be done prior to each discharge measurement to ensure the functionality of the RS5 hardware for proper data collection. -
Page 67: Site Information
Figure 43. System Test Pass (left) and System Test Fail (right) Once the connected RS5 system passes the System Test, the System Test section will have a green check mark, and the time at which the last System Test was performed will be indicated. -
Page 68: Compass Calibration
Figure 45. Site Inform ation 7.5.4 Compass Calibration When making a discharge measurement using the RS5, the system’s internal compass is used to provide the instrument’s heading as it moves across the channel. The RS5 internal (magnetic) compass must be calibrated prior to data collection. Users familiar with the M9/S5 compass calibration will recognize the steps outlined below, as the procedure for calibrating the compass for those systems is the same as for the RS5. - Page 69 It is important that the compass calibration be performed in the same environment as where the actual measurement will be performed. For example, it is not adequate to per-form a calibration in a parking lot far from the water’s edge, or on a concrete bridge deck far above the water surface, etc.
- Page 70 Figure 47. Com pass Calibration Dialog 4. To begin a Compass Calibration, press the Start button, highlighted in Figure 47. Once the calibration begins, the dialog will provide real-time feedback on the heading (x-axis), pitch, and roll, shown in Figure 48. 5.
- Page 71 Figure 48. Com pass Calibration Procedure 6. The RS5 and boat/floating platform should be rotated through two complete circles, taking 60 seconds for each rotation. The RSQ software will limit the calibration routine to a maximum of 120 seconds, so the operator should try to perform one rotation per minute.
-
Page 72: System Configuration
Mean Magnitude - This is the mean value of the magnetic field measured during calibration. The units are internal to the compass itself and values are unique to instrument and location at time of calibration. For 3D calibrations (including pitch/roll), this value depends on the magnetic field strength both from the instrument and from the surrounding environment. - Page 73 Figure 50. System Configuration A dialog will pop up allowing the user to enter various configuration parameters (see Figure 51). These items must be entered with care, as they directly affect the final discharge calculations. Figure 51. System Configuration Dialog If the System Configuration section has not been completed, a red X will remain visible in that section.
-
Page 74: Transducer Depth
discharge calculations will be affected in the field. These values can then be modified in post-processing. Each setting in the System Configuration is described in detail in the following sections. 7.5.5.1 Transducer Depth Transducer depth is the distance that the vertical beam transducer is submerged below the water surface. -
Page 75: Salinity
The GPS antenna is often forced to be mounted off-center when using a manned boat. The X and Y axis definitions are shown in Figure 53. Points to Beam 1 X (positive) X (positive) Beam 1 Y (positive) Y (positive) Figure 53. -
Page 76: Sound Speed Override
entered in the Temperature Override variable, which will be used over the measured temperature. 7.5.5.6 Sound Speed Override As with the Temperature Override feature, the sound speed measured by an external measurement can be entered here to override the automatic calculation using the measured temperature by the RS5. -
Page 77: Track Reference
7.5.5.10 Track Reference The ADP measures water velocity using multiple acoustic pulses transmitted and received throughout the water column (see RS5 Technical Manual for more details, coming soon). When the ADP is in motion, the apparent velocity measured by the ADP is a combination of boat velocity and water velocity. -
Page 78: Edge Configuration
3. GGA GPGGA (GGA) refers to a specific NMEA-0183 protocol for outputting GPS position data. In this case, the GGA “string” contains actual position (latitude/longitude) along with several other GPS parameters. Boat velocity is calculated by measuring the distance between two successive GGA positions divided by the travel time between those two positions. - Page 79 Figure 56. Edge Configuration Dialog Settings in the Edge Configuration Dialog (Figure 56) include: Start Edge – the starting bank for the transect Distance to Bank – the distance from the start or end edge positon of the RS5 ...
-
Page 80: Extrapolation Configuration
Show Edge Dialog – this setting enables the edge dialog to appear at the start and end edge of each transect despite having filled out the edge configuration section in the Smart Page. 7.7. Extrapolation Configuration The Extrapolation Configuration section allows the user to change extrapolation settings for the top and bottom sections of the channel not measured by the RS5 (described in Section 7.1) Figure 57. - Page 81 Figure 58. Extrapolation Configuration Dialog Extrapolation choices follow Mueller (2013). Options for the top extrapolation method are: Constant - Assumes the velocity or discharge is constant from the average of the top cells defined by the ‘Number of Cells’ parameter ...
-
Page 82: Calculation Thresholds
7.8. Calculation Thresholds The Calculation Thresholds section (Figure 59) shows several options for using or filtering certain types of data. Figure 59. Calculation Thresholds Clicking the Change link will allow the user to edit these options (dialog shown in Figure 60). -
Page 83: Templates From Smart Page
o If VTG is the selected track reference: automatically use GGA track if the GGA track has quality 4 and the VTG sample is invalid. If GGA data is less than quality 4, bottom track will be used as the track reference. 7.9. -
Page 84: Add Loop (Optional)
Figure 62. Options for Beginning Data Collection 7.10.1 Add Loop (Optional) The Loop moving bed test is commonly used to identify a moving bed and correct for its effects in the final discharge. The Loop Method is documented in Mueller and Wagner (2006), and the procedure described here follows this document step-by-step. - Page 85 Figure 63. Add Loop Preview 4. Ensure that the RS5 is stationary and at the starting point of the loop measurement. The preview dialog allows the user to view profiling data before recording the loop measurements – please ensure that valid data cells appear and that the data conform to expectations at that site before proceeding.
- Page 86 Figure 64. Loop Measurem ent Dialog When approaching the far channel bank, do not spend any extra time along the edge. Rather, gently turn the boat and return to the starting stream bank. After returning to the starting position, press the Finish button (or use [F5]) to stop the Loop measurement.
-
Page 87: Add Smba (Optional)
Figure 65. Loop Measurem ent Results Loop Measurement warnings and information are displayed near the bottom, and the final recommendation for a correction is displayed at the bottom. Figure 65 shows the results of a Loop Measurement with no correction recommended. From the Loop Measurement Results dialog, the user can choose to repeat the Loop Measurement, or proceed to the Start Edge. - Page 88 interference, or when the compass is thought to be unreliable. The SMBA requires at least one measurement at a stationary location ideally located in the location of highest flow (where the probability of having a moving bed is greatest). Follow the steps below to perform an SMBA moving bed test.
- Page 89 3. Ensure that the RS5 is held at a stationary location in the channel where the highest flow is located, and that the profile data look reasonable for the site. Click Start SMBA (or use [F5]). 4. The SMBA data collection will begin, and the same data will appear as shown for the Loop measurement (Figure 64).
-
Page 90: Start Sampling
7.10.3 Start Sampling From the Smart Page, click the Start Sampling button (or use [F5]) to begin data collection (Figure 62). Alternatively, sampling can begin from the Loop or SMBA dialogs by choosing to proceed to the Start Edge. The data preview display will appear (Figure 70). - Page 91 Figure 71. Proceed to Start Edge A pop-up Edge Dialog window (shown in Figure 72) will appear if this option is checked (see Section 7.6) Figure 72. Edge Dialog SonTek RS5 User Manual (August 2020) 91...
-
Page 92: Transect Section
Any Edge settings from the Smart Page (described in Section 7.6), and any modifications to these settings can be made here. The distance to bank can be either measured or estimated. Click to begin the Start Edge data collection. The Edge data collection tab will appear, as shown in Figure 73. Keep the RS5 as stationary as possible during the edge data collection. - Page 93 Figure 74. Proceed to Transect Section The Transect data tab will activate automatically, as shown in Figure 75. Figure 75. Transect Data Collection The user can begin moving the vessel across the channel, with the vessel pointing roughly perpendicular to the direction of flow. All attempts should be made to keep the vessel speed and direction constant as it progresses across the river to the end edge.
-
Page 94: End Edge
During the Transect measurement, the user has the option to navigate through any data tabs (described in Section 6.5.8) by clicking the tabs near the bottom of the software. The user can also right-click to manipulate what data variables they would like to view during the transect. -
Page 95: Adding Additional Transects To Measurement
Figure 77. End Edge Sam pling 7.10.7 Adding Additional Transects to Measurement As most discharge measurements require pairs of transects, adding additional transects is assumed after completing an End Edge. The RSQ software will move directly to the preview screen of the next transect, and the process can be repeated (starting from Section 7.10.4) until the desired number of transects is collected. -
Page 96: Discharge Summary Overview
Figure 78. Recorded Data Tab 7.11. Discharge Summary Overview While collecting multiple transects, it is often useful to show the Discharge Summary, described in Section 6.5.9. By using [CTRL+S] or activating the Discharge Summary through the Window button (main toolbar), the user can compare discharge and many other related parameters among already-collected transects. - Page 97 Name – name of transect (as it appears in the Recorded Data tab) Arrow – indicates which direction the transect moves (left to right bank [ ] or right to left bank [ Track Reference – indicates whether System [ ], Bottom Track [ ], GGA [ or VTG [...
-
Page 98: Other Data
Figure 80. Discharge Sum m ary Options and Param eter Menu If “Highlight Summary Records” is selected through the Tools > Settings > Moving Boat dialog (described in Appendix B), transects having more than 5% difference in discharge from the mean discharge are highlighted in red. An example of this is shown in Figure 81. -
Page 99: Site Photos
Figure 82. Other Data 7.12.1 Site Photos Site photos can be added to the measurement for easy reference. Clicking on the Site Photos button opens the Site Photos dialog, shown in Figure 83. Figure 83. Site Photos Dialog From here, the user can add or remove photos from the list, which appears on the right. The Export function saves the current photo as a JPG file to the desired folder. -
Page 100: Beam Check Measurements
7.12.2 Beam Check Measurements The procedure for collecting and recording Beam Check Measurements is outlined in Appendix C. Any Beam Check measurements performed during the current measurement session will be saved and viewable through the Beam Check Measurements dialog. 7.12.3 Compass Calibrations Compass Calibrations can be performed through the Smart Page (described in detail in Section 7.5.4) or through the Hardware Utilities function (see Appendix C). -
Page 101: Section 8. Reviewing Data Files And Post-Processing - Moving Boat
Figure 85. Finish the Measurem ent The user will be prompted to save the file through a dialog, at which point the user can modify the destination and automatic naming that is chosen by the software. Once done, click Save to record the data file. -
Page 102: Opening Riversurveyor M9/S5 Data Files
Figure 86. Open File All transects and moving bed tests will be displayed as clickable tabs under the main toolbar, as indicated in Figure 87. Figure 87. View Data As with measurement collection, different data tabs along the bottom of the screen allow the user to view different variables. -
Page 103: Measurement Session Options
Figure 88. Data Review and Processing View The data file’s name will appear on the top of the software screen, and separate tabs can be available for all moving bed and transects (see Appendix B to enable or disable these tabs). The QA/QC Warnings window, Toolbox, and Discharge Summary can be viewed by either clicking the Window button or by using the hot keys outlined in Section 6.7. -
Page 104: Save
8.5.1 Save If any changes have been made to the original .rsqmb file, the Save option will be activated, allowing the user to save the file with the current changes. The original .rsqmb file will always be preserved, and clicking the Save button from an original file will prompt the warning shown in Figure 90. -
Page 105: Delete Transect
Figure 91. Im port Transects 8.5.5 Delete Transect The Delete Transect function deletes the current transect being viewed from the measurement. A warning will appear before the deletion is performed. 8.5.6 Properties The Properties button shows information about the current data file (Figure 92). The following information is displayed: ... -
Page 106: Discharge Settings
Figure 92. Data Session Properties 8.6. Discharge Settings The following features are available from the Discharge Settings button, shown in Figure 93. Figure 93. Discharge Settings 8.6.1 Beam Switching Beam switching is a new feature that allows the user to ‘turn off’ one beam for velocity calculations. - Page 107 the ADP approaches a vertical bank. Because the velocity processing normally requires all 4 beams, if one beam hits a bank before the other beams, it will cut off profiles at a shallower location to avoid data contamination, causing a sloping shoring of data, like the example shown in Figure 94.
- Page 108 Clicking the Add button produces the dialog in Figure 96. Figure 96. Beam Sw itching One Section In the example above, the user would disable Beam 2 between samples 56 and 84, as shown in Figure 97. Figure 97. Beam Sw itching to disable Beam 2 Clicking OK results in the updated profile shown in Figure 98.
- Page 109 Figure 98. Beam Sw itching Result of Rem oving Beam 2 Adding another “section” for Beam 4 between samples 20 and 30 results in the data view shown in Figure 99. The “Auto” button attempts an algorithm to automatically determine where beams should be disabled, and is still in development.
-
Page 110: Using Extrap (Usgs)
Figure 99. Beam Sw itching Result from Disabling Beam s 2 and 4 8.6.2 Using EXTRAP (USGS) The USGS created a tool called EXTRAP (https://hydroacoustics.usgs.gov/movingboat/extrap1.shtml) to standardize the choice of top and bottom extrapolations based on objective statistics from the measurement data. Due to the usefulness and popularity of the tool, the RSQ software is able to apply this tool directly from its interface. -
Page 111: Moving Bed Correction
Figure 100. EXTRAP Method 8.6.3 Moving Bed Correction If moving bed tests were performed during the measurement, they will be available under the Moving Bed Correction button. The user can select either Loop measurements or SMBA measurements. Choosing the Loop Method will open the dialog shown in Figure 101. If more than one Loop measurement exists, the user can select which file to use in the Loop correction from the Loop Method Files drop-down list at the top. - Page 112 Figure 101. Loop Method Dialog in Post-Processing If an SMBA Moving Bed Test exists, if can be accessed by clicking the SMBA Method button, which will bring up the dialog shown in Figure 102. If a correction for the discharge is suggested from the SMBA measurement, the transects to apply the correction can be checked.
-
Page 113: Data Export
Figure 102. SMBA Method in Post-Processing 8.7. Data Export RSQ offers a variety of different data export formats, all which can be accessed through the Export button, shown in Figure 103. Each of the options is described in the following sections. -
Page 114: Ascii Summary
Clicking the Matlab Export button allows the user to choose to export the current transect or all transects. If All is selected, RSQ will create a new folder in the same location as the .rsqmb file containing the Matlab exported files, like the example shown in Figure 104. -
Page 115: Summary Report
Start Time Duration Track DMG Width Area Boat Speed Mean Speed Left Q Right Q Top Q Middle Q Bottom Q Total Q Moving Bed Corrected Q ... -
Page 116: Flowpack Export
Figure 106. Sum m ary Report 8.7.4 FlowPack Export Choosing the FlowPack Export will create a .CSV (comma-separated-value) file that can be imported to the SonTek FlowPack software (https://www.sontek.com/softwaredetail.php?FlowPack-Software-7) for creating Index Velocity Ratings. The structure of the file is shown in the example file in Figure 107. SonTek RS5 User Manual (August 2020) 116... -
Page 117: Kml
Figure 107. Exam ple of Flow Pack Export .CSV File Form at 8.7.5 The KML export creates a .KML file containing the vessel tracks and automatically open Google Earth if it is installed on the laptop. The user has the option to export only the current transect or all transects in the measurement. -
Page 118: Export To New Session
Figure 108. Sam ple KML Export Show ing All Transects of a Measurem ent 8.7.6 Export to New Session The Export to New Session function allows the user to create a new measurement file from existing transects in the current measurement. An example of the dialog is shown in Figure 109. -
Page 119: Other Data
Figure 109. Export to New Session Dialog 8.8. Other Data Other data from the measurement (site photos, beam check files, and compass calibration files) can be viewed from the Other Data button. The functionality and descriptions of the data can be found in Section 7.12. SonTek RS5 User Manual (August 2020) 119... -
Page 120: Toolbox
8.9. Toolbox The post-processing Toolbox allows the user to enter or modify settings from the Smart Page conveniently. The Toolbox can be activated by either selecting it from the Window button (main toolbar) or using [CTRL+T]. This will activate the Toolbox window shown in Figure 110 Figure 110. -
Page 121: Reset To Field Settings
8.10. Reset to Field Settings To reset the measurement to field settings, first, show the Discharge Summary (CTRL+S). Right-clicking anywhere in the Discharge Summary panel will show the “Reset to field settings” function (see Figure 111). Figure 111. Reset to Field Settings 8.11. - Page 122 Figure 113. Extract Subsection Dialog The dialog requires the user to define new left and right bank edges, which are shown visually with grey areas. The edge definition is required in order to perform proper discharge calculations on the subsectioned data. The example shown in Figure 114 depicts a subsectioned region that will have: ...
-
Page 123: Data Processing Suggestions And Tips
Figure 114. Extract Subsection Exam ple 8.12. Data Processing Suggestions and Tips This section outlines steps suggested by experienced field Hydrologists for processing data files. The following contains suggestions only, and each measurement will require steps specific to that site, setup, and data collection. Please use these steps as a guide only. -
Page 124: Section 9. Rsq For Pc - Stationary
and the D(BT)/D(GPS) (Ratio of Bottom Track track distance to GPS track distance) is approximately 1. 9. If using GPS, make sure the number of GPS satellites is good and the GPS quality is valid. 10. On the Transect tab, evaluate different plots by right-clicking on the vertical axes. 11. -
Page 125: Section 10. References
Section 10. References 1) Chen, Cheng‐Lung. “Unified Theory on Power Laws for Flow Resistance.” Journal of Hydraulic Engineering, vol. 117, no. 3, 1991, pp. 371– 389., doi:10.1061/(asce)0733-9429(1991)117:3(371). 2) Mueller, David S. “Extrap: Software to Assist the Selection of Extrapolation Methods for Moving-Boat ADCP Streamflow Measurements.” Computers & Geosciences, vol. -
Page 126: Appendix A. Site Selection Requirements
Appendix A. Site Selection Requirements The Site Selection Requirements for performing discharge measurements using a SonTek-RS5 instrument are based on a number of measurement site and hydraulic requirements. The measurement site and hydraulic requirements are similar to what a Hydrologists or Hydrographer will use in the selection of monitoring site for either natural or artificial control. -
Page 127: Appendix B. Software Settings
Appendix B. Software Settings B-1. General Tab The General Tab contains settings pertaining to general software functionality. The options are shown and described below: Language Automatic languages include: English, French, German, Greek, Italian, Japanese, Korean, Polish, Portuguese, Portuguese (Brazilian), Romanian, Russian, Spanish, Spanish (Latin America) ... - Page 128 Data Collection Processes This gives the user the ability to toggle either Moving Boat, Stationary, or both methods to be viewed when the New Data Collection button is clicked, shown below: If users know they always use one or the other option, they can disable the unused option.
- Page 129 Allow Simulated Connections The simulated connection option allows the user to simulate a connection to an RS5 system. It can be used for training purposes or to familiarize a user with the connection and data collection interface and steps prior to obtaining an instrument.
- Page 130 B-2. Moving Boat Tab The Moving Boat tab shows settings specific to moving boat measurements . Options are shown and described below: Highlight Summary Records Checking the “Highlight summary records” will highlight transects in red in the Discharge Summary that exceed 5% difference in discharge compared to the mean. Please see Section 7.11 for an example.
- Page 131 Automatic MATLAB Export When this option is enabled, when a file is opened, the MATLAB export function will automatically create the exported files in a separate folder to facilitate processing in QRev. Side-bar Parameter Ordering This setting allows the user to manually order the parameters displayed in the side-bar (top left).
- Page 132 Distance Centimeters, Fathoms, Feet, Inches, Kilometers, Meters, Miles, Millimeters, Yards Fraction Decimal Decimal Fraction Percent Percent Frequency Gigahertz, Hertz, Kilohertz, Megahertz GPS Position Decimal Degrees, Degrees Minutes Seconds, DegreesMinutes Pressure Bar, Decibars, Feet of water, Meters of water, Pascal, Pound Force per Square Inch Profile Range Centimeters, Fathoms, Feet, Inches,...
-
Page 133: Appendix C. Hardware Utilities
Appendix C. Hardware Utilities The Hardware Utilities tools requires an active connection to an RS5 system. If the user is not connected to a system, the connection dialog will appear before moving forward to the Hardware Utilities dialog, shown below: C-1. - Page 134 If a measurement has already begun, the Beam Check dialog will include an option to record the file, as shown below. SonTek RS5 User Manual (August 2020) 134...
- Page 135 When the Start Recording button is pushed, there will be a sample counter as well as a Stop button on the bottom of the dialog, as shown here: SonTek RS5 User Manual (August 2020) 135...
- Page 136 The recorded Beam Check files will be saved automatically with the measurement (.rsqmb) file, and can be viewed by clicking on the Other Data button: SonTek RS5 User Manual (August 2020) 136...
- Page 137 C-2. Compass Calibration A compass calibration can be performed through this dialog, as well as through the Smart Page. Please refer to Section 7.5.4 for details on how to perform a compass calibration with the RS5. C-3. System Test The System Test can be performed through this dialog, as well as through the Smart Page.
- Page 138 C-4. Terminal Emulator The RSQ software provides a terminal emulator interface for advanced users who have been in contact with SonTek Technical Support and have received special instructions for issuing terminal commands. The terminal emulator interface is shown below: C-5. Firmware Upgrade The Firmware Upgrade button allows the user to load new firmware onto the RS5.
- Page 139 The RSQ software will point to a default firmware folder, and search for a firmware file (with extension .bin). If the user is provided with a different firmware file (as a beta tester, or for any other reason), the user can navigate to the location where that file is located.
- Page 140 C-6. Instrument Options This function contains various settings the user can enable, if desired. They include: Enable GNSS Configure GNSS Antenna These settings allow the user to enable the GNSS/GPS function on their RS5 and to configure an external GNSS/GPS antenna to connect to the RS5. Please see Appendix D for detailed instructions on how to Enable External GNSS and configuring it.
-
Page 141: Appendix D. How To Enable External Gnss Using The Gnss Unlock Code
Appendix D. How to Enable External GNSS using the GNSS Unlock Code The GNSS/GPS unlock and configuration operations can be found through Tools > Hardware Utilities > Instrument Options. Please note that the RS5 system must be connected to see these options. The Instrument Options dialog is shown below: If the user has upgraded their RS5-Basic system to RS5-Max, they will need to first use the unlock code provided by SonTek to enable the GNSS/GPS capabilities of the Max system. - Page 142 If the user is configuring an external GNSS/GPS antenna to use for the first time, the antenna must be configured for serial communications at a baud rate of 38400. The data output rate for the strings required should be configured according to the following table: Message Required Output Rate...
- Page 143 If successful, the following message will appear: If the process fails, please check all connections and ensure that the antenna is on and receiving proper GNSS location data. The antenna is now configured to work with the RS5. This process does not need to be repeated each time the antenna is connected to the RS5, and is only required the first time.
-
Page 144: Appendix E. Matlab Export File Structure
Appendix E. Matlab Export File Structure IMPORTANT NOTES: • The term “sample” refers to a single vertical profile, taken over a period of 1 s. • For the four parameters containing Velocity data (BottomTrack.BT_Vel, Summary.Mean_Vel, Summary.Boat_Vel, and WaterTrack.Velocity), the data are in the same coordinate system that was selected in the software when the .mat file was exported. - Page 145 Summary Calculated discharge variables and the data used to compute them System Core system related parameters: Compass, Temperature, Time, SNR, Voltage and Profiling settings Transformation_Matrices System frequencies and transformation matrices WaterTrack Water velocity and profiling variables in coordinates selected for output BottomTrack Structure Parameter Name Description...
- Page 146 GPS Structure Parameter Name Description Size Altitude Altitude NS x 1 DBT_DGPS Ratio of bottom track distance to GGA track distance NS x 1 GC_BC Angle of average GPS course since start of transect NS x 1 minus ADP bottom-track course (if valid) Gps_Age Age of GPS data record NS x 1...
- Page 147 VtgTmgTrue $GPVTG true course made good for each high frequency GPS NS x 50 sample (degrees) Setup Structure Parameter Name Description Size sensorDepth Transducer depth (m) screeningDistance Vertical screening distance (m) userSalinity User input salinity (pss) magneticDeclination Magnetic Declination (degrees) offsetX GPS Antenna Offset (X) offsetY...
- Page 148 Units Units used SiteInfo Structure Parameter Name Description Size Site_Name Entry in Site Name Station_Number Entry in Station Number Location Entry in Location Party Entry in Party Boat_Motor Entry in Boat Motor Meas_Number Entry in Measurement Number GaugeHeightInformation Entry in GaugeHeightInformation Comments Entry in Comments Summary Structure...
- Page 149 Time Time for each sample NS x 1 Units Units used Transformation Matrices Structure Parameter Name Description Size Frequency Frequencies available for the system 3 x 1 Matrix Transformation matrices for each frequency 4 x 4 x 3 WaterTrack Structure Parameter Name Description Size...
Need help?
Do you have a question about the Sontek River Surveyor RS5 and is the answer not in the manual?
Questions and answers