Table of Contents
Advertisement
Quick Links
Advertisement
Table of Contents

Related Manuals for Keysight Technologies U4301


Summary of Contents for Keysight Technologies U4301
- Page 1 Keysight U4301 PCIe Gen3 Analyzer User’s Guide...
- Page 2 COVERING THE MATERIAL IN THIS the Software. With respect to any technical DOCUMENT THAT CONFLICT WITH THESE data as defined by FAR 2.101, pursuant to FAR 12.211 and 27.404.2 and DFARS 227.7102, the U.S. government acquires no Keysight U4301 PCIe Gen3 Analyzer User’s Guide...
-
Page 3: Safety Summary
Keysight Technologies assumes no liability for the customer's failure to comply with these requirements. Product manuals are provided with your instrument on CD-ROM and/or in printed form. - Page 4 On (mains supply) Off (mains supply) Standby (mains supply). The instrument is not completely disconnected from the mains supply when the power switch is in the standby position In position of a bi-stable push switch Keysight U4301 PCIe Gen3 Analyzer User’s Guide...
- Page 5 Caution, hot surface Ionizing radiation Indicates that antistatic precautions should be taken CAT I IEC Measurement Category I CAT II Measurement Category II CAT III Measurement Category III CAT IV Measurement Category IV Keysight U4301 PCIe Gen3 Analyzer User’s Guide...
-
Page 6: Compliance And Environmental Information
Product Category: With reference to the equipment types in WEEE Directive Annex I, this product is classified as a “Monitoring and Control instrumentation product”. Do not dispose in household waste. To return unwanted products, contact your local Keysight office, or see www.keysight.com/environment/product/ for more information. Keysight U4301 PCIe Gen3 Analyzer User’s Guide... -
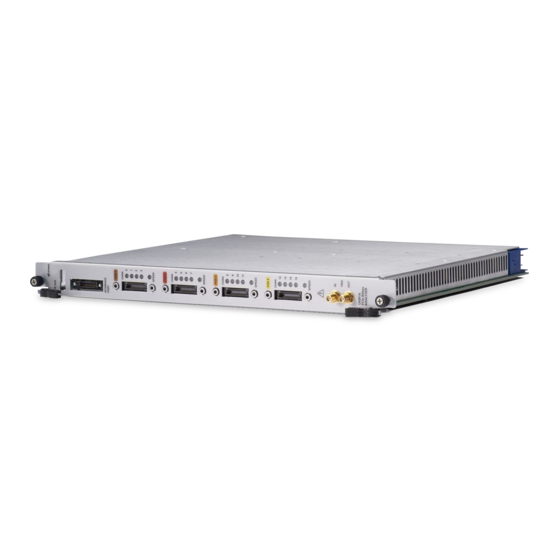
Page 7: U4301A/B Pcie Gen3 Analyzer-At A Glance
Powerful hardware features ensure capture of important transition events: • Dual phase lock loops (PLLs) per direction ensuring that the analyzer will lock on speed change events quickly and not miss any critical data. Keysight U4301 PCIe Gen3 Analyzer User’s Guide... - Page 8 This external oscilloscope correlation and data display feature is also referred to as View Scope. To know more about this feature and how to use it with the U4301 Analyzer, refer to the External Oscilloscope Time Correlation and Data Display Online Help.
-
Page 9: Using The Pcie Gen3 Analyzer
"Viewing and Interpreting Equalization Summary Data" on page 106 • Chapter 10, "Configuring and Computing Decoded Transactions" on page 115 • Chapter 11 "Viewing Offline Performance Summary" on page 157 See Also • U4305 PCIe Gen3 exerciser documentation. Keysight U4301 PCIe Gen3 Analyzer User’s Guide... - Page 10 Keysight U4301 PCIe Gen3 Analyzer User’s Guide...
-
Page 11: Table Of Contents
Creating a Physical Layer Tuning File To create a physical layer tuning file LEDs display during BER Based Tuning Loading a Tuning File in the Logic and Protocol Analyzer GUI Tuning a Bidirectional Setup Keysight U4301 PCIe Gen3 Analyzer User’s Guide... - Page 12 Viewing a Traffic Overview Chart To display a traffic overview chart Understanding the Displayed Traffic Overview Chart Customizing the Traffic Overview Chart Zooming In/Out the Traffic Overview Chart Placing markers in the traffic overview chart Keysight U4301 PCIe Gen3 Analyzer User’s Guide...
- Page 13 Navigating Through Transactions Navigating Between Transactions and their Associated Packets Visualizing a Transaction Set (Super Transaction) Viewing NVMe Transactions Viewing Transactions for NVMe Controller Initialization Viewing Admin Command Transactions Viewing NVMe I/O Command Transactions Keysight U4301 PCIe Gen3 Analyzer User’s Guide...
- Page 14 Showing/Hiding the Chart Legend Showing/Hiding the Band Chart Viewing the Center of the Chart Zooming In/Out Charts Moving a Performance Series Chart to Front Exporting Performance Summary Charts Data to a .csv or an Excel File Keysight U4301 PCIe Gen3 Analyzer User’s Guide...
- Page 15 Contents 12 Glossary Index Keysight U4301 PCIe Gen3 Analyzer User’s Guide...
- Page 16 Contents Keysight U4301 PCIe Gen3 Analyzer User’s Guide...
-
Page 17: Hardware And Software Installation
Keysight U4301 PCIe Gen3 Analyzer User’s Guide Hardware and Software In- stallation You install the U4301B PCIe Gen3 analyzer in a Keysight AXIe chassis (for example, the M9502A 2 slot chassis). The U4301A PCIe Gen3 analyzer module can be installed in a Keysight Digital Test Console chassis (for example, the U4002A portable 2-slot chassis) or a Keysight AXIe chassis (for example, the M9502A 2-slot chassis). - Page 18 Hardware and Software Installation Keysight U4301 PCIe Gen3 Analyzer User’s Guide...
-
Page 19: Probing Options For Pcie Gen3
Details about these probing options (and other PCIe Gen3 tools) can be found in the "PCI Express Gen3 Hardware and Probing Guide". This guide is installed with the Logic and Protocol Analyzer software and can also be downloaded www.keysight.com from the Document Library tab of the U4301 module on... - Page 20 Probing Options for PCIe Gen3 Keysight U4301 PCIe Gen3 Analyzer User’s Guide...
-
Page 21: Specifying The Connection Setup
Keysight U4301 PCIe Gen3 Analyzer User’s Guide Specifying the Connection Setup Once you have connected the U4301A/B module, probing hardware, and DUT in the required configuration based on your probing requirements, the next step is to configure the connection setup for the U4301A/B module in the Keysight Logic and Protocol Analyzer application. -
Page 22: U4321A Solid Slot Interposer Card
If you have set up a swizzled x1 to x8 bidirectional configuration using the U4324A Flying Lead probes, then you need to select the U4324A Flying Lead Probe Bi Swizzled as the probing option and Bidirectional as the link type. Keysight U4301 PCIe Gen3 Analyzer User’s Guide... -
Page 23: U4328A M.2 (M-Key) Interposer
Based on your probing setup and the link type needed, select an appropriate probing option from the Footprint listbox. Refer to the “Probing options" on page 21 to know more about these options. Keysight U4301 PCIe Gen3 Analyzer User’s Guide... - Page 24 If you have installed multiple U4301A/B modules in the chassis, all these modules are listed in the Module section of the tab. You need to select the probing option individually for these modules. Specify the link type. Keysight U4301 PCIe Gen3 Analyzer User’s Guide...
- Page 25 Module section of the tab. You need to select the link type individually for these modules. Select the link width. By default, the link width is set to the maximum link width available to the U4301 module at which it can capture data. This maximum link width available is based on the module’s license options installed and the link type (Unidirectional/Bidirectional) that you selected.
- Page 26 • If you do not select the Auto option, the link width of the U4301 module is fixed to the value you set in the Link Width field. As a result, the data is captured only if the link width in the captured data matches the set link width.
- Page 27 Specifying the Connection Setup c Close the Connection Diagram dialog. Select the clock source: Keysight U4301 PCIe Gen3 Analyzer User’s Guide...
- Page 28 Select the master lane. You can select any lane as the master lane from the lanes displayed in the Master Lane listbox. The lanes are displayed as per the selected link width. The lane that you select as the master lane is considered the lane for capturing the ordered sets. Keysight U4301 PCIe Gen3 Analyzer User’s Guide...
- Page 29 Specify whether lane reversal is on or off for the U4301 module. • The On option sets the lane reversal feature to On for the U4301 module and configures the module to perform lane reversal. This option requires that the lane reversal should be On for the monitored link as well otherwise the data capture will not happen on encountering a mismatch in the lane reversal On/Off value at the DUT and Analyzer ends.
- Page 30 Click Auto or Manual to toggle between the types of polarity inversion specification. When Auto is selected, the polarity of the lanes is set automatically during the initial link training. b When manual selection is chosen, select the lanes that are inverted. Keysight U4301 PCIe Gen3 Analyzer User’s Guide...
- Page 31 For example, if the link width is selected as x4, then the Lane 0, 1, 2, and 3 are available for lane ordering. Keysight U4301 PCIe Gen3 Analyzer User’s Guide...
- Page 32 Specifying the Connection Setup Keysight U4301 PCIe Gen3 Analyzer User’s Guide...
-
Page 33: Setting The Capture Options
Keysight U4301 PCIe Gen3 Analyzer User’s Guide Setting the Capture Options The Capture Setup tab in the PCIe Gen3 analyzer's Setup dialog lets you set basic capture options. In the Keysight Logic and Protocol Analyzer application's Overview window, from the PCIe Gen3 analyzer module's drop-down menu, select Setup>Setup.. - Page 34 Auto speed option, then the speed LED will glow according to the detected speed. NOTE: If you want to set the Capture Link Speed to Gen1, Gen2, or Gen3, then you must ensure that Lane Reversal is not set to Auto in the Connection Setup tab. Keysight U4301 PCIe Gen3 Analyzer User’s Guide...
- Page 35 • Enabled - Select this option if you want the U4301 Analyzer to trim the last packet from the trace. At times, the last packet in the trace may not get captured completely and therefore you may want to trim this packet by selecting this option.
- Page 36 There was no overlapping data available for the two directions. When testing L0s/L1, ensure that you: NOTE - set manual lane polarity. - select a fixed capture link speed instead of the Auto speed. Keysight U4301 PCIe Gen3 Analyzer User’s Guide...
-
Page 37: Tuning The Analyzer For A Specific Dut
Keysight U4301 PCIe Gen3 Analyzer User’s Guide Tuning the Analyzer for a Spe- cific DUT PCIe Gen3 Tuning Overview / 38 Preparing the U4301A/B Module and DUT for Tuning / 41 Creating a Physical Layer Tuning File / 42 Loading a Tuning File in the Logic and Protocol Analyzer GUI / 48 Tuning a Bidirectional Setup / 50 Fine Tuning a .ptu File / 51... -
Page 38: Pcie Gen3 Tuning Overview
The .ptu file contains the information necessary to adjust the probing system for a specific device-under-test (DUT). At the 8 Gbps speed, you then need to load this .ptu file into the U4301 Analyzer module’s software to have the best possible eye at the Analyzer. -
Page 39: Tuning - Broad Steps
Analyzer GUI to perform tuning. You can create a .ptu file using the Logic and Protocol Analyzer GUI. Tuning - Broad steps The following picture illustrates the broad steps involved in the tuning flow. Keysight U4301 PCIe Gen3 Analyzer User’s Guide... -
Page 40: Tuning Method
This method minimizes the deviations of the observed Vertical Eye characteristics versus the desired Vertical Eye characteristics. From the DUT participation perspective, this method only requires that the DUT must not have transitions to or from Electrical Idle at 8Gbps. Keysight U4301 PCIe Gen3 Analyzer User’s Guide... -
Page 41: Preparing The U4301A/B Module And Dut For Tuning
Connection Setup tab of the U4301A/B module’s Setup dialog box before starting the tuning. These settings are used in the tuning process and incorrect settings can result in incorrect tuning. Keysight U4301 PCIe Gen3 Analyzer User’s Guide... -
Page 42: Creating A Physical Layer Tuning File
Analyzer GUI to tune the system. To create a physical layer tuning file Perform these steps on the host PC that is physically connected to the U4301 Analyzer module. Exit the Keysight Logic and Protocol Analyzer application if it is currently active. - Page 43 From this list, select the module which you want to tune. Select the Use Specified Tuning File option from the Tuning File Selection section. Click the New Tune... button to open the Tuning File Creation dialog box. Keysight U4301 PCIe Gen3 Analyzer User’s Guide...
- Page 44 This option is not recommended for use if all the lanes are not converged. Keysight U4301 PCIe Gen3 Analyzer User’s Guide...
- Page 45 The tuning process starts. The Tuning Log section displays the results of the tuning process run operation. If the tuning process completes successfully, the specified .ptu file gets created. A tuning log file is also created with the same name and location as the tuning file. Keysight U4301 PCIe Gen3 Analyzer User’s Guide...
- Page 46 Tuning the Analyzer for a Specific DUT 11 Click OK to close the Tuning File Creation dialog box. The newly created tuning file is now loaded for use in the Phy Tuning tab. Keysight U4301 PCIe Gen3 Analyzer User’s Guide...
-
Page 47: Leds Display During Ber Based Tuning
Tuning the Analyzer for a Specific DUT LEDs display during BER Based Tuning The U4301 Analyzer module has 16 channel LEDs and four speed LEDs. The following table lists the interpretation of these LEDs display during BER-based tuning. Field Description... -
Page 48: Loading A Tuning File In The Logic And Protocol Analyzer Gui
Select the tuning file and click Open in the Open dialog box. The tuning file is now loaded for use. Keysight U4301 PCIe Gen3 Analyzer User’s Guide... - Page 49 Tuning the Analyzer for a Specific DUT Click Apply or OK. Keysight U4301 PCIe Gen3 Analyzer User’s Guide...
-
Page 50: Tuning A Bidirectional Setup
However, for a x16 bidirectional configuration, you need two U4301A/B modules. Therefore, for such a configuration, you need two separate tuning files, one for each module. Each module is tuned separately using its tuning file. Keysight U4301 PCIe Gen3 Analyzer User’s Guide... -
Page 51: Fine Tuning A .Ptu File
.ptu file applicable for your probe and connection setup is used for fine tuning. Click New Tune..Select Fine Tune Previous Results from the Tuning Method listbox in the Tuning File Creation dialog box. Keysight U4301 PCIe Gen3 Analyzer User’s Guide... - Page 52 Click Perform Tune. The fine tuning process starts and the fine tuning progress is displayed with a progress bar. Keysight U4301 PCIe Gen3 Analyzer User’s Guide...
- Page 53 When fine tuning completes, click OK to close the Tuning File Creation dialog box. On successful completion, the fine-tuned PTU file is created at the specified location along with a tuning log with the same name as the fine-tuned PTU file. Keysight U4301 PCIe Gen3 Analyzer User’s Guide...
- Page 54 Tuning the Analyzer for a Specific DUT Keysight U4301 PCIe Gen3 Analyzer User’s Guide...
-
Page 55: Setting Up Triggers
Keysight U4301 PCIe Gen3 Analyzer User’s Guide Setting Up Triggers Setting Up Simple Triggers / 56 Setting Up Advanced Triggers / 59 Setting General Trigger Options / 64 Setting up a Trigger on Physical Layer Errors / 66 The U4301A/B PCIe Gen3 analyzer lets you set up triggers (events that specify when to capture a... -
Page 56: Setting Up Simple Triggers
Setting Up Triggers Setting Up Simple Triggers In the Keysight Logic and Protocol Analyzer application's Overview window, select Setup>Trigger..from the PCIe analyzer module's drop-down menu, In the Trigger dialog: Keysight U4301 PCIe Gen3 Analyzer User’s Guide... - Page 57 If you select the Filter Everything option from this list, then none of the acquired samples will qualify to be stored in the analyzer memory. As a result, analyzer will keep running and you need to stop it manually because analyzer keeps Keysight U4301 PCIe Gen3 Analyzer User’s Guide...
- Page 58 To trigger on CLKREQ#, the Store CLKREQ# Transitions field must be set to Enabled. When CLKREQ# is used as the trigger event, the U4301 module triggers on encountering the CLKREQ# asserted/deasserted packet (as the case maybe as per the trigger condition). The timestamp of this trigger is recorded and displayed as the time of the first PCIe packet seen after sampling the CLKREQ# assertion.
-
Page 59: Setting Up Advanced Triggers
Setting Up Triggers Setting Up Advanced Triggers In the Keysight Logic Analyzer application's Overview window, from the PCIe analyzer module's drop-down menu, select Setup>Trigger..In the Trigger dialog: Keysight U4301 PCIe Gen3 Analyzer User’s Guide... - Page 60 As a result, analyzer will keep running and you need to stop it manually because analyzer keeps acquiring data until the memory depth is full. If you do not select any option from the list, Keysight U4301 PCIe Gen3 Analyzer User’s Guide...
- Page 61 To trigger on CLKREQ#, the Store CLKREQ# Transitions field must be set to Enabled. When CLKREQ# is used as the trigger event, the U4301 module triggers on encountering the CLKREQ# asserted/deasserted packet (as the case maybe as per the trigger condition). The timestamp of this trigger is recorded and displayed as the time of the first PCIe packet seen after sampling the CLKREQ# assertion.
-
Page 62: Using Timers In Advanced Triggers
Reset and Stop Timer action to accomplish this. (Refer to the timer example given below in this topic) • The U4301 module provides two timers, Timer 1 and 2. Ensure that you use the correct timer in both event and action. To insert a timer in an event statement Drag the Timer event from the events list on the left of the Trigger dialog and drop it to the event statement on the right. - Page 63 “To select which links the trigger is for" on page 64 • “To set the trigger position" on page 64 • “To save/recall favorite triggers" on page 64 • “To clear the current trigger" on page 65 Keysight U4301 PCIe Gen3 Analyzer User’s Guide...
-
Page 64: Setting General Trigger Options
The top of the Trigger dialog has a Favorite Triggers drop-down menu for saving trigger setups and recalling previously saved trigger setups. Do not confuse these "favorite" triggers with the favorites that appear in the left-side pane (which are added using the Event Editor dialog). Keysight U4301 PCIe Gen3 Analyzer User’s Guide... -
Page 65: To Clear The Current Trigger
Setting Up Triggers To clear the current trigger The top of the Trigger dialog has a Clear button for erasing the current trigger setup and restoring the default trigger setup. Keysight U4301 PCIe Gen3 Analyzer User’s Guide... -
Page 66: Setting Up A Trigger On Physical Layer Errors
Setting Up Triggers Setting up a Trigger on Physical Layer Errors Physical Layer Errors Supported for Triggering The U4301 Analyzer supports the following physical layer error types to allow you to set up a trigger on error. Physical Layer Error... - Page 67 Click OK to reflect your error selections in the trigger event. Click Apply and then OK to complete the trigger on error setup. For an advanced trigger Keysight U4301 PCIe Gen3 Analyzer User’s Guide...
-
Page 68: To View The Trigger On Error And Errored Packet
END symbol. The Trigger on error position and errored packet are highlighted in the screen below. Disparity Error Example The following example displays a trigger on encountering a packet with an incorrect disparity. Keysight U4301 PCIe Gen3 Analyzer User’s Guide... - Page 69 Trigger setup, this packet did not get stored. However, there may be other reasons for an errored packet not appearing in the Protocol Viewer even when the trigger on error occurred. The next topic describes the possible reasons. Keysight U4301 PCIe Gen3 Analyzer User’s Guide...
-
Page 70: Error Occurred
Even after enabling the Logical Idle storage, the errored packet may not get captured/displayed because: • The U4301 Analyzer can store upto 10000 logical idle bytes. The errored packet may have occurred after the Analyzer reached this limit resulting in this packet not getting stored. -
Page 71: Running/Stopping Captures
Keysight U4301 PCIe Gen3 Analyzer User’s Guide Running/Stopping Captures Running and stopping the U4301A/B PCIe Gen3 analyzer is just like running and stopping any other analyzer. See "Running/Stopping Measurements" (in the online help). - Page 72 Running/Stopping Captures Keysight U4301 PCIe Gen3 Analyzer User’s Guide...
-
Page 73: Viewing Pcie Gen3 Packets And Traffic Overview
Keysight U4301 PCIe Gen3 Analyzer User’s Guide Viewing PCIe Gen3 Packets and Traffic Overview Filtering Packets Displayed in Protocol Viewer / 75 Searching for Specific Packets in Protocol Viewer / 80 Compacting the Display of Training Sequence Packets / 82... - Page 74 In this screen, the Lanes tab of the Protocol Viewer window is displayed. The Lanes viewer displays not just the selected packet data across lanes but also the post packet data represented by colors matching the selected packet color in the upper pane. Keysight U4301 PCIe Gen3 Analyzer User’s Guide...
-
Page 75: Filtering Packets Displayed In Protocol Viewer
You can filter the display of packets based on types of packets, ordered sets, framing tokens, assertion or deassertion of the CLKREQ# signal, or errors. As an example, the filtering setup in the following screen is defined to display only packets with errors. Keysight U4301 PCIe Gen3 Analyzer User’s Guide... - Page 76 Viewing PCIe Gen3 Packets You can also view the defined filtering setup in the Filter/Colorize tool that the Simple Packet Filter added to the Overview window. Keysight U4301 PCIe Gen3 Analyzer User’s Guide...
-
Page 77: Filtering Bidirectional Packets Data
In the second screen, the Simple Packet Filter creates two separate clauses for the Upstream and Downstream data and reflects the filtering setup that you defined in both these clauses. Finally, in the third screen, the filtered bidirectional data is displayed. Keysight U4301 PCIe Gen3 Analyzer User’s Guide... - Page 78 Viewing PCIe Gen3 Packets Keysight U4301 PCIe Gen3 Analyzer User’s Guide...
- Page 79 Viewing PCIe Gen3 Packets Keysight U4301 PCIe Gen3 Analyzer User’s Guide...
-
Page 80: Searching For Specific Packets In Protocol Viewer
Protocol Viewer. If there are multiple packets in the trace matching the search criterion, then you can directly navigate to these packets using the Find Previous Packet and Find Next Packet buttons displayed with the Search field. Keysight U4301 PCIe Gen3 Analyzer User’s Guide... - Page 81 The screen below displays some of the supported error types which you can use as the search criteria. • The Search feature also lets you search packets based on the assertion/deassertion of the CLKREQ# signal. Keysight U4301 PCIe Gen3 Analyzer User’s Guide...
-
Page 82: Compacting The Display Of Training Sequence Packets
TS1 and TS2 packets are compacted as specific sets per direction and are listed as one entry per set in the Protocol Viewer. The number of packets that have been compacted into one entry/set is represented through the numeric value displayed with the entry/set. Keysight U4301 PCIe Gen3 Analyzer User’s Guide... -
Page 83: To Configure The Compact Setup
The compact setup is now configured as per your selections. When you enable compact, the packets will be compacted as per this configured setup. If the compact is already enabled, the changed setup configuration will be automatically reflected in the compacted packets display. Keysight U4301 PCIe Gen3 Analyzer User’s Guide... -
Page 84: To Enable The Compact Display
Clicking the Compact button flips the current display of packets from Compact to Not NOTE Compact and vice versa. The Compact button’s drop-down menu displays the current selection mode in terms of whether or not compact is currently enabled. Keysight U4301 PCIe Gen3 Analyzer User’s Guide... -
Page 85: Viewing The Captured Pcie Traffic Statistics
PCIe packets displayed in the upper pane. The following screen displays the traffic statistics for the data range starting from M1 and ending at M2 markers. Keysight U4301 PCIe Gen3 Analyzer User’s Guide... - Page 86 NOTE becomes enabled when the capture has stopped. If you want to compute traffic overview statistics in background while the U4301 module is capturing PCIe data, then select the Compute All on Run check box in the Protocol Viewer and click the Run toolbar button. This allows you to perform a compute for all the relevant tabs in Protocol Viewer automatically after the data capture is complete.
-
Page 87: Navigating Through The Captured Pcie Packets
To do this, select the count of packets displayed for a particular packet type in the traffic statistics in the required direction. Then specify the packet number in the Navigation text box and click Go to reach directly to that packet. Keysight U4301 PCIe Gen3 Analyzer User’s Guide... - Page 88 When you select multiple packet types, the Navigation section displays the total packet count for all the selected packet types. Keysight U4301 PCIe Gen3 Analyzer User’s Guide...
-
Page 89: Viewing A Traffic Overview Chart
• the packets types which you want to display in the traffic overview statistics and chart. • hiding or displaying the Y-axis of the chart. Keysight U4301 PCIe Gen3 Analyzer User’s Guide... -
Page 90: Zooming In/Out The Traffic Overview Chart
When you release the left mouse button, the defined X-axis area is zoomed for the displayed chart. Following screen displays a zoomed in traffic overview chart. Keysight U4301 PCIe Gen3 Analyzer User’s Guide... -
Page 91: Placing Markers In The Traffic Overview Chart
This helps you navigate to the exact trace position that corresponds to that chart location. Markers placed in the chart are correlated to markers displayed in the trace data in the upper pane of the Protocol Viewer. Keysight U4301 PCIe Gen3 Analyzer User’s Guide... - Page 92 If the markers are not displayed in the chart, click the Show Markers button at the top of the NOTE chart pane. Keysight U4301 PCIe Gen3 Analyzer User’s Guide...
-
Page 93: Exporting Packet Times From A Traffic Overview Chart To A .Csv Or An Excel File
Click the Packet Times button in the Export section of the Traffic Overview tab. This button is disabled if the traffic overview chart is not displayed in the tab. The Traffic Overview Export dialog box is displayed. Keysight U4301 PCIe Gen3 Analyzer User’s Guide... - Page 94 The packet time (X-axis value) of each packet belonging to the selected packet types is exported to the specified file. The direction and packet types are represented as column headers in this exported data. A sample of the exported packet times is displayed. Keysight U4301 PCIe Gen3 Analyzer User’s Guide...
-
Page 95: Exporting Captured Pcie Data To A .Csv File
.csv file. For details on how to export data to a .csv file, click the Help button in the Protocol Export dialog box. Keysight U4301 PCIe Gen3 Analyzer User’s Guide... - Page 96 Viewing PCIe Gen3 Packets Keysight U4301 PCIe Gen3 Analyzer User’s Guide...
-
Page 97: Viewing Ltssm States, State Transitions, And Equalization Summary
Keysight U4301 PCIe Gen3 Analyzer User’s Guide Viewing LTSSM States, State Transitions, and Equalization Summary LTSSM Overview / 98 Configuring and Computing LTSSM States and Equalization Summary / 102 Viewing LTSSM States/Transitions Data / 104 Viewing and Interpreting Equalization Summary Data / 106... -
Page 98: Ltssm Overview
To display these states, transitions and equalization summary, the software analyzes a user-specified data range or the entire data captured in a trace and presents the list of transitions/states/EQ data, from that trace. Keysight U4301 PCIe Gen3 Analyzer User’s Guide... - Page 99 • Link initialization and configuration to bring the link to an operational state. • Link recovery or retraining in situations such as speed changes, power management, or recovering from a link error. Keysight U4301 PCIe Gen3 Analyzer User’s Guide...
- Page 100 • Downgrading or upgrading the link speed in response to a link speed change request. • Performing the Equalization procedure before reaching the Gen3 (8.0 GT/s) speed during the link training or retraining. Keysight U4301 PCIe Gen3 Analyzer User’s Guide...
-
Page 101: Prerequisites
You have set up the U4301A/B analyzer module and captured the PCIe data for the required direction(s). • You have configured the LTSSM setup to get the data display in the LTSSM overview pane according to your requirements. (Described in the next section) Keysight U4301 PCIe Gen3 Analyzer User’s Guide... -
Page 102: Configuring And Computing Ltssm States And Equalization Summary
LTSSM data (in their respective tabs) for the captured packets by a single click of this button. • Compute This allows you to compute only LTSSM data from the captured packets. When you click Compute, then also only LTSSM data is computed. Keysight U4301 PCIe Gen3 Analyzer User’s Guide... - Page 103 Viewing LTSSM States and State Transitions If you want to compute LTSSM data in background while the U4301 module is capturing PCIe NOTE data, then select the Compute All on Run check box in the Protocol Viewer and click the Run toolbar button.
-
Page 104: Viewing Ltssm States/Transitions Data
The screen below displays the results of a compute operation for LTSSM states followed by a description of these results. The LTSSM states results are described in the following two sections, as highlighted in the pane in the above screen. Keysight U4301 PCIe Gen3 Analyzer User’s Guide... - Page 105 To ensure the inclusion of these substates in the computed LTSSM data, you must set the Store CLKREQ# Transitions field to Enabled in the Trigger dialog box before starting the data capture. Keysight U4301 PCIe Gen3 Analyzer User’s Guide...
-
Page 106: Viewing And Interpreting Equalization Summary Data
Overview tab (when the Compute EQ checkbox is selected). In the following screen, EQ has been selected in the Setup groupbox to display the computed equalization summary data. The equalization summary results highlighted in the screen above are described as follows. Keysight U4301 PCIe Gen3 Analyzer User’s Guide... -
Page 107: Exporting Equalization Summary Data To An Excel File
You can export the computed equalization summary data to an Excel file by performing the following steps. In the LTSSM Overview tab, click the File option displayed in the right most section. Select the Export as XLSX To File... option. Keysight U4301 PCIe Gen3 Analyzer User’s Guide... -
Page 108: Customizing The Display In The Equalization Summary Section
In the LTSSM Overview tab, click the Field Chooser button displayed under File in the right most pane. The Field Chooser dialog box is displayed with all the available fields for the equalization summary data. Keysight U4301 PCIe Gen3 Analyzer User’s Guide... - Page 109 The fields that you chose to hide from display can be displayed back anytime along with their NOTE computed equalization data by simply selecting these fields again in the Field Chooser dialog box. Keysight U4301 PCIe Gen3 Analyzer User’s Guide...
-
Page 110: Navigating Through The Ltssm Transitions/States/Eq Occurrences
You can also double-click a state, transition, or an EQ entry to quickly navigate to its NOTE associated packet in the upper pane. Keysight U4301 PCIe Gen3 Analyzer User’s Guide... -
Page 111: Interpreting Ltssm States And Transition Results
You can view either the overall LTSSM state diagram or the Configuration or Recovery substates diagram (examples displayed below). Keysight U4301 PCIe Gen3 Analyzer User’s Guide... - Page 112 The state/substate that you select from the states list on the left is highlighted in the LTSSM state diagram. A yellow colored arrow is used with the states that occurred before and after the selected state. Keysight U4301 PCIe Gen3 Analyzer User’s Guide...
-
Page 113: Computing And Viewing Decoded Transactions
Keysight U4301 PCIe Gen3 Analyzer User’s Guide 10 Computing and Viewing De- coded Transactions Transaction Decoding - Overview / 114 Configuring and Computing Decoded Transactions / 115 Interpreting and Navigating Through the Transaction Decode Results / 126 Viewing NVMe Transactions / 135... -
Page 114: Transaction Decoding - Overview
You use the Transaction Decode tab displayed in the lower pane of the Protocol Viewer to compute and view decoded transactions. This tab consist of two panes. The left pane displays a list of transactions. The right pane displays the number of occurrences of these transactions. Keysight U4301 PCIe Gen3 Analyzer User’s Guide... -
Page 115: Configuring And Computing Decoded Transactions
Configuring and Computing Decoded Transactions Before you Start • You should have purchased and installed the U4301 Transaction Decoder license for computing decoded transactions. On purchasing the license, you receive an entitlement certificate. Follow the instructions in this certificate to install the license. - Page 116 Computing and Viewing Decoded Transactions If you want to compute decoded transactions in background while the U4301 module is NOTE capturing PCIe data, then select the Compute All on Run check box in the Protocol Viewer and click the Run toolbar button. This allows you to perform a compute for all the relevant tabs in Protocol Viewer automatically after the data capture is complete.
-
Page 117: Defining / Verifying The Device Setup
Click Setup in the Transaction Decode tab of the Protocol Viewer. The Transaction Decode Setup dialog box is displayed with the autodiscovered device details from the captured PCIe data. Modify Device ID and Base Address, if needed. Keysight U4301 PCIe Gen3 Analyzer User’s Guide... - Page 118 If these are not autodiscovered, you can add a new queue by clicking Add Queue and specifying its ID, size, base address, and the unique MSI-X vector that the controller allocated to this queue to respond back. Keysight U4301 PCIe Gen3 Analyzer User’s Guide...
- Page 119 If a queue is physically non-contiguous, multiple PRP addresses are displayed for the queue representing multiple memory chunks. For a non-contiguous queue, you can add multiple PRP addresses by selecting a PRP address entry of the queue and clicking Add Address. Keysight U4301 PCIe Gen3 Analyzer User’s Guide...
- Page 120 Separate Buffer, it indicates that all the metadata for a command is transferred as a separate contiguous buffer of data. Click the MSI / MSI-X tab to view/modify the MSI / MSI-X capabilities that were discovered for the NVMe device. Keysight U4301 PCIe Gen3 Analyzer User’s Guide...
-
Page 121: Saving The Device Setup Details
Setup dialog box) in a Transaction decode (.tdprop) file. Once saved, you can open this file later in the Transaction Decode Setup dialog box to quickly access and set up the device details for a transaction decode computation. Keysight U4301 PCIe Gen3 Analyzer User’s Guide... -
Page 122: Viewing The Configuration Space Of A Dut
Compute decoded transactions in the Transaction Decode tab. Click the Config Space Summary button displayed in the top panel of the Transaction Decode tab. The configuration space summary of the DUT is displayed. Keysight U4301 PCIe Gen3 Analyzer User’s Guide... -
Page 123: Configuring Timestamps Displayed In The Computed Transactions
PCIe packet applicable for that transaction. This is the default selection. • Relative - Timestamp for a transaction is calculated relative to the time of the first packet applicable for the previous transaction in the list. Keysight U4301 PCIe Gen3 Analyzer User’s Guide... -
Page 124: Saving The Computed Transaction Data
You can clear the computed transaction data displayed in the Transaction Decode tab. Right-click a transaction displayed in the Transaction Decode tab. Click Clear Transaction Data... from the right-click context menu. Click Yes to confirm. The computed transactions display is cleared. Keysight U4301 PCIe Gen3 Analyzer User’s Guide... - Page 125 If the transactions data was previously saved in an .ala file, then reloading the .ala file redisplays the transactions data after it has been cleared. If the transactions data was not previously saved, you can specify the data range and then click Compute again to redisplay the transactions data. Keysight U4301 PCIe Gen3 Analyzer User’s Guide...
-
Page 126: Interpreting And Navigating Through The Transaction Decode Results
Overview pane of the Logic and Protocol Analyzer GUI. Refer to the topic “Viewing NVMe Transactions" on page 135 and “Viewing AHCI Transactions" page 147 to get an understanding of how NVMe and AHCI transactions are decoded and displayed. Keysight U4301 PCIe Gen3 Analyzer User’s Guide... -
Page 127: Transaction Overview Pane
Configuration Space: Selecting this option displays the number of occurrences of only PCIe config space transactions organized on the basis of reads and writes to PCIe configuration registers in the DUT’s configuration space. Keysight U4301 PCIe Gen3 Analyzer User’s Guide... - Page 128 IDs of multiple devices. The following screen displays organization by five queues (0 to 4) of the device with device ID (001:00:0). Keysight U4301 PCIe Gen3 Analyzer User’s Guide...
- Page 129 If multiple devices are involved, then this field provides you multiple options representing device IDs of multiple devices. The following screen displays organization by two ports (0 and 1) of the device with device ID (006:00:0). Keysight U4301 PCIe Gen3 Analyzer User’s Guide...
-
Page 130: Navigating Through Transactions
From the Transaction Overview pane on the lower-right, select a transaction type whose occurrences you want to navigate and view. The navigation bar in the Transaction Decode tab now displays the total number of occurrences found for the selected transaction type. Keysight U4301 PCIe Gen3 Analyzer User’s Guide... -
Page 131: Navigating Between Transactions And Their Associated Packets
Transaction Decode tab to synchronize the display of packets data with the selected transaction. In the following screen, double-clicking the transaction for modifying controller settings highlights the memory write packet for this modification. Keysight U4301 PCIe Gen3 Analyzer User’s Guide... - Page 132 A list of packets applicable for that transaction are displayed in a sequential order. Select a packet from this list. The packet that you selected gets highlighted in the upper pane of the Protocol Viewer. Keysight U4301 PCIe Gen3 Analyzer User’s Guide...
-
Page 133: Visualizing A Transaction Set (Super Transaction)
SQ (memory read and completion with data) transaction and then the PRP entries used for the Identify command. • then the Command Completion entry to the Completion Queue (CQ) transaction. • then the MSI-X interrupt generation transaction. Keysight U4301 PCIe Gen3 Analyzer User’s Guide... - Page 134 To get visualize transaction information specific to storage protocols, refer to “Viewing a Complete Set of Transactions for a Command Submission and Completion" on page 141 and “Visualizing a Complete Set of AHCI Transactions" on page 151. Keysight U4301 PCIe Gen3 Analyzer User’s Guide...
-
Page 135: Viewing Nvme Transactions
ACQ registers are modified to define the Admin Submission Queue and its corresponding Admin Completion Queue. The transactions display the Admin queue attributes in terms of size (128 entries) and the base address (64-bit physical address) to be used for Admin submission queue and completion queue. Keysight U4301 PCIe Gen3 Analyzer User’s Guide... -
Page 136: Viewing Admin Command Transactions
NVMe Identify transaction and selecting Decode Payload. You can also visualize how the data returned by the Identify command is stored in specific PRP entries by right-clicking the transaction and selecting Visualize Transaction... (see page 143 details). Keysight U4301 PCIe Gen3 Analyzer User’s Guide... -
Page 137: Viewing Nvme I/O Command Transactions
Computing and Viewing Decoded Transactions Viewing NVMe I/O Command Transactions The following screen displays an NVMe Read transaction to read data from the starting LBA specified in the Read command. Keysight U4301 PCIe Gen3 Analyzer User’s Guide... - Page 138 Memory Writes to write this data to the applicable PRP entries for data transfer to host. In the transaction following the NVMe Read transaction, the controller updates the completion queue 1 with the status of the Read command completion. Keysight U4301 PCIe Gen3 Analyzer User’s Guide...
-
Page 139: Viewing A Transaction Performance Chart
Compute the NVMe transactions data in the Protocol Viewer from the captured data. Then perform the following steps: Click Performance in the Chart section. Performance Button The empty Transaction Performance Chart dialog box appears. Keysight U4301 PCIe Gen3 Analyzer User’s Guide... - Page 140 You can change the default color of the dots in the Chart Color section. Hovering the cursor over the dots in the chart displays the exact size and the exact time of a particular transaction. Keysight U4301 PCIe Gen3 Analyzer User’s Guide...
-
Page 141: Viewing A Complete Set Of Transactions For A Command Submission And Completion
The first transaction indicates to the controller that a command is submitted for processing. The second transaction represents the NVMe Write command that the host created in the submission queue. The controller reads this command from the submission queue for execution and executes the command. Keysight U4301 PCIe Gen3 Analyzer User’s Guide... -
Page 142: Viewing Decoded Payload For Nvme Commands
The following screen displays the payload details of the NVMe Get Features command. The feature for which the information is retrieved is LBA Range Type. The displayed payload is as per the data structure format defined for LBA Range Type in NVMe specifications. Keysight U4301 PCIe Gen3 Analyzer User’s Guide... -
Page 143: Viewing Decoded Prps For Nvme Commands
To view the decoded PRPs of an NVMe command Right-click the transaction displayed for the command in the Transaction Decode tab. Select Visualize Transaction... A dialog box is displayed with PRPs and other related transactions associated with the command. Keysight U4301 PCIe Gen3 Analyzer User’s Guide... -
Page 144: Viewing Decoded Msi-X Table
In the Transaction Decode tab, navigate to the MSI-X Table transaction by double-clicking the MSI-X Table transaction type from the right pane. Right-click the highlighted MSI-X Table transaction in the left pane of the Transaction Decode tab and then select Decode MSI-X Table. Keysight U4301 PCIe Gen3 Analyzer User’s Guide... - Page 145 An MSI-X index entry is associated to a completion queue at the time of creation of the queue. You can view details about the MSI-X index entry associated to a completion queue in the Completion Queues tab of the Setup dialog box. Keysight U4301 PCIe Gen3 Analyzer User’s Guide...
- Page 146 Each MSI-X index entry in the MSI-X table has a base address associated to it. This is the address at which the controller writes the MSI-X interrupt for the associated completion queue. The following screen displays one such MSI-X Interrupt transaction for the completion queue 1. Keysight U4301 PCIe Gen3 Analyzer User’s Guide...
-
Page 147: Viewing Ahci Transactions
PCI Header registers such as Identifier (Device ID), Class Codes, AHCI Base Address <BAR5>, and Capabilities Pointer (CAP). • PCI Power Management Capability registers such as PMCAP • Message Signaled Interrupt Capability registers such as MSICAP Keysight U4301 PCIe Gen3 Analyzer User’s Guide... -
Page 148: Generic Host Control Registers Transactions - Examples
HBA registers that are applicable for the entire HBA. The Transaction Decode tab displays decoded transactions for these registers. The following screen shows some such transactions for generic host control registers. Keysight U4301 PCIe Gen3 Analyzer User’s Guide... -
Page 149: Port Specific Registers Transactions - Examples
AHCI device. The read and write transactions to these port registers are also displayed in the Transaction Decode tab. The following screen displays some examples of such ports register accesses. Keysight U4301 PCIe Gen3 Analyzer User’s Guide... -
Page 150: Sata Commands Transactions - Examples
The decoded AHCI transactions also include transactions for SATA Commands such as Identify Device, Set Features, Read FPDMA Queued, Write FPDMA Queued, and NOP. The following screens display some examples of decoded SATA Commands transactions. Keysight U4301 PCIe Gen3 Analyzer User’s Guide... -
Page 151: Visualizing A Complete Set Of Ahci Transactions
The second transaction is a memory read for the added command list entry. The third transaction is a memory read of the NOP command from the command table. Example 2 - Visualize the transaction set for a Write FPDMA Queued command transaction Keysight U4301 PCIe Gen3 Analyzer User’s Guide... -
Page 152: Viewing Decoded Payload For Ahci Commands
Serial ATA specifications. The Transaction Decode tab displays the decoded payload (all 256 words) for these commands to present their data structure as per the defined format. Keysight U4301 PCIe Gen3 Analyzer User’s Guide... -
Page 153: Viewing Prdt Entries For An Ata Command
Physical Region Descriptor Table (PRDT) is a table of scatter/gather list. It has zero to many entries. Each entry has a base address and byte counts in system memory where the device reads or writes the actual data transfer if the ATA command is a data transfer command. Keysight U4301 PCIe Gen3 Analyzer User’s Guide... - Page 154 In the following example, the 16 PRDT entries applicable for the first PRDT read transaction are highlighted. With each PRDT entry, its base address, bytes count, and the number of PCIe TLPs utilized for data transfer are also displayed. Keysight U4301 PCIe Gen3 Analyzer User’s Guide...
- Page 155 • displays the raw payload for the data transfer for the memory pointed to by that PRDT entry. • highlights the first PCIe packet utilized for data transfer for the memory pointed to by that PRDT entry. Keysight U4301 PCIe Gen3 Analyzer User’s Guide...
- Page 156 Computing and Viewing Decoded Transactions Keysight U4301 PCIe Gen3 Analyzer User’s Guide...
-
Page 157: Viewing Offline Performance Summary
Keysight U4301 PCIe Gen3 Analyzer User’s Guide 11 Viewing Offline Performance Summary Offline Performance Summary - Overview / 158 Configuring and Computing Offline Performance Summary / 161 Interpreting the Performance Summary Results / 170 Navigating Through the Performance Summary Results / 181 Customizing Charts / 186 Exporting Performance Summary Charts Data to a .csv or an Excel File / 197... -
Page 158: Offline Performance Summary - Overview
Performance statistics are displayed separately for upstream and downstream link directions. You do not need connectivity to the U4301 hardware module to generate performance NOTE summary from a captured PCIe trace. -
Page 159: The Overlay View - At A Glance
• Or select the checkbox for a series or a tree node in the statistics pane on the left. This automatically selects all the performance parameters applicable for that series or tree node. Keysight U4301 PCIe Gen3 Analyzer User’s Guide... - Page 160 The following screen displays the Overlay view after you select and compute a range: In the above screen, charts for the Data Flow Control tree node and Bandwidth performance parameter are displayed. Charts are represented by different colored dotted lines in both directions. Keysight U4301 PCIe Gen3 Analyzer User’s Guide...
-
Page 161: Configuring And Computing Offline Performance Summary
• Trigger - Selecting Trigger in the data range ensures that performance summary is computed from the point where the U4301 module’s trigger condition was met. • Markers - Selecting markers in the data range ensures that performance summary is computed for the specific portion of PCIe traffic defined by markers. -
Page 162: Saving The Computed Performance Summary Data
Viewing Offline Performance Summary If you want to compute performance summary in background while the U4301 module is NOTE capturing PCIe data, then select the Compute All on Run check box in the Protocol Viewer and click the Run toolbar button. This allows you to perform a compute for all the relevant tabs in Protocol Viewer automatically after the data capture is complete. -
Page 163: Defining Chart Settings
You can define settings for the overlay chart in the Setup... tab of the Settings section and change the appearance of the displayed chart. To access the Setup dialog box Click the Setup... button under the Settings section. The Setup dialog box appears as shown below. Keysight U4301 PCIe Gen3 Analyzer User’s Guide... - Page 164 The following is the list of tasks that you can do using the Setup dialog box: Showing/Hiding multiple Y-axis Select or de-select the Y-axis checkbox to show or hide the Y-axis displayed in the chart. Keysight U4301 PCIe Gen3 Analyzer User’s Guide...
- Page 165 You can define the maximum flow control credit limits for header and data flow control. To do this, you can separately define Header and Data InitFC values for posted, non-posted, and completion transactions for Upstream and Downstream directions. Keysight U4301 PCIe Gen3 Analyzer User’s Guide...
- Page 166 MSI and MSI-X Address row for which you want Interrupt to be generated and plotted in the Band Chart. Selecting this checkbox will generate interrupts for the specified address which you can view in the Band Chart. Keysight U4301 PCIe Gen3 Analyzer User’s Guide...
- Page 167 You can change the appearance of the graph representing the respective series listed in the Parameter column of the Setup dialog box. To do so, click the drop-down in the Type column and select the graph type you want to change with. Keysight U4301 PCIe Gen3 Analyzer User’s Guide...
- Page 168 Click the Reset button to restore the last settings done previously when you opened the Setup dialog box. This resets the Axis, Types and Colors to their previous state. • Clicking the Cancel button allows you to exit from the dialog box without making any changes. Keysight U4301 PCIe Gen3 Analyzer User’s Guide...
- Page 169 Charts area and select Show Color Picker Legend Window. The Performance Color Picker Legend window is displayed which allows you to change colors as well as serves the purpose of a legend for the charts. Keysight U4301 PCIe Gen3 Analyzer User’s Guide...
-
Page 170: Interpreting The Performance Summary Results
Such a chart gets displayed only when the required packets are found while computing performance summary to generate data for the chart. Keysight U4301 PCIe Gen3 Analyzer User’s Guide... - Page 171 For instance, in the following screen, the Completion with Data packets are used for calculating the minimum, maximum, and average payload size for Completions. In the absence of Completion with Data packets in the trace, the Completion statistics is shown --.--. Keysight U4301 PCIe Gen3 Analyzer User’s Guide...
-
Page 172: Charts Pane
Viewing Multiple Y-axis in the Chart Pane The chart pane displays multiple Y-axis if you select multiple Y-axis checkbox in the Setup... dialog box. To know more, see “Showing/Hiding multiple Y-axis" on page 164. Keysight U4301 PCIe Gen3 Analyzer User’s Guide... - Page 173 The lower section of the Chart pane displays the Band Chart. You can view MSI Write, Msg Assert_INT and Msg Deassert_INT and error packets in the Band chart area of the Chart pane. To know more, refer “Showing/Hiding the Band Chart" on page 191. Keysight U4301 PCIe Gen3 Analyzer User’s Guide...
-
Page 174: Flow Control
Flow control credit level is determined by the Writes and Completions in one direction and the UpdateFC packets in the other direction. The data series created for the flow Keysight U4301 PCIe Gen3 Analyzer User’s Guide... - Page 175 Error Packet- Shows the location in the graph where packets with any error occurred. This is displayed in the Band chart only when the Include Errors checkbox is enabled under Data Range heading. Keysight U4301 PCIe Gen3 Analyzer User’s Guide...
-
Page 176: Flow Control- Examples
This sometimes also leads to data loss. In such scenarios, you can use the Flow Control feature to display the credit limits of the data to be sent and the data received by the receiver. Keysight U4301 PCIe Gen3 Analyzer User’s Guide... - Page 177 Completions data. The blue and orange Pyramid Up chart line represents Memory CplD and UpdateFC_Cpl respectively. The UpdateFC_Cpl credit starts from an initial counter value and keeps on updating its credit limit till all the packets are sent and received. Keysight U4301 PCIe Gen3 Analyzer User’s Guide...
- Page 178 The quick drop in credit level is caused by the chain of link buffering. In the start, the data write or completion capacity remains higher than the sink capacity but lower than the link capacity. The data transfer at higher rate only happens while the link buffering capacity can sustain it. Keysight U4301 PCIe Gen3 Analyzer User’s Guide...
-
Page 179: Saving The Favorite Overlay Chart
To save the Overlay Chart Click Favorite Charts button> Save as. In the Save As dialog box, specify the name of the chart. Ensure that *.cfv (Chart Favorite) option is selected as the file type. Click Save. Keysight U4301 PCIe Gen3 Analyzer User’s Guide... - Page 180 Viewing Offline Performance Summary To view previously saved Overlay chart Click Favorite Charts button> Open. In the Open dialog box, navigate to the *.cfv file name by which you saved the Overlay chart. Click Open. Keysight U4301 PCIe Gen3 Analyzer User’s Guide...
-
Page 181: Navigating Through The Performance Summary Results
(trace view). Alternatively, right-click the chart location where you want to place a marker. Then select Place > New Marker or select an existing marker to place that marker at the current location. Keysight U4301 PCIe Gen3 Analyzer User’s Guide... - Page 182 If the markers are not displayed in charts, click the Show Markers button at the top of the NOTE charts pane. Keysight U4301 PCIe Gen3 Analyzer User’s Guide...
- Page 183 If the Extent Markers are not visible, then click the Extent Markers button at the top of the NOTE charts panes to display these markers in trace view as well as other viewers in Logic and Protocol Analyzer application. Keysight U4301 PCIe Gen3 Analyzer User’s Guide...
- Page 184 Max of 1024 displayed in blue color. Clicking these numbers, navigate you to MsgD packets with lengths of 1 and 1024 (DWords) that is accounted for the minimum and maximum value respectively in the upper pane. Keysight U4301 PCIe Gen3 Analyzer User’s Guide...
- Page 185 Protocol Viewer window. This is because the chart pane displays the graph of sampled series that represents an average value of all the packets transmitted during a particular micro second as defined in the sample rate field. Keysight U4301 PCIe Gen3 Analyzer User’s Guide...
-
Page 186: Customizing Charts
You can change how data is presented in a performance chart. To know, how to change the chart display, see “Changing the appearance of the graph" on page 167. By default, data is presented as Dash Line chart type. The following chart type options are available. Keysight U4301 PCIe Gen3 Analyzer User’s Guide... - Page 187 Viewing Offline Performance Summary • Line - • Dash Line- Keysight U4301 PCIe Gen3 Analyzer User’s Guide...
- Page 188 Viewing Offline Performance Summary • Dot Line - • Triangle Up/Down - Keysight U4301 PCIe Gen3 Analyzer User’s Guide...
- Page 189 Viewing Offline Performance Summary • Pyramid Up/Down - • Perpendicular Up/Down- Keysight U4301 PCIe Gen3 Analyzer User’s Guide...
- Page 190 Viewing Offline Performance Summary • Dot/Circle - • Box/Square - Keysight U4301 PCIe Gen3 Analyzer User’s Guide...
-
Page 191: Showing/Hiding The Chart Legend
Another way to view the chart legend as well as change the color of the graph lines in the NOTE chart is to right-click anywhere in the Charts area and select Show Color Picker Legend Window. Showing/Hiding the Band Chart Keysight U4301 PCIe Gen3 Analyzer User’s Guide... - Page 192 To hide the Band Chart Right-click anywhere in the chart location and then select Hide Band Chart. To show the Band Chart Right-click anywhere in the chart location and then select Show Band Chart. Keysight U4301 PCIe Gen3 Analyzer User’s Guide...
-
Page 193: Viewing The Center Of The Chart
When you release the left mouse button, the defined X-axis area is zoomed for all the displayed charts. Following screen displays the chart before and after zooming in Overlay view: Keysight U4301 PCIe Gen3 Analyzer User’s Guide... - Page 194 Similarly, you can zoom both X and Y axes of the defined area in the chart by selecting the Zoom Both Axes option from the combo box displayed in the Pan and Zoom section of the performance charts pane. Keysight U4301 PCIe Gen3 Analyzer User’s Guide...
-
Page 195: Moving A Performance Series Chart To Front
Charts pane. To do this, Right-click anywhere on a chart and select Move to Top. The context-menu displays a list of currently displayed charts. Select the particular chart that you want to move to the front. Keysight U4301 PCIe Gen3 Analyzer User’s Guide... - Page 196 The selected chart is then moved to the front of the displayed charts. You can select the None option from the Move to Top submenu to reset the chart’s display NOTE back to its previously defined display depth. Keysight U4301 PCIe Gen3 Analyzer User’s Guide...
-
Page 197: Exporting Performance Summary Charts Data To A .Csv Or An Excel File
Click the Chart Data button in the Export section of the Performance Overview tab. The Performance Overview Export dialog box is displayed. In the Data Range groupbox, specify the start and end points of the captured PCIe data for which you want to export performance summary. Keysight U4301 PCIe Gen3 Analyzer User’s Guide... - Page 198 For each performance parameter selected for export, the sample time and the number of samples that are exported are displayed as columns in the specified file. A sample of the exported performance summary charts data is displayed. Keysight U4301 PCIe Gen3 Analyzer User’s Guide...
- Page 199 Keysight U4301 PCIe Gen3 Analyzer User’s Guide Glossary Device Under Test. interposer Describes a probing method where the probe is located between a slot and the PCI Express device under test. midbus probe Describes a probing method where Soft Touch footprints are designed into a DUT board between the...
- Page 200 Glossary Keysight U4301 PCIe Gen3 Analyzer User’s Guide...
- Page 201 (for PCIe Gen3 decoded transactions, queues, 118, analyzer), device setup, Quick Tune, midbus probe, DUT (Device Under Test), MSI-X Interrupt transactions, MSI-X table index entries, Sampling Rate, End Extent, SATA commands, equalization coefficients, Keysight U4301 PCIe Gen3 Analyzer User’s Guide...
- Page 202 U4301 PCIe Gen3 Analyzer, U4301_Performance_Viewer, U4321A solid slot interposer, U4322A midbus 3.0 probe, U4324A PCIe Gen3 Flying Lead probe, visualize transaction, zoom both axis, zoom charts, 90, zoom out full, 91, zoom X-axis, 90, Keysight U4301 PCIe Gen3 Analyzer User’s Guide...
- Page 203 Keysight U4301 PCIe Gen3 Analyzer User’s Guide...
- Page 204 This information is subject to change without notice. © Keysight Technologies 2017 May 2017 *U4301-97001* www.keysight.com...
Need help?
Do you have a question about the U4301 and is the answer not in the manual?
Questions and answers