Table of Contents
Advertisement
Quick Links
Advertisement
Table of Contents

Related Manuals for PeakTech 1240


Summary of Contents for PeakTech 1240
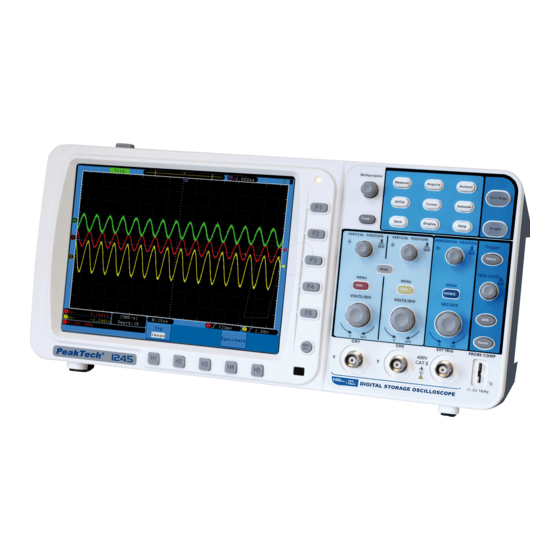
- Page 1 ® PeakTech 1240/1245/1255/ 1260/1270/1275 Operation manual Digital Oscilloscopes...
-
Page 2: Safety Precautions
1. Safety Precautions This product complies with the requirements of the following European Community Directives: 2004/108/EG (Electromagnetic Compatibility) and 2006/95/EG (Low Voltage) as amended by 2004/22/EG (CE-Marking). Overvoltage category II; pollution degree 2. To ensure safe operation of the equipment and eliminate the danger of serious injury due to short-circuits (arcing), the following safety precautions must be observed. -
Page 3: Safety Terms And Symbols
* Do not store the meter in a place of explosive, inflammable substances. * Do not modify the equipment in any way * Do not place the equipment face-down on any table or work bench to prevent damaging the controls at the front. -
Page 4: General Characteristics
3. General Characteristics PeakTech PeakTech PeakTech PeakTech PeakTech PeakTech Modell 1240 1245 1255 1260 1270 1275 Bandwidth 60 MHz 100 MHz 100 MHz 200 MHz 300 MHz 300 MHz Sample rate 500 MSa/s 1 GSa/s 2 GSa/s 2 GSa/s 2,5 GSa/s... - Page 5 Fig. 1 Power on/off Display area Power indication light Green light: Indicating Oscilloscope connects with AC Power, and the battery is in full (if there is battery inside Oscilloscope). Yellow light: Indicating Oscilloscope connect with AC Power and the battery is in charging (if there is battery inside Oscilloscope).
- Page 6 3.3. Left side panel Fig. 2 Left side panel Power switch:“―” represents power ON; “○” represents power OFF. AC power input jack 3.4. Right side panel Fig. 3 Right side panel 1. USB Host port: It is used to transfer data when external USB equipment connects to the oscilloscope regarded as “Host equipment”.
- Page 7 3.5. Rear Panel Fig. 4 Rear Panel The port of trigger signal output & Pass/Fail output Handle Air vents Foot stool (can adjust the tilt angle of the oscilloscope) Ground connection -96-...
- Page 8 3.6. Control (key and knob) area Fig. 5 Keys Overview Menu option setting: H1~H5 Menu option setting: F1~F5 Menu off : turn off the menu M knob(Multipurpose knob) Function key area: Total 12 keys Vertical control area with 3 keys and 4 knobs. “CH1 MENU”...
- Page 9 3.7. User interface introduction Fig. 6 Illustrative Drawing of Display Interfaces Waveform Viewing Area. The Trigger State indicates the following information: Auto: The oscilloscope is under the Automatic mode and is collecting the waveform under the non-trigger state. Trig: The oscilloscope has already detected a trigger signal and is collecting the after-triggering information.
-
Page 10: How To Implement The General Inspection
The frequency of the trigger signal of CH2. It indicates the current function menu. 18/19. It shows the selected trigger type: Rising edge triggering Falling edge triggering Video line synchronous triggering Video field synchronous triggering The reading shows the trigger level value of the corresponding channel. The reading shows the window time base value. - Page 11 Check the Accessories The supplied accessories have been already described in the Appendix B “Accessories” of this Manual. You can check whether there is any loss of accessories with reference to this description. If it is found that there is any accessory lost or damaged, please get in touch with the distributor of Lilliput responsible for this service or the Lilliput’s local offices.
-
Page 12: How To Implement The Probe Compensation
Fig. 7 Auto set Check CH2 by repeating Step 2 and Step 3. 5. How to Implement the Probe Compensation When connect the probe with any input channel for the first time, make this adjustment to match the probe with the input channel. -
Page 13: How To Set The Probe Attenuation Coefficient
Repeat the steps mentioned if necessary. Fig. 9 Adjust Probe 6. How to Set the Probe Attenuation Coefficient The probe has several attenuation coefficients, which will influence the vertical scale factor of the oscilloscope. To change or check the probe attenuation coefficient in the menu of oscilloscope: Press the function menu button of the used channels (CH1 MENU or CH2 MENU). -
Page 14: How To Implement Self-Calibration
7. How to Implement Self-calibration The self-calibration application can make the oscilloscope reach the optimum condition rapidly to obtain the most accurate measurement value. You can carry out this application program at any time, but when the range of variation of the ambient temperature is up to or over 5 ° C, this program must be executed. For the performing of the self-calibration, all probes or wires should be disconnected with the input connector first. -
Page 15: Introduction To The Horizontal System
Vertical offset back to 0 shortcut key Turn the VERTICAL POSITION knob to change the vertical display position of channel and press the position knob to set the vertical display position back to 0 as a shortcut key, this is especially helpful when the trace position is far out of the screen and want it to get back to the screen center immediately. -
Page 16: Introduction To The Trigger System
Use the “HORIZONTAL POSITION” knob to adjust the horizontal position of the signal in the waveform window. The “HORIZONTAL POSITION” knob is used to control the triggering displacement of the signal or for other special applications. If it is applied to triggering the displacement, it can be observed that the waveform moves horizontally with the knob when you rotate the “HORIZONTAL POSITION”... -
Page 17: How To Set The Vertical System
Press the “Force” button to force a trigger signal, which is mainly applied to the “Normal” and “Single” trigger modes. 11. How to Set the Vertical System The VERTICAL CONTROLS includes three menu buttons such as CH1 MENU, CH2 MENU and Math, and four knobs such as VERTICAL POSITION, VOLTS/DIV (one group for each of the two channels). - Page 18 The description of the Channel Menu is shown as the following list: Function Menu Setting Description Unblock the AC and DC components in the input signal. Coupling Block the DC component in the input signal. GROUND The Input signal is interrupted. The waveform is displayed normally.
- Page 19 11.3. Regulate the probe attenuation. In order to match the attenuation coefficient of the probe, it is required to adjust the attenuation ration coefficient of the probe through the operating menu of the Channel accordingly (see “6. How to set the Probe Attenation Coefficient”...
- Page 20 11.4. Setting of Waveform Inverted Waveform inverted: the displayed signal is turned 180 degrees against the phase of the earth potential. Taking the Channel 1 for example, the operation steps are shown as follows: Press the CH1 MENU button and get access to the CH1 SETUP menu. Press the H2 menu selection button and select ON for Inverted item.
-
Page 21: Implementation Of Mathematical Manipulation Function
11.5. Setting of Band Limit (only P 1245/1255/1260) When high frequency components of a waveform are not important to its analysis, the bandwidth limit control can be used to reject frequencies above 20 MHz. Taking the Channel 1 for example, the operation steps are shown as below: 1. -
Page 22: Setting Description
The corresponding FCL (Functional Capabilities List) of the Waveform Calculation: Function Menu Setting Description Factor1 Select the signal source of the factor1 Dual Wfm Math Sign + - * / Select the sign of mathematical manipulation Factor 2 Select the signal source of the factor2 Select CH1 as FFT source. -
Page 23: Using Fft Function
13. Using FFT function The FFT (fast Fourier transform) math function mathematically converts a time-domain waveform into its frequency components. It is very useful for analyzing the input signal on Oscilloscope. You can match these frequencies with known system frequencies, such as system clocks, oscillators, or power supplies. FFT in this oscilloscope can transform 2048 points of the time-domain signal into its frequency components and the final frequency contains 1024 points ranging from 0Hz to Nyquist frequency. - Page 24 This is a very good window for resolving frequencies that are very close to the same value with somewhat improved amplitude accuracy over the rectangle window. It has a slightly better frequency resolution than the Hamming Hanning. Use Hamming for measuring sine, periodic and narrow band random noise.
- Page 25 Fig. 22 Hamming window Fig. 23 Hanning window Fig. 24 Blackman window -114-...
-
Page 26: Application Of Vertical Position And Volts/Div Knobs
13.2. Notes for using FFT * If desired, use the zoom feature to magnify the FFT waveform. * Use the default dB scale to see a detailed view of multiple frequencies, even if they have very different amplitudes. Use the Vrms scale to see an overall view of how all frequencies compare to each other. * Signals that have a DC component or offset can cause incorrect FFT waveform component magnitude values. -
Page 27: How To Set The Horizontal System
Fig. 25 Information about Vertical Position 15. How to Set the Horizontal System The HORIZONTAL CONTROLS includes the HORIZ MENU button and such knobs as HORIZONTAL POSITION and SEC/DIV. HORIZONTAL POSITION knob: this knob is used to adjust the horizontal positions of all channels (include those obtained from the mathematical manipulation), the analytic resolution of which changes with the time base. -
Page 28: Main Time Base
16. Main Time Base Press the H1 menu selection button and choose Main. In this case, the HORIZONTAL POSITION and SEC/DIV knobs are used to adjust the main window. The display in the screen is shown as Fig. 27. Fig. 27 Main Time Base 17. -
Page 29: Window Expansion
18. Window Expansion Press the H3 menu selection button and choose Zoom. As a result, the window area defined by two cursors will be expanded to the full screen size (see Fig. 29). Fig. 29 Zoom Window 19. How to set the Trigger System Trigger determines when Oscilloscope starts to acquire data and waveform display. - Page 30 19.1. Trigger Control The oscilloscope provides two trigger types: single trigger and alternate trigger. Single trigger: Use a trigger level to capture stable waveforms in two channels simultaneously. Alternate trigger: Trigger on non-synchronized signals. The Single Trigger and Alternate Trigger menus are described respectively as follows: Single trigger Single trigger has four modes: edge trigger, video trigger, slope trigger and pulse trigger.
- Page 31 Edge menu list: MENU SETTINGS INSTRUCTION Single Mode Edge Set vertical channel trigger type as edge trigger. Select CH1 as trigger signal. Select CH2 as trigger signal. Source Select Ext-trigger as trigger signal EXT/5 Select attenuated Ext TRIG/5 as trigger signal. AC Line Select power line as trigger signal.
- Page 32 Line Synchronic trigger in video line Field Synchronic trigger in video field Sync Synchronic trigger in video odd filed Even Synchronic trigger in video even field Line NO. Synchronic trigger in designed video line, turn the M knob to set the line number Auto Acquire waveform even no trigger occurred Mode...
- Page 33 4. Pulse Width Trigger Pulse trigger occurs according to the width of pulse. The abnormal signals can be detected through setting up the pulse width condition. The Pulse Width Trigger Menu is shown as Fig. 33. Fig. 33 Pulse Width Trigger menu Pulse Width Trigger menu list MENU SETTING...
- Page 34 6. Alternate trigger (Trigger mode: Edge) Alternate trigger (Trigger Type: Edge) Menu is shown as Fig. 34. Fig. 34 Alternate trigger (Trigger Type: Edge) Menu Alternate trigger (Trigger Type: Edge) Menu list: MENU SETTING INSTRUCTION Alternate Mode Edge Set vertical channel trigger type as edge trigger. Select CH1 as the trigger source.
-
Page 35: Menu Setting
Alternate trigger (Trigger Type: video) Menu list: MENU SETTING INSTRUCTION Alternate Mode Video Set vertical channel trigger type as video trigger. Select CH1 as the trigger source. Source Select CH2 as the trigger source. NTSC Modu Select video modulation SECAM Line Synchronic trigger in video line. - Page 36 9. Alternate trigger (Trigger Mode: Pulse) Alternate trigger (Trigger Type: Pulse) Menu is shown as Fig. 37. Fig. 37 Alternate trigger (Trigger Type: Pulse) Menu Alternate trigger (Trigger Type: Pulse) menu list: MENU SETTING INSTRUCTION Alternate Pulse Set vertical channel trigger type as pulse trigger. Mode Select CH1 as the trigger source.
- Page 37 * AC Line: AC power can be used to display signals related to the power line frequency, such as lighting equipment and power supply devices. The oscilloscope gets triggered on its power cord, so you do not have to input an AC trigger signal. When AC Line is selected as trigger source, the oscilloscope automatically set coupling to DC, set trigger level to 0V.
-
Page 38: How To Implement Sampling Setup
20. How to Implement Sampling Setup Press the Acquire button and the menu is displayed in the screen, shown as Fig. 38. Fig. 38 ACQU MODE Menu The description of the Acqu Mode Menu is shown as follows: Function Menu Setting Description Sample... - Page 39 Fig. 39 Peak Detect mode, under which the burrs on the falling edge of the square wave, can be detected and the noise is heavy. Fig. 40 Common ACQU Mode display, in which no burr can be detected. Fig. 41 The displayed waveform after the noise is removed under the Average Mode, in which the average number of 16 is set.
-
Page 40: How To Set The Display System
21. How to Set the Display System Push down the Display button and the menu displayed in the screen is shown as Fig. 42. Fig. 42 Display Set Menu The description of the Display Set Menu is shown as follows: Function Menu Setting Description... - Page 41 Fig. 44 Display in Dots form 22. Persist When the Persist function is used, the persistence display effect of the picture tube oscilloscope can be simulated. The reserved original data is displayed in fade color and the new data is in bright color. Press the H2 button, the Persist menu will display at the right of screen.
- Page 42 23. XY Format This format is only applicable to Channel 1 and Channel 2. After the XY display format is selected, Channel 1 is displayed in the horizontal axis and Channel 2 in the vertical axis; the oscilloscope is set in the un-triggered sample mode: the data are displayed as bright spots.
-
Page 43: Vga Output
24. Cymometer It is a 6-digit cymometer. The cymometer can measure frequencies from 2Hz to the full bandwidth. Only if the measured channel has triggering signal and in Edge mode, it can measure frequency correctly. In the Single trigger mode, it is a one channel cymometer and it can only measure the frequency of the triggering channel. In the ALT trigger mode, it is a two channel cymometer and it can measure the frequency of two channels. -
Page 44: Setting Description
(see “Record Length Storage External Menu” on page 126). The file name is editable. ® The waveform file could be open by PeakTech waveform analysis software (on the supplied CD). When the type is Setting, the menu shows as following: Setting1 Setting ….. -
Page 45: Save And Recall The Waveform
27. Save and Recall the Waveform This oscilloscope can store 15 waveforms, which can be displayed with the current waveform at the same time. The stored waveform called out cannot be adjusted. In order to save the waveform of the CH1 into the address 1, the operation steps should be followed: Saving: Press the H1 button, the Type menu will display at the left of screen, turn the M knob to choose Wave for Type. - Page 46 After the USB disk is installed, press the Save panel button, the save menu is displayed at the bottom of the screen. Press the H1 button, the Type menu will display at the left of screen, turn the M knob to choose Image for Type.
-
Page 47: Setting Instruction
Record menu shows as follows: Menu Setting Instruction Close wave record function Record Set record menu Mode Playback Set playback menu Storage Set storage menu End frame Turn the M knob to select the number of frames to record (1 ~ 1000) Record mode FrameSet Turn the M knob to select the interval between recorded... - Page 48 Playback: Play back the wave recorded or saved. Playback menu shows as follows: Menu Setting Instruction Start frame Turn the M knob to select the number of start frame to playback (1 ~ 1000) End frame Turn the M knob to select the number of end frame to playback Playback Mode (1 ~ 1000) FrameSet...
- Page 49 Fig. 52 Wave Storage To use wave record function, do as follows: Press Save button. Press H1 button, turn the M knob to choose Record. Press H2 button. In the Mode menu, press F2 button to choose Record. Press H3 button. In the Frame Set menu, press F1 button and turn the M knob to set End frame; press F2 button and turn the M knob to select the interval between recorded frames.
- Page 50 The description of Configuration Menu is shown as the follows: Function Menu Setting Description Chinese language English Choose the display language of the operating system. Others Display On/Off the date display Hour Min Setting Hour/Minute Set Time Day Month Setting Date/Month Year Setting Year Lock all keys.
- Page 51 The description of Adjust Menu is shown as the follows: Function Menu Setting Description Self Cal Carry out the self-calibration procedure. Default Call out the factory settings. Do Self Cal (Self-Calibration) The self-calibration procedure can improve the accuracy of the oscilloscope under the ambient temperature to the greatest extent.
- Page 52 Function Menu Setting Description Enable Control enable switch operate Operate Control operate switch Pass Signal tested corresponds with the rule Fail Signal tested not correspond with the rule Output Beep Beep when it satisfies the rule Stop Stop once satisfying the rule Info Control the display status of info frame Select source CH1, CH2 or Math...
- Page 53 Fig. 58 Pass/Fail test Note: When Pass/Fail is ON, if XY or FFT is ready to run, then Pass/Fail will be closed; under the mode of XY or FFT, Pass/Fail is unable. Under the mode of Factory, Auto Scale and Auto Set, Pass/Fail will be closed. When no save setting left in the rule save, tip will be given to show “NO RULE SAVED”.
- Page 54 27.2.6. LAN Set Using the LAN port, the oscilloscope can be connected with a computer directly, or through the router to connect. The network parameters can be set in the menu below. Press the Utility button and turn the M knob to select the LAN Set to go to the following menu. Fig.
- Page 55 Fig. 61 ® Set the network parameters of the PeakTech Oscilloscope Software. Run the software on the computer, choose the “Ports-settings” of the “Communications” menu item. Set “Connect using” to LAN. About the IP, the first three bytes is same as the IP in the step (2), the last byte should be different.
- Page 56 Set the network parameters of the oscilloscope. In the oscilloscope, press the Utility button and press H1 button, turn the M knob to select the LAN Set; press the H2 button, the set menu is displayed on the right. Set the IP and the Port to the same value as the “Ports-settings”...
- Page 57 Fig. 64 ® Set the network parameters of the PeakTech Oscilloscope Software. Run the software on the computer; choose the “Ports-settings” of the “Communications” menu item. Set “Connect using” to LAN. About the IP, the first three bytes is same as the IP in the step (2), the last byte should be different.
- Page 58 Set the network parameters of the oscilloscope. In the oscilloscope, press the Utility button and press H1 button, turn the M knob to select the LAN Set; press the H2 button, the set menu is displayed on the right. Set the IP and the Port to the same value as the “Ports-settings”...
-
Page 59: How To Measure Automatically
28. How to Measure Automatically Press the Measure button to display the menu for the settings of the Automatic Measurements. The oscilloscopes provide 20 parameters for auto measurement, including Vpp, Vmax, Vmin, Vtop, Vbase, Vamp, Vavg, Vrms, Overshoot, Preshoot, Freq, Period, Rise Time, Fall Time, Delay A→B , Delay A→B ,+Width, -Width, +Duty, -Duty. - Page 60 29. Measure The measured values can be detected on each channel simultaneously. Only if the waveform channel is in the ON state, the measurement can be performed. The automatic measurement cannot be performed in the following situation: 1) On the saved waveform. 2) On the mathematical waveform. 3) On the XY format. 4) On the Scan format.
-
Page 61: The Automatic Measurement Of Voltage Parameters
30. The automatic measurement of voltage parameters The oscilloscopes provide automatic voltage measurements including Vpp, Vmax, Vmin, Vavg, Vamp, Vrms, Vtop, Vbase, Overshoot and Preshoot. Fig. 69 below shows a pulse with some of the voltage measurement points. Fig. 69 Vpp: Peak-to-Peak Voltage. -
Page 62: How To Measure With Cursors
30.1. The automatic measurement of time parameters The oscilloscopes provide time parameters auto-measurements include Frequency, Period, Rise Time, Fall Time, +Width, -Width, Delay 1→2 , Delay 1→2 , +Duty and -Duty. Fig. 70 shows a pulse with some of the time measurement points. Fig. - Page 63 The description of the cursor measurement menu is shown as the following table: Function Menu Setting Description Switch off the cursor measurement. Type Voltage Display the voltage measurement cursor and menu. Time Display the time measurement cursor and menu. Display the channel generating the waveform to which the cursor Source measurement will be applied.
- Page 64 Carry out the following operation steps for the time cursor measurement of the channel CH1: Press Cursor and recall the Cursor Measure menu. Press the H2 button and choose CH1 for Source. Press the H1 button, the Type menu will display at the right of the screen. Press the F3 button to select Time for Type, with two purple dotted lines displayed along the vertical direction of the screen, which indicating Cursor 1 and Cursor 2.
- Page 65 32. The Cursor Measurement for FFT model Press the Cursor button to display the cursor measurement function menu (CURS MEAS) in the screen, which includes Vamp Measurement and Freq Measurement at the mode of FFT, shown as Fig. 74. Fig. 74 CURS MEAS Menu The description of the cursor measurement menu is shown as the following table: Function Menu Setting...
- Page 66 Fig. 75 wave of Vamp cursor measurement Carry out the following operation steps for the Freq cursor measurement: Press Cursor and recall the Cursor Measure menu. Press the H1 button, the Type menu will display at the right of the screen. Press the F3 button to select Freq for Type, with two purple dotted lines displayed along the vertical direction of the screen indicating the corresponding Cursor 1 and Cursor 2.
-
Page 67: How To Use Autoscale
33. How to use Autoscale The function is applied to follow-up signals automatically even if the signals change at any time. Autoscale enables the instrument to set up trigger mode, voltage division and time scale automatically according to the type, amplitude and frequency of the signals. Fig. - Page 68 Then the wave is displayed in the screen, shown as Fig. 78. Fig. 78 Autoscale Horizontal- Vertical multi-period waveforms Note: 1. Entering into Autoscale function and the A flicker will be at the top left of the screen. (flicker every 0.5 second) 2.
-
Page 69: How To Use Executive Buttons
34. How to Use Executive Buttons Executive Buttons include Autoset, Run/Stop, Single, Copy. 34.1. Autoset This button is used for the automatic setting of all control values of the instrument to generate the waveform suitable for observation. Press the Autoset button and the oscilloscope will perform the fast automatic measurement of the signal. - Page 70 34.4. Copy This button is the shortcut of saving function of the Save function menu. Pressing this button is equal to the Save option in the Save function menu. The current waveform or the display creen could be saved according to the setting of the Save function menu.
- Page 71 Fig. 79 Waveform of Automation Measurement 35.2. Example 2 Gain of the Amplifier in the Metering Circuit Set the probe menu attenuation coefficient as 10X and that of the switch in the probe as 10X (see “6. How to the Probe Attenuation Coefficient” on page 101). Connect the oscilloscope CH1 channel with the circuit signal input end and the CH2 channel to the output end.
- Page 72 Fig. 80 Waveform of Gain Measurement 35.3. Example 3: Capture the Single Signal The digital storage oscilloscope takes the lead in providing the convenience capturing of such non-periodic signals as pulse and burr, etc. If you intent to capture a single signal, you can not set the trigger level and the trigger edge unless you have particular priori knowledge of this signal.
- Page 73 15. If the Trigger State Indicator at the top of the screen does not indicate Ready, push down the Run/Stop button and start acquiring, waiting the emergence of the signal in conformity with the trigger conditions. If a signal reaches to the set trigger level, one sampling will be made and then displayed in the screen. With this function, any random occurrence can be captured easily.
- Page 74 Fig. 82 Waveform of the Signal Containing Noises Separate Noises from the Signal When analyze the waveform of a signal, you should remove the noise in it. For the reduction of the random noise in the oscilloscope display, please operate the instrument according to the following steps: Press the Acquire button to display the Acquire menu.
- Page 75 35.5. Example 5: Application of X-Y Function Examine the Phase Difference between Signals of two Channels Example: Test the phase change of the signal after it passes through a circuit network. Connect the oscilloscope with the circuit and monitor the input and output signals of the circuit. For the examination of the input and output of the circuit in the form of X-Y coordinate graph, please operate according to the following steps: Set the probe menu attenuation coefficient for 10X and that of the switch in the probe for 10X (see “6.
- Page 76 35.6. Example 6: Video Signal Trigger Observe the video circuit of a television, apply the video trigger and obtain the stable video output signal display. Video Field Trigger For the trigger in the video field, carry out operations according to the following steps: 1.
-
Page 77: Troubleshooting
36. Troubleshooting Oscilloscope is powered on but no Display. * Check whether the power connection is connected properly. * Check whether the power switch is pushed down to the designated position. * Check whether the fuse which is beside the AC power input jack is blew (the cover can be pried open with a straight screwdriver). -
Page 78: Technical Specifications
1MΩ±2%, in parallel with 10pF±5pF Probe attenuation factor 1X, 10X, 100X, 1000X Max. input voltage 400V (PK-PK) (DC + AC PK-PK) Bandwidth limit Input 20MHz, full bandwidth (except P 1240) 50Hz: 100 : 1 Channel–channel isolation 10MHz: 40 : 1 Time delay between 150ps... -
Page 79: Horizontal System
Dual CH 0.5 Sa/s ~ 250 MSa/s P 1240 Single CH 0.5 Sa/s ~ 500 MSa/s Dual CH 0.5 Sa/s ~ 500 MSa/s P 1245 Single CH 0.5 Sa/s ~ 1 GSa/s Dual CH 0.5 Sa/s ~ 1 GSa/s P 1255 Single CH 0.5 Sa/s ~ 2 GSa/s... - Page 80 5 ns/div ~ 100 s/div, P 1240 step by 1 ~ 2 ~ 5 2 ns/div ~ 100 s/div, P 1245 step by 1 ~ 2 ~ 5 1 ns/div ~ 100 s/div, P 1255 Scanning speed step by 1 ~ 2 ~ 5...
-
Page 81: Communication Port
Cursor V and T between cursors Vpp, Vmax, Vmin, Vtop, Vbase, Vamp, Vavg, Vrms, Overshoot, Preshoot, Freq, Period, Rise Time, Fall Automatic Time, Delay A→B , DelayA→B , +Width, -Width, +Duty, -Duty Measurement Waveform Math +, -, *, / ,FFT Waveform storage 15 waveforms Bandwidth... -
Page 82: Appendix A: Enclosure
37.2. General Technical Specifications 37.2.1. Display Display Type 8” Colored LCD (Liquid Crystal Display) Display Resolution 800 (Horizontal) × 600 (Vertical) Pixels Display Colors 65536 colors, TFT screen 37.2.2. Output of the Probe Compensator Output Voltage (Typical ) About 5 V, with the Peak-to-Peak voltage equal to or greater than 1 MΩ... -
Page 83: Appendix B: Maintenance, Cleaning And Repairing
38.2. Appendix B: Maintenance, Cleaning and Repairing General Maintenance Please don't store or put the instrument in the place where the liquid crystal display will be directly exposed to the sunlight for a long time. Caution: The instrument or probe should not be stained with the spraying agent, liquid and solvent to avoid any damage to it. - Page 84 38.4. Charging the oscilloscope Connect the power cord to a power source. Turn on the Power Switch Button ― ○ on the left side (make sure the “―” side is pressed down). Yellow light of the indicator on the front panel means the battery is being charged.
- Page 85 All rights, also for translation, reprinting and copy of this manual or parts are reserved. Reproduction of all kinds (photocopy, microfilm or other) only by written permission of the publisher. This manual considers the latest technical knowing. Technical changings which are in the interest of progress reserved.
Need help?
Do you have a question about the 1240 and is the answer not in the manual?
Questions and answers