Sign In
Upload
Download
Table of Contents
Contents
Add to my manuals
Delete from my manuals
Share
URL of this page:
HTML Link:
Bookmark this page
Add
Manual will be automatically added to "My Manuals"
Print this page
×
Bookmark added
×
Added to my manuals
Manuals
Brands
PeakTech Manuals
Test Equipment
1335
Manual
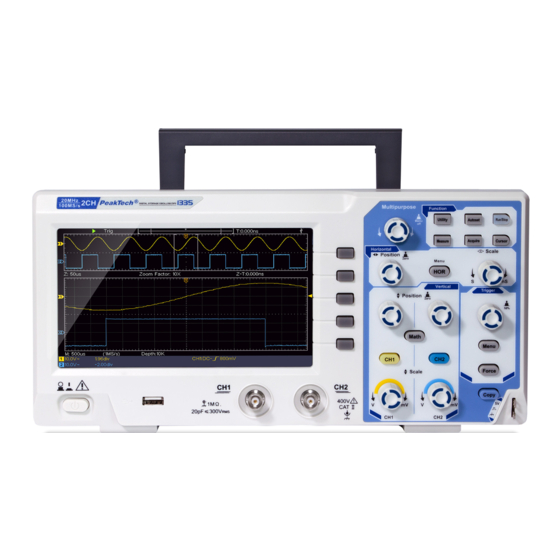
PeakTech 1335 Manual
Digital storage oscilloscopes
Hide thumbs
1
Table Of Contents
2
3
4
5
6
7
8
9
10
11
12
13
14
15
16
17
18
19
20
21
22
23
24
25
26
27
28
29
30
31
32
33
34
35
36
37
38
39
40
41
42
43
44
45
46
47
48
49
50
51
52
53
54
55
56
57
58
59
60
61
page
of
61
Go
/
61
Contents
Table of Contents
Troubleshooting
Bookmarks
Table of Contents
Table of Contents
General Safety Requirements
Safety Terms and Symbols
Quick Start
Introduction to the Structure of the Oscilloscope
Front Panel
Rear Panel
Control Area
User Interface Introduction
How to Implement the General Inspection
How to Implement the Function Inspection
How to Implement the Probe Compensation
How to Set the Probe Attenuation Coefficient
How to Use the Probe Safely
How to Implement Self-Calibration
Introduction to the Vertical System
Introduction to the Horizontal System
Introduction to the Trigger System
Advanced User Guidebook
How to Set the Vertical System
Use Mathematical Manipulation Function
The Waveform Calculation
Using FFT Function
Use Vertical Position and Scale Knobs
How to Set the Horizontal System
Zoom the Waveform
How to Set the Trigger System
Single Trigger
Alternate Trigger (Trigger Mode: Edge)
How to Operate the Function Menu
How to Set the Sampling/Display
How to Save and Recall a Waveform
How to Implement the Auxiliary System Function Setting
How to Update Your Instrument Firmware
How to Measure Automatically
How to Measure with Cursors
How to Use Executive Buttons
Communication with PC
Demonstration
Example 1: Measurement a Simple Signal
Example 2: Gain of a Amplifier in a Metering Circuit
Example 3: Capturing a Single Signal
Example 4: Analyze the Details of a Signal
Example 5: Application of X-Y Function
Example 6: Video Signal Trigger
Troubleshooting
Technical Specifications
General Technical Specifications
Appendix
Appendix A: Enclosure
Appendix B: General Care and Cleaning
Advertisement
Quick Links
Download this manual
PeakTech
1335 / 1336 / 1337
®
Digital Storage Oscilloscopes
Table of
Contents
Previous
Page
Next
Page
1
2
3
4
5
Advertisement
Table of Contents
Need help?
Do you have a question about the 1335 and is the answer not in the manual?
Ask a question
Questions and answers
Related Manuals for PeakTech 1335
Test Equipment PeakTech 1280 Operation Manual
(113 pages)
Test Equipment PeakTech 1350 Operation Manual
Pc pen type oscilloscopes with usb (92 pages)
Test Equipment PeakTech 1336 Manual
Digital storage oscilloscopes (61 pages)
Test Equipment PeakTech 1337 Manual
Digital storage oscilloscopes (61 pages)
Test Equipment PeakTech 1326 User Manual
Pc oscilloscope (56 pages)
Test Equipment PeakTech 1331 User Manual
Pc oscilloscope (56 pages)
Test Equipment PeakTech 1205 Operation Manual
Digital storage oscilloscopes/dmm (122 pages)
Test Equipment PeakTech 1240 Operation Manual
(85 pages)
Test Equipment PeakTech 1245 Operation Manual
Digital oscilloscopes (178 pages)
Test Equipment PeakTech 1190 Operation Manual
Digital oscilloscope / with 16-ch logic analyzer (118 pages)
Test Equipment PeakTech 1220 Operation Manual
20 mhz digital storage oscilloscope/dmm (109 pages)
Test Equipment PeakTech 1220 Operation Manual
20 mhz digital storage oscilloscope/dmm (127 pages)
Test Equipment PeakTech 1206 User Manual
2 ch & 4 ch tablet oscilloscopes (96 pages)
Test Equipment PeakTech 1200 Operation Manual
25 mhz storage oscilloscope with colour display (73 pages)
Test Equipment PeakTech 1286 User Manual
Pc oscilloscope (56 pages)
Test Equipment PeakTech 1094 Operation Manual
Ac/dc voltage tester (23 pages)
This manual is also suitable for:
1336
1337
P1337
P1336
P1335
Table of Contents
Print
Rename the bookmark
Delete bookmark?
Delete from my manuals?
Login
Sign In
OR
Sign in with Facebook
Sign in with Google
Upload manual
Upload from disk
Upload from URL


Need help?
Do you have a question about the 1335 and is the answer not in the manual?
Questions and answers