Table of Contents
Advertisement
Quick Links
Advertisement
Table of Contents

Subscribe to Our Youtube Channel
Related Manuals for PeakTech 1206


Summary of Contents for PeakTech 1206
- Page 1 1206 - 1212 ® PeakTech User Manual 2 CH & 4 CH Tablet Oscilloscopes...
-
Page 2: Table Of Contents
Table of content 1. Safety precautions…......................3 2. Safety symbols and terms………..................5 3. Quick start guide........................7 3.1 Front………….……………………………………………………………………………………. 8 3.2 Side view………………………………………………………………………………………..… 10 3.3 Upper side……..………………………………………………………………………………….. 11 4. Introduction to the user interface ……………………………………………………....12 5. Check before commissioning………………….………………………………………………... 13 5.1 Functional test…........................ - Page 3 8.2 Save and recall a waveform…................... 47 8.2.1 Save and recall the waveform……………………………….……………………………….. 48 8.2.2 Save the current screen image…..................49 8.2.3 Requirements of the USB storage device…………………………………………………… 49 8.2.4 Use system provided function to format the USB device…..........49 8.2.5 Record and playback waveforms….................
-
Page 4: Safety Precautions
1. Safety precautions This product complies with the requirements of the following directives of the European Union for CE conformity: 2014/30/EU (electromagnetic compatibility), 2014/35/EU (low voltage), Overvoltage category II; Pollution degree 2. To ensure the operational safety of the device and to avoid serious injuries from current or voltage flashovers or short circuits, the following safety instructions for operating the device must be observed. - Page 5 Warning! If the oscilloscope is connected to an input signal of more than 42V peak (30Veff) or to circuits with more than 4800VA, please observe the instructions below to avoid fire or electric shock: - Use only insulated probes and test leads. - Check all accessories before use and replace them if damaged.
-
Page 6: Safety Symbols And Terms
2. Safety symbols and terms You can find the following symbols in these operating instructions or on the measuring device. Warning! „Warning” indicates conditions and operating steps that pose a risk to the operator. Attention! „Attention” indicates conditions and operating steps that can cause damage to the product or other objects. - Page 7 Internal ground (GND) wiring diagram when the oscilloscope is connected to a PC: Oscilloscope Probe Electrical Outlet (Battery-power) Signal Input USB/LAN Cable Ground Clip Warning: To avoid fire or electric shock, please observe the following points when the connected oscilloscope input signal is greater than 42 Vpp (30 Vrms) or circuits greater than 4800 VA: 1.
-
Page 8: Quick Start Guide
3. Quick start guide This chapter covers the following topics: Structure of the oscilloscope Introduction to the user interface Check before commissioning Functional test Probe compensation Probe attenuation Safety by using the probe ... -
Page 9: Front
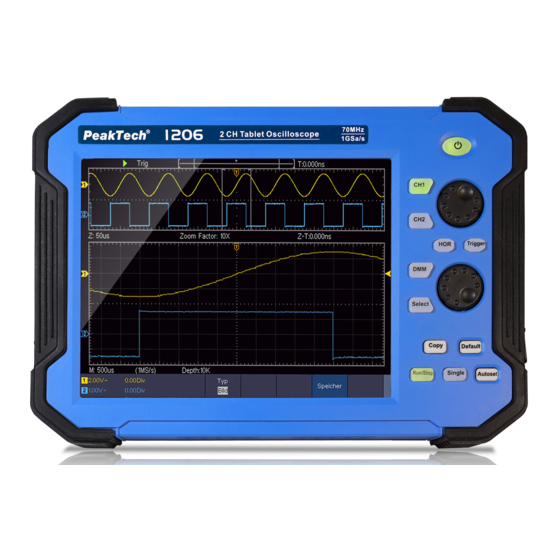
3.1 Front Function keys and rotary switches are built into the front of the oscilloscope, which can be used to navigate through the menu or to select function applications. Furthermore, the tablet oscilloscope has a touchscreen, which means that the respective functions can also be selected. 12 11 Figure 1.0 Front view (4 channel oscilloscope) - 8 -... - Page 10 12 11 Figure 1.1 Front view (2 channel oscilloscope) 1. LCD Touchscreen 2. 4CH Oscilloscope: CH buttons CH 1 – CH 4 / 2CH Osciloscope: buttons CH 1 + CH 2 3. Main switch for switching the device on and off 4.
-
Page 11: Side View
3.2 Side view Figure 1.2 Side view 1. Probe compensation: output of the 5V / 1kHz measuring signal 2. Output connection for the trigger and the pass / fail function (output type can be changed in the menu Tool Function output output) 3. -
Page 12: Upper Side
3.3 Upper side Input connectors of channels Input connectors of multimeter Figure 1.3 Upper side of the 2 channel oscilloscope (PeakTech 1206, 1207) Input connectors of four channels Figure 1.4 Upper side of the 4 channel oscilloscope (PeakTech 1211, 1212) -
Page 13: Introduction To The User Interface
4. Introduction to the user interface Figure 2.0 User interface 1. Display range of the measured values 2. Start / stop the measurement (measurement activated / deactivated) 3. Display of the selected mode 4. Automatic setting for displaying the measured value 5. -
Page 14: Check Before Commissioning
19. Display of the frequency of the triggered signal 20. Display of the current trigger type 21. Selection to display the submenu items 22. Display of the measured type of the corresponding channel 23. Display of the recording length of the measured values 24. -
Page 15: Functional Test
1. Switch on the device with the main switch " " by pressing and holding the button. The device performs a self-test and displays the PeakTech logo. If desired, press the “Default” button to reset the oscilloscope to the factory settings. The default value for the probe attenuation in the menu is 10X. -
Page 16: Probe Compensation
5.2 Probe compensation The first time you connect the probe to an input channel, you must match the probe to the input channel. A probe that is not or incorrectly compensated results in measurement errors. Perform the probe compensation as follows: 1. - Page 17 This setting remains in effect until it is changed again. Note: The attenuation factor of the probe is in the menu presetted to 10x. Make sure that the value set on the probe's attenuation switch corresponds to the attenuation value set on the oscilloscope. The values that can be set with the switch on the probe are 1X and 10X (see picture).
-
Page 18: Self - Calibration
5.4 Self - calibration With the auto-calibration, the oscilloscope can be quickly put in the optimal state for high-precision measurements. You can run this program at any time, but you must do it if the ambient temperature varies by more than 5 ° C. Remove all probes and cables from the input jacks before symbol, press the “Utility”... -
Page 19: Introduction To The Horizontal System
1. Press the control panel button CH1 or CH2 to select the desired channel 2. When one of the channel buttons is lit, you can use the upper knob to display the selected channel waveform in the center of the waveform window. The top knob controls the vertical display position of the selected channel waveform. -
Page 20: Introduction To The Trigger System
1. With the HOR button lit, press the HOR button to toggle between normal mode and wave zoom mode. 2. With the HOR button lit, rotate the lower knob to change the horizontal timebase setting and observe the resulting change in status information. Rotate the lower knob to change the horizontal time base. -
Page 21: Introduction To The Touchscreen Operation
1. Press the symbol and open the trigger menu. In this submenu it is possible to adjust the signal by setting the trigger for the display. 2. To set the trigger, press the trigger button that it lights up. You are now able to adjust the trigger level of the previously selected channel using the upper rotary knob for the required display. -
Page 22: Calling Up The Main Menu
5.8.3 Calling up the main menu To call up the main menu, press the symbol in the lower right corner of the screen ( ). The menu is shown in Figure 3.7. Figure 3.7 Main menu 5.8.4 Selection of the active channel The available channels are displayed in the lower left corner. -
Page 23: Adjustment Of The Horizontal And Vertical
5.8.5 Adjustment of the horizontal and vertical By simply pressing the touchscreen on the left-hand side, the arrow keys appear for setting the horizontal and vertical of the selected channel. By pressing the free area of the touchscreen again, the arrows are hidden. In order to be able to make fine adjustments, press directly on the P in the arrow. -
Page 24: Setting The Time Base And Voltage Division
5.8.7 Setting the time base and voltage division To set the time base and the voltage division using the touchscreen, press in the middle of the touchscreen and arrows appear for setting the values. The time base or the voltage division is set by simply pressing the arrows (see Figure 3.12). -
Page 25: User Instructions (For Advanced Users)
6. User Instructions (for advanced users) In the previous paragraphs, the user has already been familiarized with the basic functions of the functional areas, buttons and knobs of the oscilloscope. Based on the introduction of the previous chapters, the user should already have gained initial knowledge about changing the oscilloscope settings, selecting and evaluating the status bars and general operation. -
Page 26: Set The Vertical System
6.1 Set the vertical system The VERTICAL functions include 2 menu buttons such as CH1 ~ CH2 (2CH models) and CH1 ~ CH 4 (4 CH Models) as well as 2 rotary controls for vertical and horizontal setting, to be set for each measuring channel. -
Page 27: Setting The Channel Coupling
6.1.1 Setting the channnel coupling As an example, let's take a square wave signal on channel 1 that contains a DC bias. Proceed as follows: 1. Press the CH 1 button to access the CH 1 menu 2. Press pairing in the channel menu 3. -
Page 28: Setting The Bandwidth Limit
6.1.5 Setting the bandwidth limit When the high frequency components of a waveform are not important for your analysis, bandwidth limiting can be used to suppress frequencies above 20 MHz. Proceed as follows: Press the CH 1 button to enter the menu Select the limit value function Now select the 20M function to only display frequencies up to 20 MHz Select the Full Band function to measure all frequencies up to the maximum bandwidth... -
Page 29: Operation Oft He Function Menu
6.4 Operation of the function menu The operating area of the function menu comprises 13 function menu keys: Trig Menu, Acquire, Utility, Autoscale, Save, Measure, Cursor, Math, Decode, HOR, FFT, XY, P / F, DMM as well as 5 immediate selection keys: Autoset, Run / Stop, Single, Copy, default. 6.5 Set the trigger system The trigger determines when the oscilloscope begins acquiring data and displaying the waveform. -
Page 30: Edge Trigger
Window trigger: Gives a high trigger level and a low trigger level. The oscilloscope triggers when the input signal passes through the high or low trigger level. Timeout trigger: The oscilloscope triggers when the time interval from the time of the rising edge (or falling edge) due to the trigger level if the neighboring falling edge (or the rising edge) due to the trigger level is greater than the set timeout time. -
Page 31: Video Trigger
Trigger level: The trigger level indicates vertical trig position of the channel, turn the trig level knob or slide on the touch screen upward and downward to move trigger level, during setting, an orange red dotted line displays to show trig position, and the value of trigger level changes at the right corner, after setting, dotted line disappears. -
Page 32: Pulse Width Trigger
6.5.4 Pulse width trigger Pulse trigger occurs according to the width of pulse. The abnormal signals can be detected through setting up the pulse width condition. In Pulse Width Trigger mode, the trigger setting information is displayed on bottom right of the screen, for example indicates that trigger type is pulse width, trigger source is CH1, coupling is DC, polarity is positive, and trigger level is 0.00mV. - Page 33 Slope trigger menu list: Menu Setting Description Set vertical channel trigger type as slope Single Slope trigger. Select CH1 as the trigger source Select CH2 as the trigger source Source Select CH3 as the trigger source Select CH4 as the trigger source slope Slope selecting When...
-
Page 34: Runt Trigger
6.5.6 Runt trigger The runt trigger records pulses that run through one trigger level, but not through another, as shown in the graphic. In runt trigger mode, the setting information is shown at the bottom right of the screen, e.g: indicates that the runt trigger on CH1 with positive polarity has been selected and the difference between the up-level and low-level threshold value is 0.00mV. -
Page 35: Window Trigger
6.5.7 Window trigger Provide a high trigger level and low trigger level, the oscilloscope triggers when the input signal passes through the high trigger level or the low trigger level. In Windows Trigger mode, the trigger setting information is displayed on bottom right of the screen, for example, , indicates that trigger type is windows, trigger source is CH1, polarity is positive, 0.00mV the differential between up level and low level threshold. -
Page 36: Timeout Trigger
6.5.8 Timeout trigger The oscilloscope triggers when the time interval from when the rising edge (or the falling edge) passes through the trigger level to when the neighbouring falling edge (or the rising edge) passes through the trigger level is greater than the timeout time set. In Timeout Trigger mode, the trigger setting information is displayed on bottom right of the screen, for example, , indicates that trigger type is Timeout, trigger source is CH1, edge... -
Page 37: Nth Edge Trigger
6.5.9 Nth edge trigger The oscilloscope triggers on the Nth edge that appears on the specified idle time. As figure shown below, the oscilloscope should trigger on the second falling edge after the specified idle time and the idle time should be set to P1/P2/P3/P4 < Idle Time < M. Wherein, M, P1, P2, P3 and P4 are positive or negative pulse width participating in the counting. -
Page 38: Logic Trigger
6.5.10 Logic trigger Trigger according to logic relation. In Logic Trigger mode, the trigger setting information is displayed on bottom right of the screen, for example, , indicates that trigger type is Logic, logic mode is AND, CH1 high level and trigger level is 0.00mV. Logic trigger menu: Menu Settings... -
Page 39: Bus Trigger
6.5.11 Bus trigger 1. SPI Trigger on the specified data when the timeout condition is meet. When using SPI trigger, you need to specify the SCL and SDA data sources. In SPI bus trigger mode, the trigger setting information is displayed on bottom right of the screen, for example, indicates that trigger type is SPI, CH1 trigger level is 0.00mV. - Page 40 2. I2C trigger The I2C serial bus consists of SCL and SDA. The transmission rate is determined by SCL, and the transmission data is determined by SDA. As shown in below figure, oscilloscope can trigger on the start, restart, stop, ack lost, specific device address or data value, also device address and data value at the same time.
- Page 41 3. RS232 trigger RS232 is a serial communication mode used in the data transmission between PCs or between PC and Terminal. A character is transmitted as a frame of data which consist of 1bit start bit, 5- 8bits data bits, 1bit check bit and 1-2 stop bits. In RS232 bus trigger mode, the trigger setting information is displayed on bottom right of the screen, for example, , indicates that trigger type is UART, CH1 trigger level is 0.00mV.
-
Page 42: Sampling Setup
Data Bits: Set as 5, 6, 7, 8 bits. Data:Set data according to data bits, ranges from 0- 31, 0-63, 0-127 or 0-255. Data Common Baud: click in the left menu to choose common baud. Custom Baud: click to choose baud, ranges from 50 to 10,000,000. - Page 43 Interpolation method is a processing method to connect the sampled points, using some points to calculate the whole appearance of the waveform. Select the appropriate interpolation method according to the actual signal. Sine(x)/x interpolation: Connect the sampled points with curved lines. Linear interpolation: Connect the sampled points with straight lines.
-
Page 44: Implementation Of The Function Setting For The Auxiliary System
8. Implementation of the function setting for the auxiliary system Configuration Click to call up the menu panel. Click the Utility softkey on panel, select Function in the bottom menu, select Configure in the left menu. The description of Configure Menu is shown as the follows: Menu Settings Description... - Page 45 Adjust Click to call up the menu panel. Click the Utility softkey on panel, select Function in the bottom menu, select Adjust in the left menu. Function menu Description Self Cal Carry out the self-calibration procedure. Default Call out the factory settings. ProbeCh.
-
Page 46: Set The Display System
LAN Set To use the LAN network connection with the computer, please read the corresponding article "Connection with the PC". Update Use the side panel USB port to update your instrument firmware using a USB memory device. Refer to "Fehler! Verweisquelle konnte nicht gefunden werden." 8.1 Set the Display system Click to call up the menu panel. -
Page 47: Color
8.1.2 Color Color temperature function uses color-grading to indicate frequency of occurrence. The hot colors like red/yellow indicate frequently occurring events, and the colder colors like blue/green indicate rarely occurring events. (1) Click to call up the menu panel. Click the Display softkey on panel. -
Page 48: Save And Recall A Waveform
8.2 Save and recall a waveform Click to call up the menu panel. Click the Save softkey on panel, you can save the waveforms, configures, screen images, record or clone the waveform. Function Menu Settings Description Wave Choose the saving type. About the Record type, see "Fehler! Configure Verweisquelle konnte nicht gefunden werden."... -
Page 49: Save And Recall The Waveform
Save the waveform of the source to the selected address. Whatever the Type of save menu is set, you can save the waveform by just pressing the Save Copy panel button in any user interface. Select Type in the bottom menu, in the right Format menu, you can select the storage format. -
Page 50: Save The Current Screen Image
6. Select Object & Show in the bottom menu, select Wave1 as object address in the left menu. 7. Select Save in the bottom menu to save the waveform. 8. Recalling: Select Object & Show in the bottom menu, select Wave1 in the left menu. In the right menu, select Show as ON, the waveform stored in the address will be shown, the address number and relevant information will be displayed at the top left of the screen. - Page 51 Figure 4.6 Disc manager 1. Right click on the area marked in red and select Format and a warning message appears, which you confirm with YES. Figure 4.7 Warning message USB 2. Set the file format as FAT32 with a cluster size of 4096. Select quick formatting "Perform a quick format"...
-
Page 52: Record And Playback Waveforms
3. Formatting process Figure 4.9 Formatting the USB device 4. Check whether the formatting has been carried out and FAT32 with a cluster size of 4096 is now displayed. 8.2.5 Record and playback waveforms Click to call up the menu panel. Click the Save softkey on panel. Select Type in the bottom menu, select Record in the left menu. - Page 53 Note: Both of the waveforms of Channel 1 and Channel 2 will be recorded. If a Channel is turned off while recording, the waveform of the channel is invalid in the playback mode. Playback: Play back the wave recorded or saved. Playback menu shows as follows: Menu Settings...
- Page 54 When storage medium is External, Wave Record contains two modes: OFF, Record Record menu (External Storage) shows as follows: Menu Settings Instruction Close wave record function Mode Record Set record menu Click to select the number of frames to End frame record (1 –...
-
Page 55: Clone And Recall A Waveform
Bild 4.10 Wiedergabe der Wellenform mittels der Software 8.2.6 Clone and recall a waveform Click to call up the menu panel. Click the Save softkey on panel. Select Type in the bottom menu, select Clone in the left menu. You can clone one or two channel waveforms between two cursors, and save it as a cloned waveform into a USB memory device. - Page 56 Click line a to select it, swipe left/right to move it. Click line b to select it, swipe left/right to move it. Two cursors are linked. Click line a or b to select them, swipe left/right to move the pair of cursors. Set the cursors to select the entire screen automatically.
-
Page 57: Data Format Description Of Ota Waveform File
8.2.7 Data format description of OTA waveform file If the source mode is set to Out1 or Out2, OTA file consists of two parts: the file header and the channel data. If the source mode is set to Out1&Out2, OTA file consists of three parts: file header, the first channel data, and the second channel data. -
Page 58: Measurement Functions
9) VOL2 Parameter name Meaning Value Comment VOL2 Voltage division, 4 bytes float The value indicates divided by 400 is the voltage (the unit ADC resolution is mV), such as 200 (When the source mode is Out 1 & Out 2, it ist he second channel voltage division) -
Page 59: Measure
(left menu) The selected type and source are shown in the Remove menu on the right. Remove Remove the selected measure type Remove Remove all the measures Show all the measures of the snapshot source Snapshot Turn off the snapshot Source Select the snapshot source 9.1.1 Measure... -
Page 60: Automatic Measurement Of The Voltage Parameters
Fig. 4.11 Automatic measurement 9.1.2 Automatic measurement of the voltage parameters The oscilloscopes provide automatic voltage measurements including Mean, PK-PK, RMS, Max, Min, Vtop, Vbase, Vamp, OverShoot, PreShoot, Cycle RMS, and Cursor RMS. Figure 4.12 shows a pulse with some of the voltage measurement points. Fig. -
Page 61: Automatic Measurement Of The Time Parameters
Vtop: Voltage of the waveform's flat top, useful for square/pulse waveforms. Vbase: Voltage of the waveform's flat base, useful for square/pulse waveforms. Vamp: Voltage between Vtop and Vbase of a waveform. Overshoot: Defined as (Vmax-Vtop)/Vamp, useful for square and pulse waveforms. Preshoot: Defined as (Vmin-Vbase)/Vamp, useful for square and pulse waveforms. -
Page 62: Other Measurement Functions
Note for the following delay measurements: Source A and Source B can be set in the automatic measurement function menu. FRR: Time between Source A first rising edge and Source B first rising edge. FRF: Time between Source A first rising edge and Source B first falling edge. FFR: Time between Source A first falling edge and Source B first rising edge. -
Page 63: Measure With The Cursor
Select the gating menu. There are two menus: Screen and Cursor under the area. Click Screen, then click the cursor or press the right on-screen menu key twice to set the cursor area. Statistics Choose Statistics. You can select On or Off to enable or disable statistics on the reading. Reset statistics: Restart the statistics. - Page 64 6. Push the Horizontal HOR button to enter wave zoom mode. In the bottom cursor menu, select Window as Main or Extension to make the cursors shown in the main window or zoom window. Fig. 4.14 Time & Voltage cursor measurement Auto Cursor For the AutoCursor type, the horizontal cursors are set as the intersections of the vertical cursors and the waveform.
-
Page 65: Cursor Measurements In Fft Mode
9.2.1 Cursor measurements in FFT mode In FFT mode, press the cursor button to open the cursor menu. A description of the cursor menu in FFT mode can be found below: Menu Settings Description Vamp Display the Vamp (or Phase) measurement cursor and menu Type Freq... - Page 66 The waveform calculation menu: Menu Settings Description Factor1 Select the signal source of the factor1 Sign Select the sign of mathematical manipulation + - * / Waveform Factor2 Select the signal source of the factor2 Math Vertical Click to adjust the vertical position of the Math waveform (div) Vertical...
-
Page 67: User Defined Function
Retangular Tapered Select window for digital filter Triangular Window Hanning Hamming Blackman cut-off fre Click to set cut-off frequency upper down Vertikal Drücken Sie auf oder , um die vertikale Position der mathematischen Wellenform anzupassen (div) Example waveforms add CH1 & CH2: 1. -
Page 68: Digital Filter
9.5 Digital filter Digital filter provides 4 types of filters (low pass, high pass, band pass and band reject). The specified frequencies can be filtered by setting the cut-off frequency. Digital filters can only be used for CH1 or CH2. 1. - Page 69 Figure 4.17 Autoscale function 1. When entering into Autoscale function, a autoscale indicator will be flickering on the top left of the screen. 2. In the mode of Autoscale, the oscilloscope can self-estimate Trigger Mode (Edge, Video). At this point, the trigger menu is not available. 3.
-
Page 70: Fft Function
9.7 FFT function FFT refers to the Fourier transform operation on a certain channel. The FFT menu: Source Select the FFT source. Rectangle Hanning Hamming Select window for FFT. Window Blackman Bartlett Kaiser Vrms V RMS and Decibels are amplitude units; Radian, Degrees are phase units Format Radian... -
Page 71: Select The Fft Window
9.7.1 Select the FFT window There are 6 FFT windows. Each one has trade-offs between frequency resolution and magnitude accuracy. What you want to measure and your source signal characteristics help you to determine which window to use. Use the following guidelines to select the best window: Type Characteristics Window... -
Page 72: Xy Mode
Notes for using FFT Use the default dB scale for details of multiple frequencies, even if they have very different amplitudes. Use the Vrms scale to compare frequencies. DC component or offset can cause incorrect magnitude values of FFT waveform. To minimize the DC component, choose AC Coupling on the source signal. - Page 73 The pass/Fail function: Menu Settings Description Operate Start Start operation Stop Stop operation Pass Signal tested corresponds with the rule Fail Signal tested not correspond with the rule Output Beep Beep when it satisfies the rule Stop Stop once satisfying the rule Info Control the display status of info frame Source...
-
Page 74: Executive Buttons
10. Executive buttons Executive buttons include Copy, Default, Run/Stop, Single and Autoset Autoset This button is used to automatically set all the control values of the device required for the generation of a viewable waveform. Press the AUTOSET button; the oscilloscope then performs a quick automatic measurement of the signal. -
Page 75: Print The Screen Image
Zoom Mode Exit Record Length If greater than 10M, it will be set to 10M Waveform Math or Waveform Record Slow-scan Persist Note: When the autoscale is turned on and running, the Autoset button is invalid. Description of the icons: Cancel Autoset:Go back to display the upper menu and waveform information. -
Page 76: Using The Multimeter
The integrated multimeter can be switched on and off using the DMM button. The display window appears in the upper right-hand side of the screen after the function has been activated. The multimeter function is only available for the PeakTech 1206 and PeakTech 1207 oscilloscope models. - Page 77 The multimeter menu is described in the following table: Menu Settings Description Measuring AC current Current Measuring DC current Measuring AC voltage Voltage Measuring DC voltage Resistance measurement Diode test Testing continuity Capacitance measurement Hold Freeze the display during measurement Setzt den aktuellen Messwert auf null.
-
Page 78: Dmm Information Window
11.3 DMM information window The multimeter information window is displayed on the top right of the screen Figure 5.3 Multimeter measurement screen Description 1. Manual/Auto range indicators, MANUAL refers to the measuring range in manual operation mode and AUTO refers to the measuring range in automatic operation mode. 2. -
Page 79: Measurements With The Multimeter
11.4 Measurements with the multimeter 11.4.1 AC/DC voltage measurement 1. Push DMM button on the front panel. Select Current in the bottom menu, select it again to switch between ACA (AC current) or DCA (DC current). 2. Connect the black test lead to the COM terminal on the top of the oscilloscope and the red test lead to the V/Ω/C terminal. -
Page 80: Testing Diodes
11.4.4 Testing diodes 1. Press the DMM button on the front of the device. Then press R in the lower menu several times to toggle between resistance, diode and capacitance until is highlighted. 2. Connect the black test lead to the COM terminal on the top of the oscilloscope and the red test lead to the V/Ω/C terminal. -
Page 81: Multimeter Features
11.5 Multimeter features 11.5.1 Data hold Mode With the data hold mode you are able to freeze the screen with the measured values at any time: 1. Select Hold in the bottom menu as ON. will be shown on the display. HOLD 2. -
Page 82: Multimeter Recorder
You can use the multimeter data recorder to record the measurements when measuring current / voltage with the multimeter function (P 1206, P 1207). Press the Utility button, choose Function from the bottom menu, and choose DAQ from the left menu. - Page 83 Figure 5.4 Recording the measurement 10. When the internal storage is selected: You can export the internal recording file to a USB storage device. Insert the USB storage device into the USB port on the front of the device. Select Export in the lower menu.
-
Page 84: Communication With Pc
Figure 5.6 Recorded measurements 12. Communication with PC This touchscreen oscilloscope series can be integrated into a network via LAN or connected directly to a PC via USB for data recording. To connect, proceed as described in the following sections. 12.1 USB port 1. -
Page 85: Lan Port
Figure 6.1 Display of the measured values using the software 12.2 LAN Port Direct connection tot he LAN input of the PC: 1. Connection: Plug the LAN cable into the LAN connection on the back of the oscilloscope. Plug the other end into the LAN port on the PC. 2. - Page 86 Figure 6.2 Network settings 3. Setting the network parameters of the PeakTech® oscilloscope software: Run the software on the computer. Under the Communications menu, choose Ports-settings. Set the “Connect using” option to LAN. The first three bytes of the IP address are the same as for the IP address in step (2).
- Page 87 4. Set the network parameters of the oscilloscope: Press the icon and click Utility. After that select Function in the bottom menu and on the left sided menu appears LAN Set which you can select. In the bottom menu, set the Type item as LAN, and select Set.
-
Page 88: Specification
Perform “Self-calibration” if the operating temperature changes by up to or even more than 5 ℃ (see “Performing Self-Calibration”) All technical data, with the exception of those labeled “typical”, can be met Description Specifications P 1206 70 MHz P 1207 120 MHz Bandwidth... - Page 89 Channel to channel isolation 10MHz: 40 : 1 Time delay between channels 150 ps (typical) 0.05 Sa/s - Dual CH MSa/s P 1206 P 1207 0.05 Sa/s – Single CH 1 GSa/s Sampling rate 0.05 Sa/s - Four CH range MSa/s P 1211 0.05 Sa/s -...
- Page 90 Description Specifications ≤ 5.0 ns P 1206 ≤ 2.9 ns P 1207 Rise time (at input typical) ≤ 5.0 ns P 1211 P 1212 ≤ 3.5 ns 1 mV; ±4% DC gain accuracy ≥2 mV; ±3% Delta Volts between any two averages of ≥16 waveforms...
-
Page 91: Trigger
13.1 Trigger Description Specification Trigger level range Internal ±5 div from the screen center Trigger level accuracy Internal ±0,3 div (typical) Trigger displacement According to record length and time base 100 ns – 10 s Trigger holdoff range Input signal frequency ≥ 50 Hz 50 % level setting (typical) Edge Trigger Slope... - Page 92 Description Specification 30ns to 10s Idle time Positive, Negative Polarity Timeout Trigger 30ns to 10s Idle time Rising, Falling Edge type 30ns to 10s Idle time Nth Edge Trigger 1 to 128 Flankennummer AND, OR, XNOR, XOR Logic Mode H,L, X, Rising, Falling Input mode Logic Trigger Goes True, Goes False, Is True >,...
-
Page 93: Multimeter
Description Specification Start of Frame, Type of Frame, Identifier, Data, ID & Trigger condition Data, End of Frame, Missing Ack, Bit Stuffing Error Common, Custom Baud rate 5% to 95% Sample Point Data, Remote, Error, Overload Frame type 13.2 Multimeter Leistungsmerkmale Anmerkungen Maximale Messbereichs -... -
Page 94: General Specifications
14. General specifications Display Display type 8" colored LCD (Liquid Crystal Display) Display resolution 800 (Horizontal) × 600 (Vertical) Pixels Display colors 65536 colors, TFT screen Probe compensation Output voltage About 5 V, Peak-to-Peak voltage ≥1 MΩ. (typical) Frequency (Typical) Square wave of 1 KHz Power supply 100V –... - Page 95 Notes on using the lithium-ion battery: Caution: It is essential to observe the following precautionary measures when handling Li-Ion batteries: When using Li-Ion batteries, do not work in environments with extreme temperatures or very high pressure differences, as this can lead to unwanted chemical reactions inside the battery. This can lead to smoke, fire or the battery bursting ...
- Page 96 We hereby confirm that all devices meet the specifications stated in our documents. All devices are calibrated in the factory after production. It is recommended to recalibrate the unit after 1 year. ® © PeakTech 02/2021/ Lie PeakTech Prüf- und Messtechnik GmbH – Gerstenstieg 4 – DE-22926 Ahrensburg / Germany +49-(0) 4102-97398 80 +49-(0) 4102-97398 99 ...
Need help?
Do you have a question about the 1206 and is the answer not in the manual?
Questions and answers