
Related Manuals for Spectris SERVOMEX SERVOPRO NANO Trace DF-740


Summary of Contents for Spectris SERVOMEX SERVOPRO NANO Trace DF-740
- Page 1 SERVOPRO NANO Trace DF-740 Analyzer Installation and Operator Manual Part Number: 225488 Revision: 073122 US English Language: 211596 Rev 063022 © Servomex Group Limited. 2022...
- Page 2 IMPORTANT INFORMATION Continued safe and reliable operation of this equipment is conditional on all installation, operation and maintenance procedures being conducted in accordance with the appropriate manuals, by personnel having appropriate qualifications, experience, and training. Failure to observe the requirements of the manual may result in the user being held responsible for the consequences and may invalidate any warranty.
-
Page 3: Table Of Contents
Contents Table of Contents Safety Summary ..........................1 General Warnings and Cau�ons ....................... 1 Laser Safety ............................3 Safety Labelling and General Marking ..................... 4 Introduc�on ............................6 Product Descrip�on .......................... 6 2.1.1 Product Dimensions ........................6 2.1.3 Internal Components ........................ 10 Specifica�ons Summary ......................... - Page 4 6.3.8 View Logs Menu ........................41 6.3.9 View System Error Codes ......................43 6.3.10 Analyzer Setup .......................... 45 6.3.11 Analog Output Setup ........................ 51 6.3.12 Graph Setup ..........................52 6.3.13 Scheduled Reboot ........................53 6.3.14 Diagnos�cs Menu ........................54 6.3.15 Power Up Default (applicable to analyzers with iso valves) .............
- Page 5 Contents Appendix B: NanoTrace DF-700 Series Moisture Analyzers Serial Digital Communication Protocol Programming Guide ......................90 225488 Rev 073122 © Servomex Group Limited. 2022...
- Page 6 Table of Figures Figure 1: Analyzer Markings Shown in Rear Area View ..................4 Figure 2: Sensor Markings – Side ........................4 Figure 3: Sensor Marking – Front ........................5 Figure 4: DF-740 Analyzer (front) ........................6 Figure 5: DF-740 Analyzer (rear) ........................7 Figure 6: DF-740 Analyzer (le�) ..........................
- Page 7 Contents Figure 43: View System Error Code Log Menu ....................43 Figure 44: System Error Log Screen ......................... 43 Figure 45: Vacuum Source Test Log Menu ....................... 44 Figure 46: Vacuum Source Test Log ......................... 45 Figure 47: Sample GSF Menu ........................... 46 Figure 48: Sample GSF Setup Screen........................
- Page 8 Figure 87: Download Timeline ......................... 72 Figure 88: System Info Menu ..........................73 Figure 89: System Info Screen .......................... 73 Figure 90: Firmware Upgrade .......................... 74 Figure 91 The WEEE label ..........................81 Figure 92: Schema�c of Moisture Cell ......................83 viii 225488 Rev 073122 ©...
-
Page 9: Scope Of The Manual
About this manual About this manual Safety information The following icons are used throughout this manual to iden�fy any poten�al hazards that could cause acute injury to people or damage to the equipment: This symbol warns of specific hazards which, if not considered, may result in personal injury or death. -
Page 10: Getting Started
About this manua Getting Started Thank you for selecting the NanoTrace DF-740 Analyzer. Servomex designs, manufactures, exhaustively tests, and supports every analyzer under the tightest quality controls. You can expect every Servomex analyzer to arrive in perfect condition and provide years of trouble-free service if maintained properly. Please call your nearest Servomex Business Center if you need assistance. -
Page 11: Safety Summary
Safety Summary Safety Summary General Warnings and Cautions WARNING: HAZARDOUS AC Hazardous AC voltages are present within this instrument. Do not remove the top or left side covers — no user-serviceable parts are located under the covers. Do not connect this analyzer to AC power until all signal cables and plumbing have been connected. - Page 12 Safety Summary WARNING: ENSURE PROPER CARRYING, LIFTING AND MOUNTING The weight of this analyzer is greater than 30 kg. Proper methods of lifting and carrying can help to protect against injury. Two individuals should lift and carry the instrument. Make sure to center your balance and properly space your feet a shoulder-width apart when lifting the instrument.
-
Page 13: Laser Safety
Safety Summary Laser Safety The DF-740 analyzer is a Class 1 laser product (per BS EN 60825-1:2014 and 21CFR 1040.10 and 1040.11 except for deviations pursuant to Laser Notice No. 56, 5 May 2019). It contains a laser emitter inside the moisture sensor, which is sealed and not user serviceable. -
Page 14: Safety Labelling And General Marking
Safety Summary Safety Labelling and General Marking Loca�on of Informa�onal product marking and safety labelling is shown in Figure 1, Figure 2, and Figure Figure 1: Analyzer Markings Shown in Rear Area View Figure 2: Sensor Markings – Side 225488 Rev 073122 ©... -
Page 15: Figure 3: Sensor Marking - Front
Safety Summary Figure 3: Sensor Marking – Front 225488 Rev 073122 © Servomex Group Limited. 2022... -
Page 16: Introduc�On
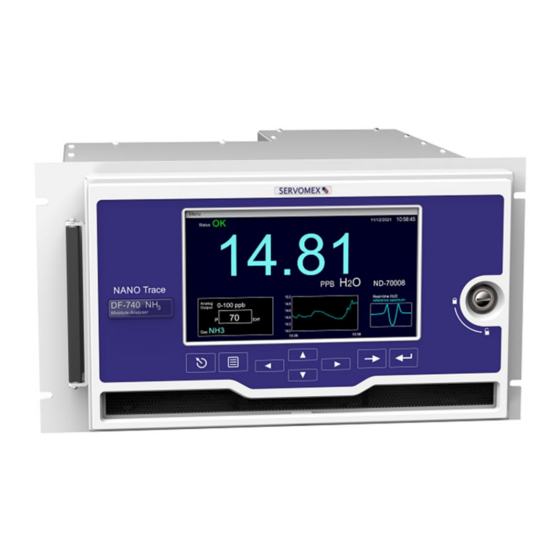
Introduc�on Introduction Product Description The NanoTrace DF-740 Moisture Analyzer is an instrument designed for con�nuous UHP (Ultra High Purity) analysis of moisture content in process gases. It is housed in a steel chassis for rack-moun�ng. Its external features include a 6 x 9-inch LCD screen, push-buton keys for user-interface, a gas panel containing ports for input and output of gasses (process and pneuma�c), connectors for digital and analog data output, and an IEC 60320 C-13 receptacle for connec�on to electrical power. -
Page 17: Figure 5: Df-740 Analyzer (Rear)
Introduc�on Figure 5: DF-740 Analyzer (rear) Figure 6: DF-740 Analyzer (le�) 225488 Rev 073122 © Servomex Group Limited. 2022... -
Page 18: Figure 7: Vacuum Pump Outline Drawing
Introduc�on 10.85 [275.69] 9.05 [229.78] .03 [0.76] 5.94 [150.85] 4.19 [106.51] 7.22 [183.39] 2.20 [55.97] .81 [20.55] 5.00 [127.00] 5.36 [136.03] 8.46 [214.96] 10.27 [260.87] 7.32 [185.98] 8.46 [214.96] 5.36 [136.03] 8.03 [203.96] 6.36 [161.57] 5.76 [146.30] 5.00 [127.00] 4.97 [126.15] 1.01 [25.68] Figure 7: Vacuum Pump Outline Drawing 225488 Rev 073122... -
Page 19: Figure 8: Vacuum Pump Moun�Ng Dimensions
Introduc�on 5.17 [131.32] 4.92 [124.97] 4.92 [124.97] Ø.28 [Ø7.14] 4 PL MOUNTING FOR 6.89 [175.01] 3.94 [100.08] BOTTOM OF BRACKET Ø.28 [Ø7.14] Ø.28[Ø7.14] 3.94 [100.08] 4 PL 4 PL 2 PL MOUNTING FOR LEFT OR MOUNTING FOR RIGHT SIDE OF BRACKET REAR OF BRACKET 3.94 [100.08] 2 PL... -
Page 20: Internal Components
Introduc�on 2.1.3 Internal Components The DF-740 Analyzer’s major internal components are shown in Figure 9, below. Figure 9: Major Internal Components Specifications Summary A summary of DF-740 characteris�cs is provided in the paragraphs below. Complete specifica�ons are provided in Chapter 10 Specifica�ons. 2.2.1 Moisture Detection Lowest Detection Level (LDL): 10 ppb @ Constant Conditions... -
Page 21: Laser
Introduc�on 2.2.3 Laser Max Power: 50mW/30mW Beam Divergence: 436 mrad Pulse Pattern: CW Classification: Laser Device- Class 3, Analyzer-Class 1 (per BS EN 60825-1:2014 and 21CFR 1040.10 and 1040.11 except for devia�ons pursuant to Laser No�ce No. 56, 5 May 2019) 2.2.4 Environmental Operating Conditions General: Indoor use only in a clean, dry, non-hazardous area of pollution degree 2, as defined in EN... -
Page 22: Installa�On, Start-Up, And Shutdown
Installa�on, Start-up, and Shutdown Installation, Start-up, and Shutdown Unpacking Procedure Follow the procedure below to unpack your DF-740 NanoTrace Analyzer: 1. Examine the condition of the packaging and its contents. If any damage is apparent, immediately notify the carrier and Servomex. Do not proceed with the installation. 2. -
Page 23: Analyzer Installa�On Overview
Installa�on, Start-up, and Shutdown Analyzer Installation Overview Installation of the analyzer requires the following general steps: 1. Mounting the analyzer and vacuum pump. 2. Connecting outlet tube to the vacuum pump and connecting vacuum outlet to vent. 3. Connecting the pneumatic pressure service to the pneumatic inlet fitting. 4. -
Page 24: Figure 11: Vcr Gasket (With Supplied Moun�Ng Bracket)
Installa�on, Start-up, and Shutdown Figure 11: VCR Gasket (with supplied moun�ng bracket) Pneuma�c Gas Inlet Process Gas Inlet Moisture Sensor Outlet Figure 12: DF-740 Analyzer Gas Panel 2. Connect the stainless-steel sample gas feed to the process gas inlet fitting (see Figure 12) using VCR gasket (Figure 11). -
Page 25: Figure 13: Vacuum Pump Assembly
Installa�on, Start-up, and Shutdown NOTE For H service, the sample outlet line must be made of stainless steel. WARNING: AMMONIA IS A TOXIC GAS Ammonia is a toxic gas. Exposure to high concentrations of ammonia causes immediate burning of the eyes, nose, throat, and respiratory tract and can result in blindness, lung damage or death. - Page 26 Installa�on, Start-up, and Shutdown correct voltage (110VAC or 220VAC) for your analyzer and pump. Contact Servomex if you received an analyzer or pump that is not compatible with your facility power. 8. Open valve controlling sample gas supply to analyzer. Check for leaks. If leaks are detected, shut off supply and fix leaks.
-
Page 27: Figure 14: Star�Ng Gas Flow
Installa�on, Start-up, and Shutdown NOTE Power cord is supplied for 110VAC installations. For 220VAC installations, power cord is customer-supplied. Customer-supplied cord must be rated for 250 VAC, 10 A with appropriate plug for location and an IEC 60320 C- 13 receptacle for connection to the analyzer. 9. -
Page 28: Analyzer Start-Up
Installa�on, Start-up, and Shutdown Analyzer Start-up Open the door and turn on the power using the main power switch inside the analyzer (see Figure 9). Plug pump power cord connector into grounded electrical outlet. The pump should turn on. The analyzer will undergo a series of diagnostic procedures and various start-up screens are displayed. -
Page 29: Gas Pressure And Flow Se�Ngs
Installa�on, Start-up, and Shutdown Background Gas Pressure Vacuum Source 150 - 250 Torr 300 - 400 Torr 70 - 80 Torr Table 1: Recommended Sample Outlet Vacuum Pressure 3.4.2 Gas Pressure and Flow Settings The following procedure assumes all electrical and plumbing connections have been made according to instructions in this manual. -
Page 30: Analyzer Shut Down
Installa�on, Start-up, and Shutdown This will allow the factory to confirm that the analyzer is working properly by comparison with data stored at the time of shipment, and in addition will set a baseline for comparison with future downloads, if any. Analyzer Shut Down To minimize the �me required for the analyzer to re-achieve a zero baseline on start-up, the following steps should be followed when shu�ng the analyzer down. -
Page 31: Op�Ons
Op�ons Options The following options to the DF-740 are available at the time of order: Key Lock An optional key lock can be installed in the door of the analyzer to prevent access to the power switch and other internal components. The lock is supplied with two keys. The key lock only prevents access to the internals of the analyzer. -
Page 32: Connec�Ng To External Devices
Connec�ng to External Devices Connecting to External Devices The analyzer can be interfaced to a variety of external devices via the ports on the rear panel. Alarm contacts, voltage, and current outputs, and serial communications are supported. All outputs, analog or digital, are fully isolated from earth ground. -
Page 33: Analog Signal Outputs - J4
Connec�ng to External Devices applicable email for your region: service_americas@servomex.com (North and South America), service_europe@servomex.com (Europe), or service_asia@servomex.com (Asia). Pin # Signal Description J5-8 Ground J5-7 4 wired 485 paired with TX+ J5-6 Unused J5-5 4 wire 485 paired with RX+ J5-4 Unused J5-3... -
Page 34: Ma Outputs - J4
Connec�ng to External Devices 4-20 mA Outputs – J4 J4 Pin # Moisture Signal Description J4-8 Ground J4-7 J4-6 A Out + Analog Voltage Output (+) J4-5 A Out - Analog Voltage Output (-) J4-4 Unused J4-3 Unused J4-2 4-20 mA + 4-20 mA Output (+) J4-1 4-20 mA -... -
Page 35: Relay Ports - J8, J9
Connec�ng to External Devices Relay Ports – J8, J9 Four form C (SPDT) relays (contact closures) are provided to assign to the various alarms. The contacts are rated at 30 VDC, 1A. They are not designed to switch AC power. The relay contacts can be programmed through the user interface for up to four moisture levels: temperature, moisture cell diagnostics, zero calibration in progress, analyzer off line, or freeze of analog outputs during calibration. -
Page 36: User Interface
User Interface User Interface Data Display Screen The Data Display Screen, shown in Figure 18 below, is located on the analyzer front panel above the Keypad. The Keypad and Data Display Screen constitute the analyzer user interface. Figure 18: Data Display Screen Display elements include: •... -
Page 37: Keypad
User Interface Keypad The Keypad, used with Data Display Screen, allows the user to control all the features of the analyzer. The layout of the keypad on the front panel is represented in Figure 19 below. Figure 19: Keypad The Menu key activates the menu structure on the view screen. Once in the menu, the arrow keys ( ) highlight the various menu features. -
Page 38: Main Menu
User Interface 6.3.1 Main Menu Figure 20: Main Menu (Without Isola�on Valves Op�on) The Main Menu is accessed by pressing the Menu key on the front panel. Use the arrow keys ( ) to navigate up and down through the list. Select the highlighted item with the Enter key on the front panel. -
Page 39: Figure 21: Isolate Analyzer
User Interface Figure 21: Isolate Analyzer The Isolate Analyzer func�on allows the internal gas lines and the moisture sensing cell volume to be isolated for a planned removal of the external delivery lines. It is also considered the first step in the shut-down procedure. -
Page 40: Restore Sample Gas Flow
User Interface When in isola�on mode, the moisture cell’s pressure transducer will yield an incorrect reading of the actual cell pressure. Because the displayed moisture reading is dependent upon a proper pressure reading, moisture readings should be ignored while the cell is under isola�on. -
Page 41: Controls Menu
User Interface 6.3.4 Controls Menu Figure 24: Controls Selec�on from Main Menu The Controls menu selection (Figure 24) accesses the Gas Valves submenu, which opens the gas control dialog box. 6.3.4.1 Gas Valves Control The gas valves control dialog box, as shown in Figure 26, is used to control the flow of gas through the moisture cell. -
Page 42: Calibrate Menu
User Interface Figure 25: Isolate Warning When the moisture cell is isolated from gas flow, an indication will appear at the bottom of the main display indicating Isolated. Because the displayed moisture reading is dependent upon a proper pressure reading, moisture readings should be ignored while the cell is under isolation. -
Page 43: Figure 27: Calibrate Menu
User Interface Figure 27: Calibrate Menu Instrumental dri� has minimal effect on the quan�ta�ve moisture content result. Once opera�ng parameters are in place from the factory, no other SPAN calibra�on is necessary. Sample line contribu�ons to moisture, however, especially at low ppb levels, are difficult to remove even in a correctly opera�ng system. -
Page 44: Figure 28: Check/Adjust Zero Menu
User Interface Figure 28: Check/Adjust Zero Menu The Check/Adjust Zero screen displays informa�on including a live reading of moisture in ppb (or ppm) and Zero Reference and Zero Offset values. Figure 29: Check/Adjust Zero Screen The Zero Reference value is based on the devia�on of the instrument’s baseline from what was set at the factory. -
Page 45: Figure 30: Manual Zero Screen
User Interface The User Zero Offset and Active Zero Offset are two mechanisms to modify the zero baseline. When the Active Zero feature is turned on, the User Zero Offset display is inactive and Active Zero Offset will be displayed instead. Refer to 6.3.14.1 Active Zero On/Off for additional information on the Active Zero feature. -
Page 46: Data History Rou�Ne
User Interface For this purpose, it is necessary to ensure that moisture free gas (sub ppb) is entering the sensor through the process inlet. When switching to a gas that is moisture free, it is important to wait the necessary time to allow the reading to re-stabilize. -
Page 47: Figure 31: Data History Menu
User Interface Figure 31: Data History Menu The data history may be downloaded to a USB memory s�ck by using the Next key to move to the Download box and hi�ng ENTER. A screen will appear, reques�ng that a memory s�ck can be placed in the external USB socket (see Figure 33.) The socket is located behind the front door on the le�... -
Page 48: Data Downloader Rou�Ne
User Interface Figure 32: Data History Screen Figure 33: Install Media Firmware version 7.1.16 Serial # ND-70010 Model # DF-740 Location USTC Start time 11-29-2021 03:49 PM End time 11-29-2021 03:51 PM Date Time H2O 11/29/2021 3:48 PM 0.213 11/29/2021 3:49 PM 0.213 11/29/2021 3:50 PM 0.214 Figure 34: Example of Data Download 6.3.7 Data Downloader Routine... -
Page 49: Figure 35: Data Downloader Menu
User Interface Figure 35: Data Downloader Menu When the user selects Data Downloader from the main menu, the Data Downloader screen, Figure 36, displays. This screen enables the user to label data with unique loca�on names as well as to view and download specified data. -
Page 50: Figure 37: View Loca�On Screen
User Interface 6.3.7.1 Set Location The Set Location Function is used to choose a location from a list of existing locations previously entered the system (see 6.3.7.3 Add Location). On the Moisture Data Downloader screen, Figure 36, use the Next key to move to the list of existing names and then use the arrow keys ( ) to select the location desired. -
Page 51: View Logs Menu
User Interface Figure 38: Keyboard Display Use the arrow keys ( ) to navigate the keyboard and use the Enter key to accept each character. If an error is made, use the Next key to move to the Clear Entry key and hit enter. When the location name is complete, use the Next key to move the highlight to Accept New Location and hit Enter. -
Page 52: Figure 40: View Logs Menu Selec�On
User Interface Figure 40: View Logs Menu Selec�on View Logs allows the user to easily access past events that may be related to past operational changes (e.g., zero) or instrument upsets. Use the arrow keys ( ) to scroll up and down through the list. -
Page 53: View System Error Codes
User Interface The Zero Log (Figure 42) reports on adjustments made to the moisture cell zero setting. The date and time of the zero calibration is noted. Figure 42: Zero Log Screen 6.3.9 View System Error Codes The View System Error Codes menu selection is shown in Figure 43, below. Figure 43: View System Error Code Log Menu Figure 44: System Error Log Screen The System Error Log (Figure 44) reports functional errors in the moisture system. - Page 54 User Interface Error Number Description Moisture Peak Not Found Low Sample DC Laser Temperature too far from Setpoint Fan condition Backflow Prevention – ensure adequate flow through the analyzer Table 5: Common Error Codes If these or any other error codes appear on the display of the unit, contact Servomex for assistance. For an expedited turnaround, make sure that a System Data File is downloaded and atached if contact is made through email.
-
Page 55: Analyzer Setup
User Interface The vacuum source capacity test is used to determine the vacuum that the pump can pull in the absence of flow. This is process is used to remove potential variability in the test. Proper flow through the analyzer is a direct result of the proper balance between the pressure on the analyzer inlet and the vacuum at the analyzer outlet. - Page 56 User Interface Figure 47: Sample GSF Menu The GSF setup (Gas Scale Factor) is critical for obtaining quantitatively correct results. It accounts for the fact that moisture molecules have different absorption features in different buffer gases. Use the Next key to move from between fields and use the arrow keys ( ) to change the highlighted selections and to enter numerical values.
- Page 57 User Interface Figure 49: GSF Pressure Se�ng Message NOTE: An entry of Hydrogen in the GSF will automa�cally engage the Hydrogen Safety Service System op�on if equipped. See Appendix A – Hydrogen Safety System for addi�onal informa�on. 6.3.10.2 Alarm Setup The Alarm Setup menu selection is shown in Figure 50, below.
- Page 58 User Interface Moisture Level 3 Moisture Level 4 Temperature Pressure System Table 6: Alarm Codes The temperature alarm indicates an out of specifica�on ambient temperature condi�on in the analyzer cabinet. The pressure range alarm is related to the pressure in the gas path. Finally, system errors are monitored.
- Page 59 User Interface Use the Next key to move from between fields and use the arrow keys ( ) to change the highlighted selec�ons and to enter numerical values. When done, use the Next key to move to the Accept buton and hit the Enter key to return to the main display. Using the ESC key at any �me will exit the screen making no changes and return to the main display.
- Page 60 User Interface Figure 53: Pressure Range Alarm Setup The limits are not user adjustable but are set automa�cally based on the background gases entered in the GSF screen. See page 45 for addi�onal informa�on on se�ng the background gases. Use the Next key to move from between fields and use the arrow keys ( ) to change the highlighted selec�ons and to enter numerical values.
-
Page 61: Analog Output Setup
User Interface Use the Next key to move from between fields and use the arrow keys ( ) to change the highlighted selec�ons and to enter numerical values. When done, use the Next key to move to the Accept buton and hit the Enter key to return to the main display. Using the ESC key at any �me will exit the screen making no changes and return to the main display. -
Page 62: Graph Setup
User Interface Figure 56: Analog Output Setup Screen The In Calibration Relay can be enabled to signal that a zero calibra�on is in process. In addi�on, the user has the op�on to freeze the analog output or enable the analog output to update as the calibra�on progresses. -
Page 63: Scheduled Reboot
User Interface The graph setup is used to adjust the �me scale on the main data display of the analyzer. A specific �me interval in minutes can be chosen for the X-axis on that display. The minimum acceptable �me is 3 minutes. -
Page 64: Diagnos�Cs Menu
User Interface Scheduled reboot allows scheduling of a periodic automatic reboot of the analyzer. The time interval is settable to between 1 and 5 weeks. Time is settable to any time using 24-hour clock notation. Navigation is accomplished using the Next and arrow buttons. The next scheduled reboot is displayed near the bottom of the screen as shown in Figure 60 Figure 60: Next Scheduled Reboot 6.3.14 Diagnostics Menu... - Page 65 User Interface Figure 61: Diagnos�cs Menu Selec�on 6.3.14.1 Active Zero On/Off Screen Figure 62: Ac�ve Zero Setup Screen The Active Zero Offset feature is designed to automa�cally compensate for the analyzer’s gradual zero baseline clean-up. This gradual clean-up is natural and occurs a�er a fresh startup or a�er a prolonged or abnormally high moisture exposure.
- Page 66 User Interface offset value to accommodate the baseline clean-up, the Ac�ve Zero Offset does so automa�cally, and only when necessary. The current Active Zero Offset value is shown in the Check/Adjust Zero screen as shown in Figure 30. It starts at a value of 0.00 ppb when the analyzer is first turned on, and then increments automa�cally as the analyzer applies offset to the readings.
- Page 67 User Interface The Test Relays screen, as shown in Figure 69, is used to assure that the relay outputs are func�oning properly. When the Test Relays screen is selected, the NEXT key is used to move to the number field ) are used to choose the appropriate relay number.
- Page 68 User Interface Figure 65: Test Analog Outputs Menu Selec�on When the Test Output screen is displayed, the NEXT key is used to move to the percentage field where ) are used to choose the appropriate se�ng. The NEXT key is then used to the arrow keys ( move to the Apply field where the Enter key is hit to set the analog output to the selected value.
- Page 69 User Interface Figure 66: Test Analog Voltage Output Screen 6.3.14.4 Signal Monitor The Signal Monitor menu selection is shown in Figure 67, below. Figure 67: Signal Monitor Menu Selec�on 225488 Rev 073122 © Servomex Group Limited. 2022...
- Page 70 User Interface The Signal Monitor screen ( ) depicts 18 system parameters, which are defined in Figure 68 Table . Values for parameters are unique to each system. In the event of a system error, the parameters can be used for diagnostic purposes. Contact Servomex for assistance in using signal parameter data as a diagnostic tool for maintaining system performance.
- Page 71 User Interface 6.3.14.5 Vacuum Source Capacity Test The Vacuum Source Capacity Test menu selection is shown in Figure 69, below. This menu selection access the Pump Capacity Test screen shown in Figure 70. Figure 69: Vacuum Source Capacity Test Menu The vacuum source capacity test can be used to determine the vacuum that the pump can pull.
- Page 72 User Interface Figure 70: Pump Capacity Test Figure 71: Pump Pressure Failure 6.3.14.6 Cell Pressure Calibration The Cell Pressure Calibration menu selection is shown in Figure 72 below. This menu selection accesses the Cell Pressure Calibration screen show in Figure 73. 225488 Rev 073122 ©...
- Page 73 User Interface Figure 72: Cell Pressure Calibra�on Menu Selec�on Cell pressure calibra�on allows calibra�on of the cell pressure transducer. Although the transducer is calibrated at the factory, if the analyzer is located at a high al�tude or has had the transducer replaced, a calibra�on check should be performed.
- Page 74 User Interface Figure 73: Cell Pressure Calibra�on Screen 6.3.14.7 Manual Cell Pressure Override The Manual Cell Pressure Override menu selection is shown in Figure 74 below. This menu selection accesses the Manual Cell Pressure Override screen show in Figure 75. Figure 74: Manual Cell Pressure Override Menu Selec�on 225488 Rev 073122 ©...
-
Page 75: Power Up Default (Applicable To Analyzers With Iso Valves)
User Interface Manual cell pressure override allows the use of either the pressure reading provided by the transducer or a manually entered pressure to determine moisture concentra�on. Naviga�on is performed using the Next and arrow butons. The default se�ng is Sensed, meaning the analyzer is using the value provided by the pressure transducer. - Page 76 User Interface Figure 76: Power Up Default Menu Selec�on The Power Up Default selec�on allows the user to set the default state of the isola�on valves a�er analyzer power up. This feature is available only on analyzers that have the isola�on valves op�on. Use the NEXT key to move from field to field.
-
Page 77: Date/Time
User Interface Figure 77: Power Up Default Screen 6.3.16 Date/Time The Date/Time menu selection is shown in Figure 78, below. This menu selection accesses the Date/Time Setup screen shown in Figure 79. Figure 78: Date/Time Menu The Date/Time Screen is used to set various calendar and clock related parameters. 225488 Rev 073122 ©... - Page 78 User Interface The Next key is used to move from field to field, and the arrow keys ( ) are used to change the numerical digits and units. When in the Time Zone field, the le� and right arrow keys toggle through the diverse op�ons. When done, the use the Next key to move to the Accept field and press the Enter key to confirm.
-
Page 79: Communica�Ons
User Interface 6.3.17 Communications The Communications menu selection is shown in Figure 81, below. This menu selection access the Communications Setup screen shown in Figure 82. Figure 81: Communica�ons Menu Selec�on The Communica�ons screen is used to set parameters related to serial PC communica�ons. The Next key is used to move from field to field, and the arrow keys ( ) are used to change the numerical digits as well as to select the baud rate. -
Page 80: Download System Data
User Interface Figure 82: Communica�ons Setup Screen 6.3.18 Download System Data The Download System Data menu selection is shown in Figure 83, below. Figure 83 Download System Data Menu The contents of the internal system data files can be downloaded to a USB memory s�ck, and the files can either be mailed or e-mailed to Servomex for evalua�on. - Page 81 User Interface Figure 84: System Data Download Figure 85: Media Warning If there is insufficient space available on the media a warning will appear as in Figure 90. If Drive D is not ready, a message will appear as in Figure 91 below. If not ready message appears, select OK, check that USB is inserted correctly and try again.
-
Page 82: System Info
User Interface Figure 87: Download Timeline The file name is automa�cally created and includes the date and �me that the data was recorded as well as the serial number of the analyzer. All files are then automa�cally compressed and loaded as one file on the memory s�ck, which can then be used to forward the informa�on to Servomex for evalua�on. - Page 83 User Interface Figure 88: System Info Menu The System Info screen (Figure 89) gives the user informa�on regarding the configura�on of the analyzer as well as the version of firmware currently installed. The Service Menu is password protected. Do not use this func�on unless instructed by Servomex. Figure 89: System Info Screen 225488 Rev 073122 ©...
- Page 84 User Interface 6.3.19.1 Firmware Upgrade While the Firmware Upgrade box is highlighted, hi�ng the Next key will bring up the Firmware Upgrade dialog box as in Figure 90 below. Place the memory s�ck with appropriate files in the USB port located behind the front door. When ready with hit the Yes, Proceed key and follow the instruc�ons.
-
Page 85: Sample Gas Prepara�On And Delivery
Sample Gas Prepara�on and Delivery Sample Gas Preparation and Delivery Introduction It is important to monitor sample pressure to ensure it does not vary from the specified range for the background gas being supplied to the moisture analyzer. Pressure and background gas composition significantly affect system performance. -
Page 87: Service
Service Service Return Material Authorization number If the analyzer is being returned to the factory, call the Servomex Business office to obtain a Return Material Authorization number. Clearly mark the Return Material Authorization number on the outside of the shipping container and on the packing list. The analyzer should be returned (freight prepaid) to: Servomex Corporation 4 Constitution Way... -
Page 88: Moisture Cell Maintenance
Service Before replacing fuses, turn off the analyzer power switch and allow the analyzer to shut down normally. Disconnect the analyzer power cord from the AC inlet. Main fuses are in the AC inlet module. Facing the AC inlet there is a tab, on the le� side of the inlet, which is pried to open the fuse cover. -
Page 89: Troubleshoo�Ng Guide For The Nanotrace Analyzer
Service For 110 VAC operation, the power cord is a Volex 17251 10 B1. Any equivalent three-wire power cord may be used provided it has a protective ground wire and conforms to the following specifications: 120 VAC, 10 A, 18 AWG, SVT jacket, with a NEMA 5-15P plug and an IEC 60320 C-13 receptacle for connection to the analyzer. -
Page 90: Shipping
Service Shipping If it is necessary to return the analyzer to the factory or ship it to another location, follow the packaging and shipping procedure below to prevent damage to the analyzer during shipment. 1. If analyzer has isolation valves, isolate the analyzer moisture cell by following the steps in 4.2.2 Isolate Analyzer. -
Page 91: Disposal In Accordance With The Waste Electrical And Electronic Equipment (Weee) Direc�Ve
Service 8.6.2 Disposal in accordance with the Waste Electrical and Electronic Equipment (WEEE) Directive Dispose of the analyzer and any associated equipment safely, and in accordance with your local and national safety and environmental requirements. Hint: If you send the analyzer to Servomex or your local Servomex agent for disposal, it must be accompanied by a correctly completed Decontamination Certificate and Return Authorization Number (RAN) (refer to 8.5 Shipping.) The label shown in Figure 91 is fitted to the analyzer. -
Page 93: Theory Of Operation
Theory of Opera�on Theory of Operation The Moisture Measurement Figure 92: Schema�c of Moisture Cell 9.1.1 Moisture and the IR Spectrum The NanoTrace Moisture Analyzer uses infrared (IR) absorp�on as its detec�on method. IR absorp�on is a subset of the overall field of spectroscopy, which concerns the interac�on of light and mater. A conceptual drawing of the type of moisture cell used in the analyzer (called a Herriot cell for physicist Donald Herriot) is shown in Figure 92. -
Page 94: Absorp�On Spectroscopy
Theory of Opera�on Absorption Spectroscopy The relationship that defines absorption spectroscopy is known as Beer’s Law. Beer’s Law equates, in rigorous terms, the concentration of any absorbing molecule based on absorbed light intensity at a particular wavelength, given knowledge of the molecule’s absorption strength and the “path length” of the sample medium. -
Page 95: Specifications
Specifica�ons Specifications 10.1 Moisture Detection Lowest Detection Level (LDL): 10 ppb @ Constant Conditions Accuracy: Greater of ±5% of reading or ±5 ppb @ Constant Conditions Speed of Response: Less than 3 minutes @ 1 lpm Upset Recovery Time: Less than 5 minutes from a high ppb upset to within 100 ppb of the previously stable reading. -
Page 96: Output Signals & Status Indicators
Specifica�ons Inlet Pressure: 70 to 100 psig (4.8 to 6.9 barg, 482.6 - 689.5Kpa) ) Span Gas: Not required. Zero Gas: Optional. Recommended if operating near LDL Gas Path Construction Materials: 316 Stainless Steel, 304 Stainless Steel, Indium, Passivated Steel, Hastelloy C22, Gold, Invar, Acrylic, Buna-N, Sapphire, PCTFE, Polypropylene, 10.3 Output Signals &... -
Page 97: Warranty
Warranty Warranty Servomex warrants each instrument it manufactures to be free from defects in material and workmanship at the F.O.B. point specified in the order, its liability under this warranty being limited to repairing or replacing, at the Seller's option, items which are returned to it prepaid within one (1) year from delivery to the carrier and found, to the Seller's satisfaction, to have been so defective. -
Page 98: Index
Index Index Isolate Analyzer, 28, 30, 32, 33, 36, 38, 41, 42, 43, 44, 45, 47, 52, 53, 54, 56, 57, 59, 61, 62, 64, 65, 67, 69, 70, 72 4-20mA Outputs, 24 Key Lock, 21 about this manual, ix scope of manual, ix symbols, ix Active Zero On/Off, 55... - Page 99 Index table of figures, vi View Location, 40 Test Analog Voltage Output, 58 View Moisture Logs, 41 Test Relays, 56 Theory of Moisture Measurement, 83 Warranty, 87 User Interface, 26 Data Display Screen, 26 Zero Log, 42 Keypad, 27 Menu Structure, 27 User Zero Offset, 35 225488 Rev 073122 ©...
- Page 100 Appendix A – Programming Guide Appendix A: NanoTrace DF-700 Series Moisture Analyzers Serial Digital Communication Protocol Programming Guide Note: For questions about the information in this guide, contact Servomex Customer Service. This guide assumes a user has a basic understanding of binary/hexadecimal system and a programming background.
- Page 101 Appendix A– Programming Guide Servomex DF digital communication protocol messages are mainly in binary format, unless stated otherwise. The main reasons for using binary format, instead of ASCII text format are: 1) to ensure data integrity, 2) to improve communication efficiency and 3) to support multi-drop communication in a RS-485 loop The disadvantage is that a terminal program, like the Hyper Terminal that comes with Microsoft Windows operating system, can't communicate with a DF analyzer in a comprehensible way.
- Page 102 Appendix A – Programming Guide 1. Protocol All numbers are in binary format, unless stated otherwise. For convenience, binary is represented in hexadecimal. 11 Computer (Host) command format: <01><ID#><Cmd><Bytes><Data>...<Data><MsCheckSum><LsCheckSum><CR> where: < > - represents one byte = 01, constant preamble to identify a computer command = ID number of intended analyzer (1-255) = Command Number Bytes...
- Page 103 Appendix A– Programming Guide 2. Table of Commands Notation: fl.: IEEE floating point format. *: additional description available. V: variable length Command name Bytes Reply 700 Description only Status Request* get status ppb* 4 (fl) get averaged ppb reading Get FS 4 (fl) get device full scale in ppm Get Temp...
- Page 104 Appendix A – Programming Guide 3. RS-232/RS485 Wiring Parameters are 8N1, (8 bits, no parity, one stop bit). For using the RS-232C option, connect the unit directly to an RS-232C port at the PC. The RS-485 option requires that the PC have either an internal RS-422/485 interface board or an external RS-232C to RS-485 converter.
- Page 105 Appendix A– Programming Guide RS-485 For RS-485, the analyzer has been configured for a four-wire, full duplex interface. A recommended wire for RS-485 communications is #20 AWG twisted pair. Do not exceed 4000 feet. Connect the RS- 485 wiring as follows: Analyzer COMM Connector to RS-485 interface J15 on analyzer...
- Page 106 Appendix A – Programming Guide 5. Command Description and Examples Command 0 : Status Request Command 1 : Get ppb Command 13 : Get Model Command 32 : Analog Output Range Command 33 : Alarms Command 34 : Command 40 : User Calibration Command 67 : Watchdog Timer Delay...
- Page 107 Appendix A– Programming Guide 0005: Checksum = the byte sum of 05 0000 = 05+00+00 0D: carriage return, marking the end of message Reply: 0205 0003 0002 0100 0B0D where 02: slave (analyzer) identification, indicating the message from an analyzer 05: analyzer ID number 00: echoed command number from the host message 03: number of data bytes in message = 3...
- Page 108 Appendix A – Programming Guide IEEE Standard: For 32-bit system (single precision) 1- bit sign (most significant) 8-bit exponent 23-bit mantissa (least significant) The value of an IEEE floating point is given as sign (exponent-127) value = (-1) * (1.fraction) where fraction = mantissa / 2 3CC1 1C2B gives sign=0, exponent = 121, mantissa =...
- Page 109 Appendix A– Programming Guide ExpRangeBRelay ExpRangeBFS NULL" where AnalyzerModel: NTOA: oxygen, NTHA: moisture Mode: S: set; R: read settings; for the read ('R') case the remaining parameters in the command are returned zero: in ppm, the minimum output scale FullScale: in ppm, the maximum output scale InCalRelay: 0-4, 0 for no assigned relay, relay for calibration CalFreeze: 0:Off;...
- Page 110 Appendix A – Programming Guide FullScale: 1.0 ppm InCalRelay: 2 CalFreeze: 0 ExpRangeARelay: ExpRangeAFS: 0.30 ppm ExpRangeBRelay: 0 ExpRangeBFS: 10.0 ppm Command: Hex: 0101 2033 4E54 4841 2053 2030 2E30 3030 3030 3020 312E 3230 3030 3030 2030 2030 2032 2032 2E35 3030 3030 3020 3020 352E 3030 3030 3030 0009 BB0D ASCII: 3NTHA S 0.000000 1.200000 0 0 2 2.500000 0 5.000000 Reply:...
- Page 111 Appendix A– Programming Guide Audible: 1 byte; 0 for Off, 1 for On for AlarmID= O or T LowThreshold: in ppm for O; in ºC for T HighThreshold: in ppm for O; in ºC for T Deadband: in ppm for O; in ºC for T NULL: string terminator, NUL character For AlarmID = O, If HighThreshold...
- Page 112 Appendix A – Programming Guide Command 40: User Calibration Command Cmd# Bytes Reply Description User Cal activate user calibration Data Bytes: <Type><Mode><ppm Span value in ASCII> Type: 0: Span, 1: Zero Mode: 0: Manual, 1: Auto Ex1. Auto Span at 7.05 ppm Data Bytes in hex: 0100 30 ©...
- Page 113 Appendix A– Programming Guide Command 67: Read Watchdog Timer Delay Command Cmd# Bytes R e p l y Description Read watchdog Send a Control 4 (fl) timer delay Data byte is an unsigned (4-byte) long integer binary format, the LSB first. The delay is hard coded to 3 minutes.
- Page 114 Appendix A – Programming Guide Hex: 0201 6437 3036 2F32 342F 3031 2031 353A 3030 3A30 3020 3036 2F32 352F 3031 2031 353A 3030 3A30 3020 3630 2036 3031 3620 4259 5445 5320 5245 4144 590B F60D ASCII: d706/24/01 15:00:00 06/25/01 15:00:00 60 6016 BYTES READY ö Where AnalyzerModel: NTOA for oxygen, NTHA for moisture MM/DD/YY: log start/end date...
- Page 115 Appendix A– Programming Guide Command 102: Get H2O Data Command Cmd# Bytes Reply DF-760 Description H2O Data: Status_Bytes, ppb, Pcell and Get H2O Data Room_Temperature Reply Data bytes: [Status_Bytes (3 bytes), ppb (4 bytes), Pcell (4 bytes) and Room_Temperature (4 bytes) ] Data: Status_Bytes: same as the Command 1 "Status Request"...
- Page 116 Appendix B – Programming Guide Functionality: depending on the data byte parameter. Timing A new sample name selected via Command 126 will be displayed on the front screen in about 3 seconds. Similarly in about 3 seconds, the new name is available for Command 127 reply. ------ 2017-10-23 background sample gas selection------ Command 126 (HS): Select background sample gas write info, data bytes are case sensitive for all models, except...
Need help?
Do you have a question about the SERVOMEX SERVOPRO NANO Trace DF-740 and is the answer not in the manual?
Questions and answers