Table of Contents
Advertisement
Quick Links
Advertisement
Table of Contents

Related Manuals for Camille Bauer LINAX PQ5000MOBCLM


Summary of Contents for Camille Bauer LINAX PQ5000MOBCLM
- Page 1 System handbook LINAX PQ5000MOBCLM (MULTI-PQ) LINAX PQ5000MOBCL Operating instructions (2023-10) Camille Bauer Metrawatt AG Aargauerstrasse 7 CH-5610 Wohlen / Switzerland Phone: +41 56 618 21 11 Telefax: +41 56 618 35 35 E-Mail: info@cbmag.com https://www.camillebauer.com...
-
Page 2: Table Of Contents
Contents Legal information ....................................3 Purpose of this document .................................. 3 Scope of supply ....................................4 Device overview ....................................5 Short description.................................... 5 System overview ................................... 5 Operation and evaluation ................................6 Measurement data ..................................7 Device usage ....................................7 Preparation of the measurement application ............................ -
Page 3: Legal Information
1. Purpose of this document This document describes the universal power quality analysis devices LINAX PQ5000MOBCLM (PQ5000- MOBILE CURRENT LINK MULTI-PQ) and LINAX PQ5000MOBCL combined with the current modules 3P and 3PN. It is intended to be used by: •... -
Page 4: Scope Of Supply
2. Scope of supply Upon receive of delivery check device and supplied accessories for completeness and integrity. The scope of supply depends on the ordered variant. Image Description o.k. Power quality analyzer with 5 test leads for voltage inputs in ... -
Page 5: Device Overview
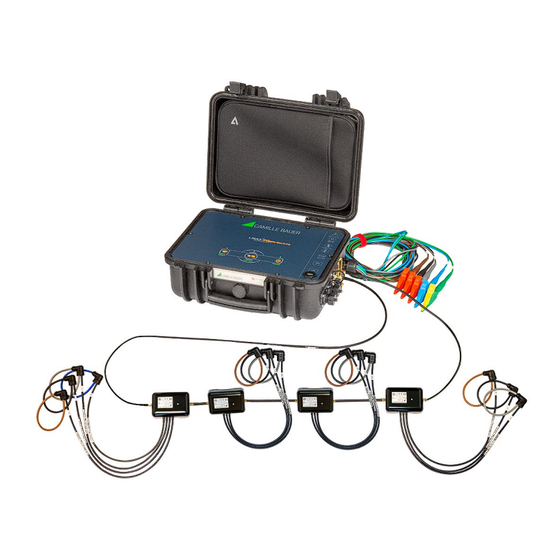
3. Device overview 3.1 Short description The system LINAX PQ5000MOBCL resp. PQ5000MOBCLM is designed for power quality and load flow analysis in power distribution systems. The voltage and its quality are measured centrally in the base unit. The current measurement of up to 9 feeders with up to 36 current channels is done using Current Modules, which are arranged in a ring topology, the so-called Current Link, providing the current information for the 3 or 4 channel feeders. -
Page 6: Operation And Evaluation
Available base units 3.3 Operation and evaluation No software is required for the parameterization of the device or the evaluation of the measurement results. The WEB interface of the device provides all required functions. These can be used via mobile phone, tablet or laptop via the LAN or WLAN interface. -
Page 7: Measurement Data
3.4 Measurement data The device provides various measurement data via device website: Present TRMS values including phasor diagram, phase sequence Instantaneous check and evaluation of energy direction for each feeder monitored via values a current module Provides data about the time-related energy consumption (load profile) Energy and the total energy consumption per feeder Present data about harmonics, interharmonics, THD of voltages as... -
Page 8: Preparation Of The Measurement Application
4. Preparation of the measurement application 4.1 Connecting to the measurement device 4.1.1 Connection via LAN interface Before devices can be connected to an existing Ethernet network, you have to ensure that they will not disturb the normal network service. The rule is: None of the devices to connect is allowed to have the same IPv4/6 address than another device already installed This also applies if the network only consists of a PC and the measuring device. - Page 9 Network settings (Communication | Ethernet) The following settings have to be arranged with the network administrator: Must be unique, i.e. may be assigned in the network only once • IPv4/6: IP address Defines how many devices are directly addressable in the IPv4 network. This •...
- Page 10 Time synchronization via NTP protocol For the time synchronization of devices via Ethernet NTP (Network Time Protocol) is the standard. Corresponding time servers are used in computer networks, but are also available for free via Internet. Using NTP it's possible to hold all devices on a common time base. Two different NTP servers may be defined.
-
Page 11: Connection Via Wlan Interface
Communication tests Via the service menu on the device website you may check if the selected network structure is valid. The device must be able to reach the DNS server via gateway. The DNS server then allows resolving the URL of the NTP server to an IP address. -
Page 12: Resetting The Network Settings
4.1.3 Resetting the network settings If the communication settings of the communication interface are no longer known or an activated whitelist prevents access to the device, they can be reset to the default settings via the keys on the device. Control panel on PQ5000MOBCLM Function Procedure and result... -
Page 13: Parameterization Of The Device Functionality
4.2 Parameterization of the device functionality 4.2.1 Configuration manager This measurement solution supports campaigns for repeated measurements at the same locations. For that, a configuration manager can handle up to 20 different device settings. The administration of the device configurations is done via the configuration manager. •... -
Page 14: Device Configuration
4.2.2 Device configuration A full parameterization of all functions of the device can be performed via the settings menu on the website. Upload a configuration from computer The configuration data of the selected file will be directly loaded into the device. At the same time the active configuration in the configuration manager is updated. - Page 15 Power Quality (Chap. 4.4): Definition of parameters for monitoring the PQ events and settings for the • statistical power quality assessment. The default values of the trigger thresholds and hystereses are set to the common values of the EN50160 for a public low-voltage distribution system. User-specific limits for the evaluation of the PQ statistic can also be set.
-
Page 16: Security System
4.3 Security system There are several security mechanisms implemented in the device which can be activated to provide a comprehensive access protection to all device data. The role-based access control (RBAC) system allows restricting the access to measured data, configuration settings and service functions to the rights granted to the present user. - Page 17 Adding users / API keys In addition to the 2 predefined users a maximum of 6 users or API keys may be created. To do so, use “Add user / API key” and select the type of user to be created. Users: During password definition the requirements for a secure password are checked and the result is displayed.
- Page 18 Once the API key is created it can be displayed using “Show API key” When the application wants to communicate via REST interface with the device, it has to provide the API key and the session token via the cookie field in the request header, e.g.: Further information is provided in the document “http interface SINEAX PQx000”...
-
Page 19: User Log In / Out Via Website
4.3.2 User log in / out via website a) If “anonymous” has no granted permissions Via website Remarks 1) Enter user name and password 2) Press <ENTER> or select “Login” If successful, depending on the permissions of the user logged in, the appropriate website is displayed b) If “anonymous”... -
Page 20: Whitelisting Clients
Before HTTPS communication can be used a root certificate needs to be installed. The user can either use a Camille Bauer certificate (default setting) or its own customer certificate. This may be changed when defining the Settings of the Security system. -
Page 21: Audit Log (Syslog)
The imported certificate is valid for all devices of the PQ, AM, DM and CU series. Agree to install the certificate if the below security warning appears: Customer certificate You may also use a customer server certificate with a private key, but for that you first need to change the Settings of the Security system in the item Web Security. - Page 22 Example of a security log: The severity of each message is shown in a color code, which may also serve as filter criteria. Each entry into this list may, if activated, also be transferred to a central log-server using the SYSLOG protocol for security auditing.
-
Page 23: Pq Monitoring
4.4 PQ monitoring Power quality monitoring provides both a statistical evaluation, allowing an assessment of compliance with standards (e.g. EN 50160) or supply contracts, as well as records of events in the grid (e.g. power voltage dips). This facilitates the analysis of causes and effects. Conformity reports may also be created directly via the website of the device. -
Page 24: Pq Statistic
Mains signalling voltage The device monitors mains signalling voltages, which are transmitted in the supply system for control purposes, and records them as events (8.1.3). Typically, these are ripple control signals. The user can define the frequency of the signalling voltage, the threshold and hysteresis (related to the nominal voltage) as well as the recording duration in multiples of the measurement interval of 10/12 cycles. -
Page 25: Provision Of Pq Data
The assessment of the PQ statistic is shown in the chapter Data recording | PQ statistic (8.1.4), including the creation of conformity reports. Recorded PQ parameter groups Measurement Averaging time Applied limits Power frequency 10 s Voltage magnitude 10 min. The applied limits and time conditions of the preset standards can be seen via the device Flicker P... - Page 26 If for the selected time range PQDIF files are already stored in the device the below warning will be displayed. PM 1002825 000 01 System handbook PQ5000MOBCL-CLM 26/66...
-
Page 27: Safety Instructions
5. Safety instructions Death, serious injury or fire hazard could result from improper connection of this instrument. Before connecting the base unit and the current modules you have to read and understand this manual. General Connection of this instrument must be performed in compliance with all applicable national regulations on electricity and any additional safety requirements applicable to your installation. - Page 28 When connecting If measurements are made which involve a risk of contact, a second person should be present on-site. This is typically the case during the connection of the current and voltage measurement inputs. De-energize the electrical circuit to be monitored before connecting the test leads and current sensors.
-
Page 29: Electrical Connections
6. Electrical connections Be sure to observe the Safety instructions in chapter 5! 6.1 Connecting the base unit Meaning Symbol Caution! General hazard point. Perfect and safe operation requires that this System handbook has been read and understood. 6.2 Voltage connections base unit For security reasons, the leads for voltage measurement (L1, L2, L3, N) are equipped with the following fuse: SIBA, Typ 7017240, 6.3 x 32mm, very fast acting... -
Page 30: Current Connection Current Link
6.3 Current connection Current Link The Current Link supports the current measurement of up to 9 feeders with up to 36 current channels. It consists of Current Modules, which are arranged in a ring structure and monitor 3 or 4 channel feeders. A typical connection of a PN-Moduls is shown below: Rogowski coils The Rogowski coils of the current modules are different in color and also marked: Brown –... - Page 31 The individual current modules in the ring are connected using SMA connection cables. The SMA connection cables must not be kinked during assembly, as the conductors could be damaged. The bending radius should be not smaller than 50mm. The fastening of the SMA cables to the corresponding connectors should be done with a torque wrench with a maximum torque of 1 Nm.
-
Page 32: Operating Led Of The Current Module 3P / 3Pn
The junction box of a current module must not be mounted on bare conductors, nor must connecting cables be routed over bare live conductors. If there are bare connections or busbars in the immediate vicinity, the junction box and connecting cables must be secured in such a way that their metal parts cannot touch live, bare parts in the event that the fixing of the junction box or a connecting cable becomes detached unexpectedly. -
Page 33: Gps Time Synchronization
6.5 GPS time synchronization The optional GPS connection module serves for connecting a GPS receiver as a very accurate time synchronization source for the measurement device. Time synchronization via NTP or GPS is an elementary requirement for class A power quality measuring devices. -
Page 34: Power Supply
Connecting the GPS receiver Never connect the RJ45 socket of the connecting cable directly to a network device such as a router or switch. These devices could be damaged. The GPS receiver is plugged directly into the GPS connection module. The connection cable has a length of 5 m. -
Page 35: Performing The Measurement
7. Performing the measurement To make the final evaluation and conformity assessment of the data much easier, the measurement should be carried out as follows: a) Data recording should only be started when… The coorect connection of the device has been checked ... - Page 36 b) Phasor verification: The phasor diagram shows a technical visualization of the current and voltage phasors, using a counter-clockwise rotation, independent of the real sense of rotation. The colors of the phasors may differ from the colors shown below. The diagram is always built basing on the voltage of the reference channel (direction 3 o’clock) Correct installation (expectation) •...
-
Page 37: Measurement Data Reset
7.3 Measurement data reset The device can store data of up to 20 measurement locations. If measurement locations are replaced, i.e. new configurations are loaded into the device, data belonging to the old configurationen can no longer be evaluated correctly and should therefore be deleted. However, data cannot be deleted for individual configurations, only as a whole. -
Page 38: Start / Stop Data Recording
7.4 Start / stop data recording The data recording can be started or stopped directly at the device or via the device website. There is a delay when starting and stopping data recording until this state change completes. During this delay the local LED associated to the RECORD button flashes and a corresponding status window is displayed via device website. -
Page 39: Evaluation Of Recorded Data
8. Evaluation of recorded data For the evaluation of recorded data, you first have to activate the configuration used during data recording. Only data recorded with the active configuration will then be visible and can be assessed. ATTENTION: If the configuration used during data recording has been changed or is no longer available, an evaluation of the data may no longer be possible. -
Page 40: Periodical Data
Data export as CSV file In some data visualizations an export as CSV file (Comma Separated Value) can be made. For time-sequences of measurements (e.g. meter contents) the time range of the data to export can be selected. For event lists the last 250 events are stored. -
Page 41: Pq Events
Displaying the chronology of meter contents Meter readings are available via the menu Energy Meter content readings in table form 8.1.2 PQ events Power quality events are entered in the PQ event list with time of occurrence, event duration and further characteristical values (such as the remaining voltage). - Page 42 Graphical display of a PQ event (half-cycle values) Current module may be selected (for PQ5000MOBCLM only) By selecting a time range via left mouse key, the graphical event display may be zoomed. Zoomed PQ event Remark: For the PQ5000MOBCL currents values are not available PM 1002825 000 01 System handbook PQ5000MOBCL-CLM 42/66...
- Page 43 The recorded data in the mains signalling area allow checking, if the magnitude of the ripple control signal at the receiver complies with the expectations and if the pulse sequences arrive correctly. Recognized sequence on the ripple control frequency PM 1002825 000 01 System handbook PQ5000MOBCL-CLM 43/66...
-
Page 44: Pq Statistic
8.1.3 PQ statistic Via the menu PQ statistic all recorded power quality data can be visualized and assessed. • PQ statistic overview of the monitored criteria (4.4.2) Daily trends of the recorded PQ variables • • PQ-Easy compliance report PQ statistic overview The overview is loaded and displayed for the duration of the selected survey period, applying the selected standard. - Page 45 Daily trends of monitored PQ variables For all recorded PQ variables details can be displayed on daily basis. As far as the selected standard defines limits for the visualized quantity, these will be inserted in the graphic. Some examples are shown below: Voltage harmonics For each phase and each...
-
Page 46: Pq-Easy Compliance Report
8.1.4 PQ-Easy compliance report a compliance report in PDF format can be created. 1. Select survey. Hint: Start and end time are reduced to 10-min intervals. 2. Start and end time may be modified in 10-min steps. 3. Select content of report (3 levels) 4. - Page 47 Example of a compliance report a) Overview b) Details c) Events PM 1002825 000 01 System handbook PQ5000MOBCL-CLM 47/66...
-
Page 48: Measurement Information In File Form
8.2 Measurement information in file form Measurement information can also be provided in file form. The data export scheduler is used for this purpose, with which various predefined tasks can be managed. The files can be generated periodically or event-driven and stored locally in the device and/or sent to an SFTP server. Managing and customizing tasks for providing files is done via the menu Data export | Data export scheduler in the settings menu. -
Page 49: Accessing File Information Via Webpage
Periodic PQDIF If this task is activated, the device periodically creates shortly after midnight PQDIF files and saves the file or files in a hierarchical time structure (year, month, day). By selecting a predefined task, the associated settings can be adapted. justed by selecting the entry. For example, for the task Periodic PQDIF you may choose whether the information should be stored in one file or in up to three files (statistics, histograms, events). -
Page 50: Download Of Pqis Files
The existing file structure is displayed in a new tab. All files are stored in a hierarchical time structure (year, month, day). By selecting the desired date and double-clicking on the appropriate file, a PQDIF may be easily downloaded. 8.2.3 Download of PQIS files The files stored in the device can be downloaded and then transferred to the PQIS software. -
Page 51: Periodical Sending To A Sftp Server
8.2.4 Periodical sending to a SFTP Server If in the data export scheduler the sending to an SFTP server was selected as action, the appropriate files will be sent periodically to the SFTP server defined in the settings of the communication. For improving security, you may select that the device connects to trusted hosts only. -
Page 52: Service, Maintenance And Disposal
9. Service, maintenance and disposal 9.1 Calibration and new adjustment Each device is adjusted and checked before delivery. The condition as supplied to the customer is measured and stored in electronic form. The uncertainty of measurement devices may be altered during normal operation if, for example, the specified ambient conditions are not met. -
Page 53: Technical Data
10. Technical data Measurement inputs Voltage base unit Nominal voltage: 57,7…400 V (UL: 347 V ), 100...693 V (UL: 600 V Range maximum: 520 V , 900 V (sinusoidal) Measurement category: 600V CAT III Uncertainty: ± 0,1% Consumption: ≤ U / 1,54 MΩ... - Page 54 Power Quality Type of device: (IEC 62586-1) PQI-A FI1: Power Quality Instrument – Class A; Fixed installation; Indoor environment with uncontrolled temperature variations (1) Measurement cycle: 10 cycles at 50Hz, approx. 200ms Flagging concept: Multiphase approach in accordance with IEC 61000-4-30 Certification: According to IEC62586-2 (standard for verifying compliance with IEC 61000-4-30) Certification body:...
- Page 55 Internal clock (RTC) Uncertainty: ± 2 minutes / month (15 up to 30°C) Synchronization: none, via Ethernet (NTP protocol) or Running reserve: > 10 years Time synchronization via NTP or GPS is an elementary requirement for class A power quality measuring devices. Only with a correct time reference is it possible to evaluate the power quality and analyze disruptions in the network.
- Page 56 • Consult the dealer or an experienced radio/T.V. technician for help. Camille Bauer Metrawatt AG is not responsible for any radio television interference caused by unauthorized modifications of this equipment or the substitution or attachment of connecting cables and equipment other than those specified by Camille Bauer Metrawatt AG.
-
Page 57: Dimensional Drawings
11. Dimensional drawings L x B x H: 360 x 304 x 194 [mm] PM 1002825 000 01 System handbook PQ5000MOBCL-CLM 57/66... -
Page 58: Annex
Annex A Description of measured quantities Incoming / outgoing / inductive / capacitive The device provides information for all four quadrants. Quadrants are normally identified using the roman numbers I, II, III and IV, as shown in the adjacent graphic. Depending on whether the system is viewed from the producer or consumer side, the interpretation of the quadrants is changing: The energy built from the active power in the quadrants I+IV can... -
Page 59: A1 Basic Measurements
A1 Basic measurements The basic measured quantities are calculated each 200ms by determining an average over 10 cycles at 50Hz. Voltages of the base unit Measurement Voltage U Voltage U Voltage U Voltage U Voltage U Voltage U Voltage U Phase angle between U1 and U2 Phase angle between U2 and U3 Phase angle between U3 and U1... -
Page 60: A2 Harmonics And Interharmonics
A2 Harmonics and interharmonics The harmonic analysis is performed according IEC 61000-4-7 over 10 cycles at 50Hz. The calculations are carried out for all voltages of the base unit and the currents of ... • a selectable reference channel (for PQ5000MOBCL) •... -
Page 61: A3 System Imbalance
A3 System imbalance Voltages of the base unit Measurement Positive sequence UR1 Negative sequence UR2 Zero sequence U0 Imbalance UR2/UR1 Imbalance U0/UR1 In addition for each current module Measurement Positive sequence IR1 Negative sequence IR2 Zero sequence I0 Imbalance IR2/IR1 Imbalance I0/IR1 Imbalance in three-phase systems may occur due to single-phase loads, but also due to failures, such as e.g. -
Page 62: A4 Mean-Values
A4 Mean-values The mean value calculation is performed via integration of the measured instantaneous values over an averaging interval. Power mean-values The averaging interval of this group is configurable. The following mean-values will be provided for each feeder monitored via current module: Measurement Measurement Active power Σ... -
Page 63: A5 Meters
A5 Meters The subsequent listed meter values are available for each feeder monitored by a Current Module. Measurement Active energy I+IV Σ Active energy II+III Σ Reactive energy I+II Σ Reactive energy III+IV Σ Active energy I+IV Active energy I+IV Active energy I+IV Active energy II+III Active energy II+III... -
Page 64: B Network Settings In Windows
B Network settings in Windows Depending on the Windows version used network settings and network status are arranged differently. The below images are created using Windows 7. Display / change network settings Via control panel select Network and Sharing Center Via Status the active settings of the selected LAN interface can be displayed: PM 1002825 000 01 System handbook PQ5000MOBCL-CLM... - Page 65 For changing the settings of the LAN interface, display the settings of the selected LAN interface via Properties first: The setting Obtain IP address automatically indicates that the network settings are obtained from a DHCP server on the network. If the PC is connected directly to the measurement device or the network does not have a DHCP server, the network settings are undefined.
-
Page 66: Index
Index Mean-values ..........61 Meters ............62 System unbalance ........60 Commissioning.......... 34 Compliance report ........45 cosφ ............. 58, 61 NTP ............. 10 Device overview ........... 5 Dimensional drawing......... 56 PQ monitoring ..........23 PQ statistic ..........43 PQDIF ............47 PQ-Easy Report .........
Need help?
Do you have a question about the LINAX PQ5000MOBCLM and is the answer not in the manual?
Questions and answers