
Related Manuals for Camille Bauer PQA 7000


Summary of Contents for Camille Bauer PQA 7000
- Page 1 PQA 7000 USER MANUAL V2.6 www.camillebauer.com CAMILLE BAUER METRAWATT AG Aargauerstrasse 7 CH-5610 Wohlen, Switzerland +41 56 618 21 11 Page 1 of 78...
- Page 2 Page 2 of 78...
-
Page 3: Table Of Contents
Table of Contents Safety Information ......................5 General Safety ......................5 Battery Handling ...................... 7 Warranty ......................... 8 Recycling ........................ 8 CE Conformity ......................8 RoHS ........................8 Hardware ........................9 Voltage Inputs ......................10 Current Inputs ......................10 Additional Multi-Connector ..................12 Computer Interface....................12 Antenna and Battery indicator LED ................13 Fan .........................14... - Page 4 Measurement ......................30 3.5.1 FFT / Spectra ....................30 3.5.2 Oscilloscope ....................31 3.5.3 Vector Scope....................31 3.5.4 Table Panel .....................32 3.5.5 Multi-Chart ......................33 3.5.6 EN50160 Analyzer ..................34 3.5.7 Transient, Event and Disturbance Recorder ............36 3.5.8 Phase Measure Unit ..................47 3.5.9 Display of actual values ...................51 Data Analysis ......................52 3.6.1 Settings ......................53...
-
Page 5: Safety Information
1 Safety Information 1.1 General Safety − Carefully read this manual before using the instrument. − Use the instrument according to these instructions only. − Use the instruments only under environmental conditions described in the technical data. − Personnel assigned to use the instrument must have read this reference manual and fully understood the instructions herein. - Page 6 For working on equipment under voltage use the guidelines given in EN50110. Always follow the 5 golden safety rules: 1. Always switch off. Meaning that the electrical installation must be disconnected from live parts on all poles. Block all poles of the power source for every part of the operation. Switchgear of home or factory, low voltage switch mode, the power of the machine control switch should be cut off.
-
Page 7: Battery Handling
1.2 Battery Handling Lithium-Ion rechargeable batteries require routine maintenance and care in their use and handling. Do not leave batteries unused for extended periods of time, either in the product or in storage. When a battery has been unused for 3 months, check the charge status and charge or dispose of the battery as appropriate. -
Page 8: Warranty
1.3 Warranty The warranty for the instrument is 2 years – usual operating conditions preconditioned. 1.4 Recycling − This is an electronic instrument and must be recycled according to the WEEE – directive. Do not throw away. − More information see: http://ec.europa.eu/environment/waste/weee/index_en.htm −... -
Page 9: Hardware
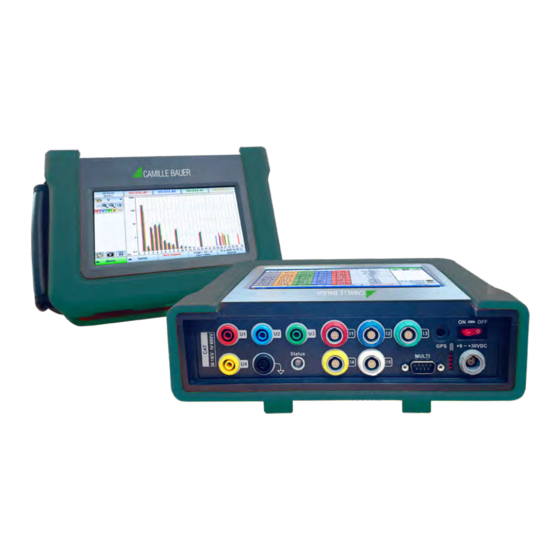
2 Hardware The PQA7000 is an All-in-one Power Quality Analyzer capturing Time-domain, frequency- domain data as well as Transients and Disturbances. Front View: Top View: The majority of connector pins for measurements are located on the top side and right side. The PQA7000 offers 5 banana plugs for voltage connection (L1, L2, L3, N and PE) and 5 connectors for current measurement. -
Page 10: Voltage Inputs
2.1 Voltage Inputs The device has banana connectors on its top side for measuring 4 Voltage input signals up to 1600V. All the channels are differential inputs and have a common isolation to GND. The voltage inputs supports DC and AC measurement. Please refer to the “Technical Reference Manual”... - Page 11 10pin LEMO connector Current sensors like Clamps, Rogowski-coils and other current sensors can be connected using the following pin assignment. PQA7000 Signal + Signal- / GND FGND Rogowski + TEDS n.c. n.c. +15V -15V Page 11 of 78...
-
Page 12: Additional Multi-Connector
2.3 Additional Multi-Connector DSUB-9 Female connector for additional input - Digital Input: The digital input is isolated and can measure up to +50 VDC with programmable Schmitt trigger levels. - CAN interface with selectable termination - RS485 interface Termination 120 Ohm, 5V, 1.2k Pullup,Pulldown resistor Description Signal RS-485_0B... -
Page 13: Antenna And Battery Indicator Led
2 x USB 3.0 USB 2.0 Signal Signal Data- Data- Data+ Data+ SSRX- SSRX+ 1 GB LAN GND Drain SSTX- Signal BI_DA+ SSTX+ BI_DA- BI_DB+ BI_DC+ BI_DC- BI_DB- BI_DD+ BI_DD- 2.5 Antenna and Battery indicator LED The SMA jack connector is prepared for external GPS antennas having a SMA plug type connector, and supports passive and active antennas. -
Page 14: Fan
2.6 Fan The fans for internal heat control are located on the side. The speed of the fans is controlled depending on the internal temperature. Additionally, metal mesh filters out the external dust particles. 2.7 Status LED The status LED is located on the upper right side of the upper plate. LED Status Description Standby for measurement... -
Page 15: Specifications
2.8 Specifications PQA7000 (48ksps) Voltage 5 (LEMO) Current ±1600Vp MAX Voltage ±800Vp MAX Clamp ±2Vp MAX Input Range Rogowski ±2Vp MAX Current Direct Current external sensor DC Accuracy ±0.05%FS ±0.05%FS Voltage 1, 2 Clamp Gain Current Rogowski 1,2,5,10 Integrator@50Hz 1,10 Gain Linearity 10ppm (MAX) Gain Drift Range... -
Page 16: Accessories
Isolation Type CH-GND 3kVp Isolation Schematic Buffer Input, 1MΩ Input Impedance Positive Trigger Voltage Adjustable 0~50V (CH1~2) Negative Trigger Voltage Adjustable 0~50V (CH1~2) Trigger Resolution 12mV EXT Power for DI 12V, Not Isolated Isolation Type CH-GND Termination Resistor None, 100Ω Selectable Isolation Type CH-GND RS485... -
Page 17: Software
3 Software The measurement software is included with the device, while additional report and management software can be installed as it may be necessary. For further information, we would like to refer to the software manual. 3.1 Start Measurement Software After turning on the instrument, the Software will automatically be started. -
Page 18: Quick Start With A Simple Setup
3.2 Quick Start with a simple setup 3.2.1 Fundamental Frequency Setup The Fundamental frequency is set in the Setup Processing panel. You can whether navigate there via “Setup” - “Processing” or via the “Summary Panel. The Summary panel shows the current setup values of the device and is the easiest way to configure the instrument for your application. -
Page 19: Basic Wiring Setup
Select a fundamental frequency (1). After selecting the fundamental frequency, click the 'Apply' button (2). 3.2.2 Basic Wiring Setup To select a wiring type, click ‘Wiring’ button in Summary panel (1). Alternative Navigation: “Setup” – “Input” Page 19 of 78... - Page 20 The following picture shows the ‘Setup Input’ panel for the wiring setup. The Setup Input panel allows changing the input wiring, input ranges, sensors and scale factors. − By changing any of these parameters the measurement is restarted. − If data is currently stored, the change of these settings is disabled. −...
- Page 21 STAR (Y) Connection Select '3xUph + 3xl' in the wiring setup and connect the cables according to the picture below. Page 21 of 78...
- Page 22 STAR (Y) + N-PE Connection Select '3xUph + 3xl + N' in the wiring setup and connect the cables according to the picture below. Page 22 of 78...
- Page 23 Delta Connection Select '3xUline + 3xl ' in the wiring setup and connect the cables like below picture. Page 23 of 78...
- Page 24 Single Phase Connection Select ‘1xUph + 1xl' in the wiring setup and connect the cables like below picture. Page 24 of 78...
-
Page 25: Main Menu
3.3 Main Menu 3.3.1 Defining user and project name Navigation: “Setup” – “Profile” The Setup Profile panel allows to change the profile of the instrument. − PROFILE: All instrument’s settings and setups are stored into a profile. The user can choose to create multiple profiles with different settings. -
Page 26: Data Storage
3.4 Data Storage 3.4.1 Store Data Panel Navigation: “Store” – “Time Series” The Store Data panel allows to configure the storing of calculated data. It can be set to store periodic time series data, Power Quality data and digital inputs data independently. •... - Page 27 How to setup storing − Insert measurement name, description and place (2) − Set storing interval and multiplier (3,4). Interval can be selected from 200ms up to 2 hours − Select quantity groups that you want to store (5). Power Quality data storing and digital inputs can be configured in separated tabs.
- Page 28 Page 28 of 78...
-
Page 29: Store Events/Transients Panel
3.4.2 Store Events/Transients Panel Navigation: “Store” – “Events” The Store Events panel allows configuring storing options for capturing events. − The configuration for storing alarms, transients, disturbances and voltage signals can be done independently. − EN50160 events are stored automatically, if EN50160 time series storing is enabled. −... -
Page 30: Measurement
3.5 Measurement 3.5.1 FFT / Spectra Navigation: “Advanced” – “Spectra” The Spectra panel displays FFT harmonic analysis either of voltage, current, active power, reactive power or apparent power. There are four different options for visualisation: Harmonics Interharmonics Higher Frequenciese in 200Hz bands up to 9 kHz Supraharmonics in 2kHz bands up to 68kHz 1. -
Page 31: Oscilloscope
3.5.2 Oscilloscope Navigation: “Advanced” – “Scope” The Scope panel displays one period of voltage and current on all phases or instant active power p(t). The Graph can be zoomed. 1) Selection of Parameters for Scope View (Voltage, Current, Instant Power) 2) Enable/Disable Phase 1-3 and Neutral 3) Selection of Number of Periods (1 period or 5 periods) 4) Zoom Functions for X and Y axis... - Page 32 1. Displayed vectors – both or voltage only or current only 2. Selected harmonic – clicking on this button will open keyboard to insert harmonic number 3. Vector diagram 4. Additional instant values of selected harmonic 5. Selection of Delta or Star values 6.
-
Page 33: Multi-Chart
1. Select basic quantity 2. Select derived quantity 3. Select Min/Avg/Max 4. Click Add or Update button to add or change selected quantity 5. Selected quantities list 6. Name of selected quantity 7. Click OK button to apply changes 8. Click Cancel button to cancel 3.5.5 Multi-Chart Navigation: “Advanced”... -
Page 34: En50160 Analyzer
3.5.6 EN50160 Analyzer Navigation: “Advanced” – “EN50160” The EN50160 panel shows Power Quality evaluation according to EN50160 standard. − It is possible to switch between the evaluation of all data and evaluation of not flagged data (data when no voltage event occurred). −... - Page 35 1. Table with count of voltage events distributed by length and level 1. Table with count of rapid voltage changes distributed by length and level 1. Table with rapid voltage changes statistics Page 35 of 78...
-
Page 36: Transient, Event And Disturbance Recorder
3.5.7 Transient, Event and Disturbance Recorder 3.5.7.1 Event Definition Navigation: “Events” – “Definition” There are different types available. The following table gives an overview about event type and recording type Type Recording Event list of all EN50160 limit violations EN50160 Event list of defined alarms Alarms Event list of harmonic voltage limit... - Page 37 EN50160 Events Voltage events according EN50160 can only be enabled/disabled and not configured, the configuration EN50160 events possible EN50160 setup panel. Navigation Menu Setup EN50160 Events → → → For the Voltage Limits the limits for flagging the data, Swell & Dip Limit, Interruption Limit and the hysteresis can be defined.
- Page 38 Alarms Navigation: “Events” – “Definition” – “Alarms” These events are generated if specific value crosses defined limits and can be logged (if storing of alarms is enabled). Alarms can be configured for different quantities and different evaluation times according to next picture (Alarms definition sub panel): 1.
- Page 39 1. List of voltage harmonics 2. Voltage harmonics limits Voltage Signaling Navigation: “Events” – “Definition” – “Voltage Signalling” Voltage Signaling is used for the remote control of specific devices by a signal superimposed on the fundamental frequency. − These events can be measured, and if the storing is enabled, the binary signal (telegram) which is transported by this signaling is stored.
- Page 40 Transients Navigation: “Events” – “Definition” – “Transients” Transients are stored in full sampling rate (sampling rate defined in “Setup”-“Processing”). − A transient event can occur if specified conditions are met. As a condition a specific quantity, their limits, hysteresis and type of hysteresis (level or time), phases and type of window (inside limits or outside limits) can be defined.
- Page 41 The following table shows the different trigger types and their calculation base. Type Time Base RMS (U, I) ½ Period RMS values Harmonic (U, I, THD, etc.) 200ms values (10/12 period-values) P, Q, S, PF, phi 200ms values (10/12 period-values) 1 period value Frequency Delta between period-values...
- Page 42 Page 42 of 78...
- Page 43 Detailed tabular overview of the individual trigger parameters: Description (for 50 Hz / for 60 Hz 12 periods) Condition Slope/steepness between samples – max value (both hi du/dt (V/s) or di/dt (A/s) & low) of Tw = 10 periods (200 ms) delta U or delta I Difference between two half-period RMS values U peak (V) or I peak (A)
- Page 44 Envelope Trigger Settings Example: The trigger setting is done in the measurement software under „Events“ → „Definition“ → „Transients“. As shown in the example, 30V refers to a 30V envelope symmetrically around the voltage signal. In the reporting software, the recorded trigger can be displayed under „Events“. Page 44 of 78...
- Page 45 Explanation time interval Disturbances Navigation: “Events” – “Definition” – “Disturbances.” These events are similar to Transients. Instead of waveforms the half-period values for voltage, current, phase angle, power, power factor, etc. are stored. Each Disturbance event will also trigger an Transient event. In that way any kind of disturbance can be detected. 1.
- Page 46 Digital Trigger Setup Navigation: “Events” – “Definition” – “Transients.” – “Digital Tigger” Advanced Table (can be used to check if DI is working) Page 46 of 78...
-
Page 47: Phase Measure Unit
3.5.7.2 Event Table Navigation: “Events” – “List” This panel shows a list of already captured events. It displays up to the last 1000 events - no matter if they were stored or not. Event list is scrolled automatically or can be scrolled manually. The Event table can be sorted by event time, type or phase. - Page 48 Page 48 of 78...
- Page 49 3.5.8.2 Configuration Navigation: “Menu” – “PMU” – “Setup” First the phasors need to be assigned to input channels of the instrument. Reported Phasor it can be defined which quantity is being provided – for each channel – e.g. „raw“ phasor, or positive, negative, zero component Phasor name user can edit quantity name Limits (low and high)
- Page 50 3.5.8.3 Connection Navigation: “Menu” – “PMU” – “Conn.” At general PMU settings the connection to the central PMU software (e.g. WAMS system) can be defined. PMU ID supposed to be unique identification number, one of the crucial parameters when connecting to PMU data stream PMU TCP port tcp port used to connect to PMU data stream (often 4712, but for network related reasons might be changed to another)
-
Page 51: Display Of Actual Values
3.5.9 Display of actual values Actual values info bar shows actual value of phase voltages or currents or active, reactive and apparent power. Switching between displayed values is done by clicking on actual values info area. By clicking on the top bar you can switch between the different data types. Page 51 of 78... -
Page 52: Data Analysis
3.6 Data Analysis In the Software Starter Screen you can select between “Report” and “Report New” tool. − The classical “Report” tool is available on the market for more than 15 years – well known from PNA hardware products. It covers all classical functionalities. All data of PNA instruments (PNA 561, PNA571) can be opened and analyzed. -
Page 53: Settings
Report New The graphical user interface of the new Report Tool was updated and optimized. In addition a couple of new features have been implemented. Simultaneous analysis of different kind of data is a new feature, as well as enhanced analysis and data visualizations functions. Another feature is the possibility to overlay data of different measurements. -
Page 54: Graphs / Time Series Data
3.6.2 Graphs / Time Series Data After selecting “Graphs” and pressing “Add Data” (1) button (see picture) the Channel selection menu will appear. Then select the System (2) and project (3). The treeview will enhance and show the different measurements. Select the measurement (4) on the left side and check the quantities you want to show/analyze on the right (5). - Page 55 Overview Data visualization panel − Selected Quantities (1) − By pressing on the green indication lamp you can enable/disable individual quantities or phases (2) for the Visualization − Configuration of Visualization (3) x-y axis (scaling, lin/log) interpolation type point style number of charts Cursors Zoom In/out Function...
- Page 56 Zoom In / Out and Cursors − A second cursor can be activate by pressing (1) − To Zoom In activate Zoom function by pressing (2) Now Zoom function is activated. Keep the left mouse button pressed and move over the selected area you want to zoom.
- Page 57 Multiple Charts To show data in multiple charts, first select the type of multi chart visualization (1). Up to four independent charts can be defined. There are three different options available Single chart Multiple charts among each other Multiple charts – 2 Charts in one row (see picture) After selecting the chart type, you can assign the quantities to the individual charts via dropdown selection (2).
- Page 58 THD from 200 Hz bands covering the range up to 9 kHz (Troubleshooting e.g. vessel, elevators, PV, EV, etc.): THD from 2 kHz band covering the range up to 150 kHz / 500 kHz (Troubleshooting e.g. vessel, elevators, PV, EV etc.): Page 58 of 78...
-
Page 59: Fft Data
3.6.3 FFT Data After selecting “FFT” you can add the channels in the same way as described for Graphs. 1) You can show the FFT data in multiple charts or all together in one 2) Axis scaling (linear, logarithmic, Auto, manual) 3) X-Axis in Harmonic orders or in Hertz (Hz) 4) Showing Min / Max Values 5) Horizontal lines... - Page 60 FFT Reference Curve Application: Evaluation according to IEC61000-2-2, -3-3, IEEE519, etc. For Harmonic FFT analysis it’s possible to add a reference curve to the visualization screen. When selecting the quantities (1), you can add the desired reference curve at “Limits” (2). The limits are shown as circles in the visualization: For different graphs, different limits can be selected.
- Page 61 MIN / MAX values For each harmonic the Min and Max Values can be shown in addtion. They will appear as colored rectangles: Recorder + FFT By pressing “Add data” and selection of time-series data you can add a recorder window to the FFT data.
- Page 62 Live FFT By choosing beside the FFT Data also a trend graph (like THD_U) the live FFT feature can be accessed. Once both are loaded the user can click on the live spectra button (marked red) and a cursor appears in the lower display. This cursor can be moved left and right to display the FFT at a certain time point.
- Page 63 FFT Limits When displaying FFT data limits can be added. Click on “Add Limits” (marked in red). This opens the Manage PQ limits window. In the first column the names of the limit files are displayed. With the lock symbol in the next column a limit can be associated with the FFT data.
-
Page 64: Events, Alarms, Transients, Disturbances
3.6.4 Events, Alarms, Transients, Disturbances For the presentation of events, transients, alarms and deletions, the "Event Panel" is available. After clicking on Events (1), the selection of the range (2) can be selected (3). It can also be combined with all Events. The list with all events is shown. - Page 65 • Zoom (1) • Time selection (2) • Axis (3) • Multi-Chart (4) In addition, other parameters can be taken into account like derivate of voltage or current or frequency, etc. This is possible via "Add" (5) and selection of parameters at "TRA" (6 + 7) Page 65 of 78...
-
Page 66: En50160
3.6.5 EN50160 This function allows the automatic evaluation according to EN50160 or other standards. 1) Select Limit and Percentile After selecting the datafile(s) for power quality evaluation the limit values and corresponding percentil can be selected or individually defined. Predefined templates are available for EN50160, IEC61000-2-2, IEC61000-2-4, IEEE519, FoL standards. - Page 67 Extended view It is possible to change the PQM table in the extended view mode. Therefore click on „table view“ → „extended“. This will allow you a more detailed analysis of the measurement data. Event list The following table shows the Event statistics and classifications. Depending on length and extrema of voltage events, the different events will be counted.
- Page 68 Event list All events are listed with phase information date and time. Rapid Voltage changes (RVCs) Rapid voltage changes are by depth and changes per hour. ITIC curve The ITIC curve is an additional visualization to show and classify events. The events will be shown in different colors as points, depending on phase.
- Page 69 PQM Overview By clicking on the red marked button the PQM overview can be opened. The PQ parameter are shown in relation to their limits. If one of them is above 110% of the limit it will be cut off. To show the full extent the area above the limit can be adjusted via the Scale Factor.
-
Page 70: Data Export Options
3.6.6 Data Export options There are several options to export data. Option 1: Export in Main tab This option allows to export data of one or multiple datafiles together with full storage rate for time series data respective full sampling rate for Transients. 1) Start “Export function”... -
Page 71: Automatic Report Generator
Option 3: Export only parts of recorded transients To display and export only 4 periods (approximately) of a transient recorded at 125kS/s, you can export the transient at full resolution since there is: 125000 ∗ 4 ∗ 0,02 = 10000 �������������� ����������������... - Page 72 1) Select one or more data files 2) Select one templates 3) Define time-frame 4) Press “Export PDF” Afterwards the report will be generated. A popup window will ask for having the report in one merged file or individual files for the different data files and data types. 5) The reports are stored in the folder defined at settings and can be opened by pressing (5).
- Page 73 3.6.7.2 How to create a new template After opening the report generator panel (PDF), you can add, change or remove templates: After adding a new template via “Add” you can define a name for the template in the popup window: The idea of creating templates follows a modular block system.
- Page 74 Example: Adding a XY-Chart for voltage and current on one page 1) Add new block 2) Select block for new page and press confirm (7) 3) Add new block (1) and select Graph XT 4) Select Voltage Urms 5) Select page style, legend off/on and line style 6) Phase selection 7) Confirm 8) Save...
-
Page 75: Data Analysis On Pc / Copy Data Of Instrument
3.6.8 Data Analysis on PC / Copy data of instrument All data can be analyzed on your personal computer. There are two options to copy the data: Option 1: Copy data folder to your PC For this option only the report tool needs to be installed on your PC. 1) Copy whether the data folder, where all measurements are stored, of your instrument, or the folder of the measurement to your PC 2) The easiest way is to copy the folder to the exact same path of the installation folder. - Page 76 Page 76 of 78...
-
Page 77: Maintenance And Care
4 Maintenance and Care Regular calibration The Instrument must be calibrated at regular intervals as determined by the accuracy requirements of the application. For most applications a one-year cycle is appropriate. Accuracy specifications are only guaranteed if adjustments are made at regular calibration intervals. - Page 78 When you are working with our products we want to provide you with the greatest possible benefits. If you need any support, we are her to assist you. sales@camillebauer.com www.camillebauer.com Camille Bauer Metrawatt AG Aargauerstrasse 7 CH-5610 Wohlen +41 56 618 21 11...
Need help?
Do you have a question about the PQA 7000 and is the answer not in the manual?
Questions and answers