Table of Contents
Advertisement
Quick Links
Advertisement
Table of Contents

Subscribe to Our Youtube Channel
Related Manuals for Four E's Scientific NanoC-2100


Summary of Contents for Four E's Scientific NanoC-2100
- Page 1 User Manual Micro volume Spectrophotometer Model: NanoC-2100 / Nano-2100...
- Page 2 Micro-volume UV-Vis Spectrophotometer The manufacturer reserves the right to modify this manual at any time Note: without notice. Patent materials are included in this manual. All rights reserved. Any part of this manual shall be forbidden to photocopy, reproduce, or translate into other languages, without written permission from manufacturer. Thanks for your selecting this kind of instrument.
- Page 3 Micro-volume UV-Vis Spectrophotometer Important Note 1. Conventions Please read it carefully, for there is important information in this column. Failure to follow the advice in this column will possibly result in damage to or the NOTE malfunctioning of the product. This symbol means that you should be cautious when performing an operation/procedure.
- Page 4 Micro-volume UV-Vis Spectrophotometer need to disconnect to the mains. 6) Pay attention to the placement of the instrument The instrument should be placed in a place where there is no corrosive gas or smoke, and there should be no strong light in the room, strong airflow or strong magnetic field interference. The workbench on which the instrument is placed should be level and stable.
- Page 5 Micro-volume UV-Vis Spectrophotometer 5 Warranty and service information Warranty content Since the date of acceptance, the whole machine warranted for 12 months. Warranty limitations The above warranty is not applicable to defective devices with incorrect use, abnormal operating conditions, improper application, and unauthorized maintenance or alteration. After the warranty comes due, manufacturer reserves the right to charge cost price for maintenance of a defective device and all related service charges.
-
Page 6: Table Of Contents
Micro-volume UV-Vis Spectrophotometer CONTENTS 1. Instrument Introduction ........................1 2. Instrument Specifications and Operation notes ................3 2.1 Instrument Specifications ....................... 3 2.2 Cable Connections ......................... 4 2.3 Pedestal mode ........................4 2.3.1 Pedestal Measurements ....................4 2.3.2 Pedestal Sample Volume Requirements ..............5 2.3.3 Basic Use of the pedestal .................... - Page 7 Micro-volume UV-Vis Spectrophotometer 5.5.2 Oligo DNA Concentration Calculation ............... 25 5.5.3 Oligo DNA Concentration Measurement ..............26 5.6 Oligo RNA ..........................27 5.6.1 Overview ........................27 5.6.2 Oligo RNA Concentration Calculation ............... 27 5.6.3 Oligo RNA Concentration Measurement ..............27 5.7 Custom ..........................
- Page 8 Micro-volume UV-Vis Spectrophotometer 8.4 The pedestal motor is abnormal ..................50 8.5 The pedestal motor is blocked ..................... 50 8.6 The pedestal channel was not found ................... 50 8.7 The cuvette channel was not found ..................50 8.8 Communication failed ......................50 8.9 The operation timeout ......................
-
Page 9: Instrument Introduction
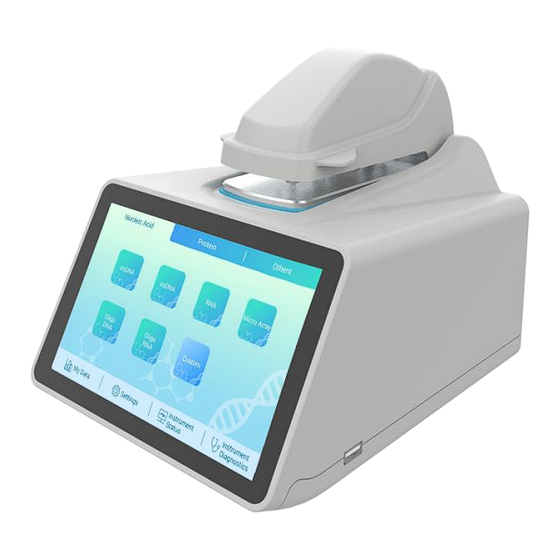
Micro-volume UV-Vis Spectrophotometer 1. Instrument Introduction Nano[C] -2100 is a micro-volume UV-Vis Spectrophotometer for measuring the absorbance of fixed wavelength. It accesses both Pedestal (as position 1 shown in Picture 1-1) measurement for small volume sample and the traditional Cuvette (as position 2 shown in Picture 1-1) measurement. In pedestal measurement, NanoReady Touch can measure 0.5-2μL samples with high accuracy and reproducibility. - Page 10 Micro-volume UV-Vis Spectrophotometer Picture 1-2 Picture 1-3...
-
Page 11: Instrument Specifications And Operation Notes
Micro-volume UV-Vis Spectrophotometer 2. Instrument Specifications and Operation notes 2.1 Instrument Specifications Table 2.1 Instrument Specifications Item NanoC-2100 Nano-2100 Detector Type 2048-element linear CCD array Minimum Sample volume (μl) Light pathlength (mm) 0.03,0.05,0.1,0.2, 1.0 auto-ranging Default 230/260/280/600 Wavelength range (nm) -
Page 12: Cable Connections
Micro-volume UV-Vis Spectrophotometer 2.2 Cable Connections Power adapter port Anti-collision Positioning post Power on switch USB port Picture 2-1 Picture 2-2 As shown in Picture 2-1, before the instrument power switch is turned on, open the flip cover and remove the anti-collision pad, then gently lower the flip cover. -
Page 13: Pedestal Sample Volume Requirements
Micro-volume UV-Vis Spectrophotometer then brought down into the contact with the liquid sample causing the liquid to the column between the gaps of the ends of the two fibers. A pulsed xenon flash lamp provides the light source and a spectrometer utilizing a linear CCD array analyzes the light passing through the sample column. -
Page 14: Cuvette Mode
Micro-volume UV-Vis Spectrophotometer 4 pedestal on the lid 3 lid 2 Display 1 pedestal Picture 2-4 2.4 Cuvette mode 2.4.1 Cuvette Measurements The NanoReady accepts 10,5,2,1 mm cuvettes 45 to 48 mm. When measuring samples using micro, semi-micro, or ultra-micro cuvettes, we recommend using opaque cuvettes. The opaque cuvettes ensure that all lights hitting the detector has passed through the sample. -
Page 15: Blank And Absorbance Calculations
Micro-volume UV-Vis Spectrophotometer surface (as shown in Picture 2-5) should correspond to the direction of the light path on the instrument (as arrow direction shown in Picture 2-6). Translucent surface Picture 2-5 Picture 2-6 The lid must be lowered during the cuvette measurements. Click the “Settings”... -
Page 16: Dye Editor
Micro-volume UV-Vis Spectrophotometer instrument is working well and that no sample residue on the pedestal. To run a blanking cycle, perform the following: 1. Click “dsDNA” on the “nucleic acid” interface of the main to enter the measurement interface. Add 2ul of pure water to the pedestal with a pipette, put down the lid, click “Blank”... -
Page 17: Software
Micro-volume UV-Vis Spectrophotometer 3 Software 3.1 Software Upgrade 1. The software is upgraded through the USB flash drive. You need to create a folder “MUVT_FILES” under the root directory of the USB flash drive. Create a folder “MUVT_UPDATE” under the MUVT_FILES folder, and put the upgrade file "MUVT.bin"... -
Page 18: Measurement Page
Micro-volume UV-Vis Spectrophotometer Picture 3-2 3.2.1 Measurement Page Select the nucleic acid, protein or others from the top, the middle window displays the subcategory, and click any category to enter the measurement page, as shown in Picture 3-3. It mainly includes menus, status bars, data windows, and function buttons. - Page 19 Micro-volume UV-Vis Spectrophotometer Picture 3-4 2.Status Bar As shown in Picture 3-5, the status bar corresponds to the measurement name, measurement type, and current measurement times from left to right. 1)Measurement name: Located at the far left of the top status bar, it is used to display the name of the measurement when editing a single measurement, which can be edited.
- Page 20 Micro-volume UV-Vis Spectrophotometer Picture 3-6 1) Sample details: As shown in Figure 3-7, the details of the test data are listed in tabular form. Picture 3-7 2) List of measure results: As shown in Picture 3-8, after the measurement is completed, the measurement result list is displayed on the right side of the data area.
-
Page 21: Parameter Settings
Micro-volume UV-Vis Spectrophotometer 3) Details list: As shown in Picture 3-9, The correlation coefficient of some test items is fixed and cannot be changed. The parameter setting More is gray and cannot be clicked. When the More font is not gray and underlined, you can click “More” to enter the parameter settings, as shown in Figure 3-10. -
Page 22: Software Measurement Example
Micro-volume UV-Vis Spectrophotometer Picture 3-12 2) Sample type: Set the sample type corresponding to the test ; 3) Dyes: Users can choose the preset dyes, or use the dye editing function to add new dyes. 4) Absorbance Correction: The user-defined absorbance correction input is used to display the absorbance correction of the spectrogram by subtracting the absorbance correction value from the absorbance at all wavelengths in the sample spectrum. - Page 23 Micro-volume UV-Vis Spectrophotometer Picture 3-14 4. Data save After the measurement is completed, click the “Save” icon to pop up the window, enter the data name and click OK.
-
Page 24: Application
Micro-volume UV-Vis Spectrophotometer 4 Application 4.1 Overview This product can be easily used for UV-visible spectroscopic measurement using a small amount of sample: 1. The concentration of nucleic acid at a concentration of less than 27500 ng/μl (dsDNA, ssDNA, RNA) can be measured without dilution 2. -
Page 25: Instrument Function
Micro-volume UV-Vis Spectrophotometer 5 Instrument function 5.1 dsDNA 5.1.1 Overview This product can be used to easily measure the concentration and quality of dsDNA. To measure dsDNA, select the dsDNA function on the main page. See picture 5-1 Picture 5-1 5.1.2 dsDNA Concentration Calculation For nucleic acid concentration, the Beer-Lambert equation is used: C = (A ∗... -
Page 26: Nucleic Acid Concentration Measurement
Micro-volume UV-Vis Spectrophotometer Measurement type —Whether the measurement is a cuvette mode or a pedestal mode Creation time — The system time at which the test was performed. A230 (10mm pathlength) — Shows the absorbance at 230nm in the 10mm pathlength. A260 (10mm pathlength) —... -
Page 27: Ssdna
Micro-volume UV-Vis Spectrophotometer 5.2 ssDNA 5.2.1 Overview The instrument can be used to easily measure the concentration and quality of ssDNA. To measure ssDNA, select the ssDNA function on the main page. See picture 5-2 Picture 5-2 5.2.2 ssDNA Concentration Calculation For ssDNA concentration, the Beer-Lambert equation is used: C = (A ∗... -
Page 28: Nucleic Acid Concentration Measurement
Micro-volume UV-Vis Spectrophotometer Measurement type —— Whether the measurement is a cuvette or a pedestal. Creation time —— The system time at which the test was performed. A230 (10mm pathlength) — Shows the absorbance at 230nm in the 10mm pathlength. A260 (10mm pathlength) ——... -
Page 29: Rna
Micro-volume UV-Vis Spectrophotometer 5.3 RNA 5.3.1 Overview The instrument can be used to easily measure the concentration and quality of RNA. To measure ssDNA, select the RNA function on the main page. 5.3.2 RNA Concentration Calculation For RNA concentration, the Beer-Lambert equation is used: C = (A ∗... - Page 30 Micro-volume UV-Vis Spectrophotometer 2. The RNA extinction coefficient is 40 3. Select the concentration unit, the default is ng/μl. 4. Wipe the upper and lower pedestals with dry airlaid paper and use a suitable liquid to create a blank control that will dissolve the target solution. The pH and ion concentration of the blank control liquid should be the same as the measurement sample.
-
Page 31: Micro Array
Micro-volume UV-Vis Spectrophotometer 5.4 Micro Array 5.4.1 Overview Quantitative analysis of nucleic acids that have been labeled to use up to two fluorescent dyes is performed using a Micro Array application. The application reports nucleic acid concentration, A260/A280 ratio and concentration, and measured dye absorbance values, allowing measurement of dye concentrations as low as 0.2 picomoles per microliter. -
Page 32: Micro Array Measurement
Micro-volume UV-Vis Spectrophotometer 5.4.4 Micro Array Measurement 1. On the Home page, select the Nucleic Acid and click 2. Click "More" to start the parameter setting. 3. Select the type of sample to measure. The default setting is ssDNA and the extinction coefficient is 4. -
Page 33: Oligo Dna
Micro-volume UV-Vis Spectrophotometer 5.5 Oligo DNA 5.5.1 Overview The concentration and quality of Oligo DNA can be easily measured using this instrument. To measure Oligo DNA, select the Oligo DNA function on the main page. As shown in Picture 5-3. Picture 5-3 5.5.2 Oligo DNA Concentration Calculation For Oligo DNA concentration, the Beer-Lambert equation is used:... -
Page 34: Oligo Dna Concentration Measurement
Micro-volume UV-Vis Spectrophotometer A230 (10mm pathlength) —— Shows the absorbance at 230nm in the 10mm pathlength. A260 (10mm pathlength) —— Shows the absorbance at 260nm in the 10mm pathlength. A280 (10 mm pathlength) —— Shows the absorbance at 280 nm in the 10 mm pathlength. 260/280 ——... -
Page 35: Oligo Rna
Micro-volume UV-Vis Spectrophotometer 5.6 Oligo RNA 5.6.1 Overview The concentration and quality of Oligo RNA can be easily measured using this instrument. To measure Oligo DNA, select the Oligo RNA function on the main page. 5.6.2 Oligo RNA Concentration Calculation For Oligo RNA concentration, the Beer-Lambert equation is used: C = (A ∗... - Page 36 Micro-volume UV-Vis Spectrophotometer 1. On the Home page, select the Nucleic Acid and click Oligo RNA. 2. Click "More" to enter the parameter setting.The extinction coefficient is manually entered. 3. Select the concentration unit, the default is ng/μl. 4. Wipe the upper and lower pedestals with dry airlaid paper and use a suitable liquid to create a blank control that will dissolve the target solution.
-
Page 37: Custom
Micro-volume UV-Vis Spectrophotometer 5.7 Custom 5.7.1 Overview The instrument can be used to easily measure the concentration and quality of custom nucleic acids. To measure custom nucleic acids, select Custom on the main. Custom measurement can show the absorbance of samples from 220 to 350 nm. The custom function measures the nucleic acid concentration with a custom extinction coefficient. -
Page 38: Custom Nucleic Acid Concentration Measurement
Micro-volume UV-Vis Spectrophotometer 5.7.3 Custom Nucleic Acid Concentration Measurement 1. On the Home page, select the Nucleic Acid and click custom. 2. Click "More" to enter the parameter setting.The extinction coefficient is manually entered. 3. Select the concentration unit, the default is ng/μl. 4. -
Page 39: Protein A280
Micro-volume UV-Vis Spectrophotometer 5.8 Protein A280 5.8.1 Overview Proteins are highly diverse, and the A280 function is mainly used to measure pure proteins containing Trp, Tyr residues or Cys-Cys disulfide bonds, which have higher absorbance at 280 nm. As shown in Picture 5-4. -
Page 40: Protein A280 Measurement
Micro-volume UV-Vis Spectrophotometer Table 5-1 Protein A280 measurement type option 1Abs=1mg/ml The absorbance of 1 mg/ml protein at 280 nm was 1 A. The protein concentration was calculated using the mass extinction coefficient with reference to calf serum albumin: a mass extinction coefficient of 6.7 at 280 nm for the protein of 10 mg/ml. -
Page 41: Protein&Labels
Micro-volume UV-Vis Spectrophotometer 5.9 Protein&labels 5.9.1 Overview Protein&labels applications are used to quantitatively analyze proteins and fluorescent dyes for protein conjugate arrays, as well as metalloproteins such as hemoglobin, using wavelength ratios. This application reports the protein concentration measured at 280 nm and the measured dye absorbance value, allowing measurement of dye concentrations as low as 0.2 picomoles per microliter. - Page 42 Micro-volume UV-Vis Spectrophotometer 6. Wipe the upper and lower pedestals with dry airlaid paper and use a suitable liquid to create a blank control that will dissolve the target solution. The pH and ion concentration of the blank control liquid should be the same as the measurement sample.
-
Page 43: Od600
Micro-volume UV-Vis Spectrophotometer 5.10 OD600 5.10.1 Overview The cell test uses a spectrophotometer to measure the scattered light transmitted through the cell suspension to obtain a corresponding absorbance value. For this instrument, the biggest difference between pedestal measurement and cuvette measurement is that the optical path is different. The growth rate of bacterial or other microbial cell cultures was measured using an OD600 application by detecting the absorbance of the cell growth culture at 600 nm. -
Page 44: Perform Od600 Concentration Measurement
Micro-volume UV-Vis Spectrophotometer Creation time - the system time at which the test was performed. Absorbance Correction - The user can customize the baseline value, adjusted by input data, with the absorbance value between 0 and 300 A, and the absorbance correction value will be subtracted from the absorbance at all wavelengths in the sample spectrum. -
Page 45: Kinetic
Micro-volume UV-Vis Spectrophotometer 5.11 Kinetic 5.11.1 Overview It can be used to compare the samples in the cuvette for kinetic measurement. Up to 3 wavelengths between 190 nm and 850 nm can be specified for user-defined intervals for continuous absorbance measurement in up to 5 stages. - Page 46 Micro-volume UV-Vis Spectrophotometer Picture 5-7 3. Choose a method: Click on the method name in the left box and select an existing method. Create a new method by clicking "Create", specifying the method settings and selecting the save method Edit an existing method by clicking on the method name and selecting "Edit" Delete an existing method by clicking on the method name and selecting "Delete"...
-
Page 47: Create A Kinetic Method
Micro-volume UV-Vis Spectrophotometer Picture 5-8 5.11.4 Create a Kinetic method 1. Select “Others” on the Main interface and click on Kinetic. 2. Create a new method by clicking on "Create", specifying the method settings and selecting the save method. 3. Enter the method name, and specify up to three measurement wavelengths. 4. - Page 48 Micro-volume UV-Vis Spectrophotometer Picture 5-10 Select the number of stages and time units (minutes and seconds) Specify the number of intervals, interval time, and delay between stages for each stage. The colored lines and boxes on the right clearly indicate the specific stage. The colored lines represent the start and end times of each stage, and the colored boxes correspond to the specific delays and measurements for each stage.
-
Page 49: My Data And Settings
Micro-volume UV-Vis Spectrophotometer 6. My data and settings 6.1 My data 6.1.1 Introduction Used to view saved experimental data. A list of experiments matching the current search criteria settings is displayed on the screen as shown in Picture 6-1. Search conditions include measure time range, measure type. - Page 50 Micro-volume UV-Vis Spectrophotometer Picture 6-3 The search criteria include the following: Measure time range - the time of the experiment, there are "last 1 day", "last 2 days", "last 1 week", "last 2 weeks", "last 1 month", "last 2 months" , " last 6 months" seven time range options. Measure type - Used to filter to view the specified measure type, only the selected measure types will be displayed after selection.
-
Page 51: Settings
Micro-volume UV-Vis Spectrophotometer 6.2 Settings On the Main interface, Click Settings, or click or select settings in any test. The instrument settings are divided into four modules: system settings, general settings, dye editor and protein editor. 6.2.1 System settings Picture 6-5 Includes the following: Brightness - adjust the brightness of the instrument touch screen Logo projection light - switch control of instrument logo projection light... -
Page 52: Dye Editor
Micro-volume UV-Vis Spectrophotometer Picture 6-6 Picture 6-7 6.2.3 Dye Editor User-defined dyes can be used with the dye editor. Add to the list of available dyes in the Micro Array Parameter Settings or Protein&labels Parameter Settings. You can also specify the available dyes in the list. If a dye is selected prior to measurement, a correction is applied to the measured sample absorbance value and the resulting sample concentration and purity ratio. -
Page 53: Protein Editor
Micro-volume UV-Vis Spectrophotometer Picture 6-8 The dye editor includes the following operations: Indicates default dyes (not editable or deleted) User-defined dyes (editable or deleteable) Add or remove dyes: To add or remove the Micro Array 1 parameter settings or the Protein&Label 2 parameter settings in the Dye 1 and Dye 2 drop-down lists, select or not select the checkbox of corresponding dyes. - Page 54 Micro-volume UV-Vis Spectrophotometer Picture 6-9 When use the Protein Editor, on the Main interface, click the Settings to enter the settings page and select the Protein Editor. The Protein Editor includes the following operations: 1) Add custom protein: Click the “Add Protein” button under the “Protein Editor” to automatically add a custom protein to the bottom.
-
Page 55: Diagnosis
Micro-volume UV-Vis Spectrophotometer 7 Diagnosis Spectral strength diagnosis, confirm whether the internal spectrometer is operating normally and calibrated; spectral diagnosis confirms whether the fiber movement is normal. 7.1 Spectral strength diagnosis Go to the instrument main page and click the “Instrument Diagnostics” button to enter the instrument diagnosis interface. -
Page 56: Cuvette Spectral Intensity Diagnosis
Micro-volume UV-Vis Spectrophotometer 7.1.2 Cuvette spectral intensity diagnosis 1.Click “Cuvette Spectral Intensity Diagnostics” on the “Instrument Diagnostics” interface to enter the related interface. 2. Don’t add any reagent to the cuvette cell. Click the measurement button on the screen. 3. After the test is completed, as shown in Picture 7-3. The green "light intensity is qualified" in the diagnosis column indicates that the cuvette spectral intensity is qualified at this wavelength. - Page 57 Micro-volume UV-Vis Spectrophotometer Picture 7-4 Spectral diagnosis needs to be done ten times. After ten measurements, the relevant data will Note: be automatically stored in the software to complete the spectrum diagnosis.
-
Page 58: Alarms And Tips
Micro-volume UV-Vis Spectrophotometer 8. Alarms and tips When the prompt message comes as below, please follow up the instruction of solution. 8.1 Experimental data is abnormal Solution: The lid is opened during the measuring. Wipe the pedestal and cuvette pool cleanly with an airlaid paper and measure again. - Page 59 Micro-volume UV-Vis Spectrophotometer 2. Contact the after-sales personnel. 8.13 Upgrade failed Solution: Restart the instrument and perform the upgrade operation again. 8.14 No U disk found Solution: Make sure that the USB flash drive is plugged into the USB port of the instrument, remove and insert the USB flash drive again, and confirm that the USB flash drive is plugged into the position well.
- Page 60 Micro-volume UV-Vis Spectrophotometer 9 Failures and troubleshooting If a fault occurs, check the cause of the fault according to the following table and take appropriate countermeasures to eliminate the fault. Table 9-1 Faults, reasons, and troubleshooting Faults Reasons Troubleshooting No response after Loose power plug Plug in the power plug well boot...
- Page 61 Micro-volume UV-Vis Spectrophotometer 10 Use and maintenance 10.1 Pedestal Maintenance 10.1.1 Sample Compatibility Instructions The pedestal of the micro volume UV-visible spectrophotometer is accessible to most solvents and solutions commonly used in life science laboratories, including methanol, ethanol, propanol, isopropanol, butanol, acetone, diethyl ether, chloroform, tetrachlorination.
Need help?
Do you have a question about the NanoC-2100 and is the answer not in the manual?
Questions and answers