Table of Contents
Advertisement
Quick Links
Advertisement
Table of Contents

Subscribe to Our Youtube Channel
Related Manuals for Four E's Scientific SPT-NanoF


Summary of Contents for Four E's Scientific SPT-NanoF
- Page 1 Operating Instructions SPT-NanoF/SPT-Nano Micro-volume Spectrophotometer...
-
Page 2: Table Of Contents
Contents 1. Safety Instructions 2. Product Overview - 2.1.Package Contents - 2.2.Instrument Structure - 2.3.Operating Conditions - 2.4.Specifications 3. General Operation - 3.1.Pedestal Mode 3.1.1.Pedestal Measurement 3.1.2.Pedestal Sample Volume Requirements 3.1.3.Basic Use of the Pedestal - 3.2 OD600 and Fluorometer Modules 3.2.1 OD600 Module 3.2.2 Fluorometer Module 4. - Page 3 Contents - 4.5.Fluorometer 4.5.1.Standard Curve 4.5.2.Sample Measurement - 4.6.OD600 - 4.7.Kinetics 4.7.1.Absorbance 4.7.2.Fluorescence - 4.8.System 4.8.1.Time 4.8.2.Language 4.8.3.Device Information 4.8.4.Brightness 4.8.5.Upgrade 4.8.6.Maintenance 5. Maintenance and Cleaning - 5.1.Pedestal Maintenance - 5.2.Machine Use and Maintenance 6. Warranty...
-
Page 4: Safety Instructions
1. Safety Instructions Carefully review this manual and adhere to the provided safety instructions and operational procedures. Neglecting to do so could lead to personal injury or device damage. If you have any questions or require assistance, don't hesitate to reach out to your local seller for technical support. -
Page 5: Product Overview
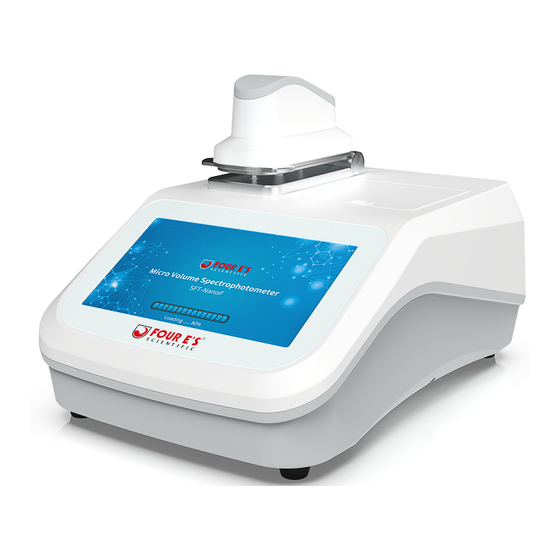
2. Product Overview The SPT-NanoF/SPT-Nano Micro volume spectrophotometers (UV-Vis), featuring a built-in 7-inch color touchscreen, can perform all detection functions without the need for connecting to an external computer. This device provides a comprehensive spectral range (190-800nm) for precise quantitative analysis of DNA, RNA, proteins, and more, and its user-friendly interface ensures straightforward operation. -
Page 6: Instrument Structure
2.2. Instrument Structure ① ② ③ ④ ⑤ ⑥ ⑦ ⑧ ① Upper pedestal arm ② Fluorometer (only for SPT-NanoF) ③ OD600 ④ Touch Screen ⑤ Power switch ⑥ 12V Power port ⑦ Printer (Recommended printing paper: 57mm[W], 30mm[Φ]) ⑧... -
Page 7: Operating Conditions
2.3. Operating Conditions ● Ambient temperature: 5°C~35°C ● Relative humidity: 20%~80% ● Position the device away from air vents and exhaust fans to minimize inadvertent sample evaporation. 2.4. Specifications SPT-NanoF SPT-Nano Model (built-in Fluorescence Detection) Wavelength range 190-800nm Minimum sample size 0.5~2μL... -
Page 8: General Operation
SPT-NanoF SPT-Nano (built-in Fluorescence Model Detection) OD600nm Measurement Cuvette Sample Holder Type 12.5x12.5x45mm; Z-Height: 8.5mm Cuvette Dimensions Light source 600±8nm Wavelength range 0~4A Absorbance range Fluorescence detection 0.5mL PCR Tube (with PCR Sample Holder Type Tube Holder for Cuvette Slot) -
Page 9: Pedestal Sample Volume Requirements
of the transmitted light through the sample is carried out using a state-of-the-art spectrometer equipped with a linear CMOS array. 3.1.2. Pedestal Sample Volume Requirements Although there is no strict requirement on the sample volume, it is essential that the amount is sufficient to form a liquid column between the upper and lower pedestal arm when performing pedestal measurement. -
Page 10: Od600 And Fluorometer Modules
3.2 OD600 and Fluorometer Modules Our SPT-NanoF features a covered compartment with two cuvette slots, one designated for the fluorometer module and the other for the OD600 module. The OD600 module is designed to be used directly with a cuvette, while for the fluorometer, we offer a specialized PCR tube holder that allows a 0.5mL PCR tube to fit into the cuvette slot. -
Page 11: Fluorometer Module
instrument. 3) Close the compartment lid and ensure it stays closed during measurement or blanking. 4) Tap the “OD600” icon on the home screen to enter the settings page. Set the corresponding parameters and start the blank measurement by tapping the “Blank” button. -
Page 12: Software Functions
6) Once the measurement is finished, remove the PCR tube and PCR tube holder to prepare for the next measurement. 4. Software Functions 4.1. Main Interface When the device starts, it will enter the home screen, which includes these commonly used modes: Nucleic Acids, Proteins, Colorimetry, Fluorometer, OD600, Kinetics and System. -
Page 13: Dsdna / Ssdna / Rna & Custom Factor
4.2.1. dsDNA / ssDNA / RNA & Custom Factor ● Sample Measurement: Before making a sample measurement, use a suitable buffer to make a blank control. The blank control liquid is the buffer that dissolves the analyte. The pH and ion concentration of the blank control liquid should be the same as the measurement sample. - Page 14 2) Select sample type, “dsDNA”, “RNA”, “ssDNA”, etc., or “Custom Factor”. Input the extinction coefficient if applicable. The default sample type is “dsDNA”. 3) If baseline correction is selected, the default calibration wavelength is 340nm. The user can enter a different calibration wavelength according to their specific measurement procedure.
- Page 15 9) The “Export” or “Print” buttons are used to export/print the current test data. (If multiple blank measurements have been performed, the sample measurement will be calculated based on the most recent blank measurement.) ● Test Result: Swipe left on the screen to access the “Test Result” page. Select the start date, end date, sample type and test no.
-
Page 16: Oligo
Export: Insert the USB disk drive into the USB port, select the test data and tap the “Export” button to export the test data. (Select “All” to export all test data.) Print: Ensure that the printing paper is properly loaded into the device. Select the test data and tap the “Print”... - Page 17 2) Tap the “Sample Settings” button, select sample type “Oligo DNA” or “Oligo RNA”, and select sample sequence by tapping A, T, C, G, U. Then tap the “OK” button to save all settings. 3) If baseline correction is selected, the default calibration wavelength is 340nm and the user can enter calibration wavelengths depending on the measurement.
- Page 18 7) Double tap the test result to view the measurement. 8) Wipe the upper and lower pedestal in preparation for the next measurement. (If multiple blank measurements have been performed, the sample measurement will be calculated based on the most recent blank measurement.) ●...
-
Page 19: Proteins
records. Double tap a record to view a detailed report and test curve. Export: Insert the USB disk drive into the USB port, select the test data and tap the “Export” button to export the test data. (Select “All” to export all test data.) Print: Ensure that the printing paper is properly loaded into the device. -
Page 20: Protein A280
4.3.1. Protein A280 Proteins, in contrast to nucleic acids, can exhibit considerable diversity. The Protein A280 method is applicable to purified proteins that contain Trp, Tyr residues or Cys-Cys disulfide bonds and exhibit absorbance at 280nm. This method does not require the generation of a standard curve. - Page 21 “BSA”. 3) If baseline correction is selected, the default calibration wavelength is 340nm and the user can enter calibration wavelengths depending on the measurement. 4) Open the upper pedestal arm, clean the upper and lower pedestal before measurement. Add a 1-2μl blank control sample to the pedestal. Then close the pedestal and tap the “Blank”...
- Page 22 ● Test Result: Swipe left on the screen to access the “Test Result” page. Select the start date, end date, sample type and test no. to filter through the testing records. Double tap a record to view a detailed report and test curve. Export: Insert the USB disk drive into the USB port, select the test data and tap the “Export”...
-
Page 23: Protein A205
data and tap the “Print” button to print. Delete: Select the data and tap the “Delete” button to delete. 4.3.2. Protein A205 The Protein A205 method monitors the absorbance of the peptide bond at 205 nm. Note: If the sample includes significant quantities of amino acids such as tryptophan and tyrosine, or if it contains cysteine-cysteine disulfide bonds, it is recommended to employ the Protein A280 method instead of Protein A205. - Page 24 Add a 1-2μl blank control sample to the pedestal. Then close the pedestal and tap the “Blank” button to start measurement. 5) When the blank measurement is complete, clean the upper and lower pedestal and add sample to measure. If the “Auto-mode” checkbox has been selected, the sample will be measured automatically as soon as the pedestal arm is lowered, eliminating the need to manually tap the “Measure”...
- Page 25 ● Test Result: Swipe left on the screen to access the “Test Result” page. Select the start date, end date, sample type and test no. to filter through the testing records. Double tap a record to view a detailed report and test curve. Export: Insert the USB disk drive into the USB port, select the test data and tap the “Export”...
-
Page 26: Colorimetry
data and tap the “Print” button to print. Delete: Select the data and tap the “Delete” button to delete. 4.4. Colorimetry 4.4.1. Standard Curve A standard curve is required before starting sample measurement. ● Measurement Steps:... - Page 27 Before making a sample measurement, use a suitable buffer to make a blank control. The blank control liquid is the buffer that dissolves the analyte. The pH and ion concentration of the blank control liquid should be the same as the measurement sample. 1) In the home screen, tap “Colorimetry”...
- Page 28 6) Clean the upper and lower pedestal and add sample to measure. If the “Auto-mode” checkbox has been selected, the sample will be measured automatically as soon as the pedestal arm is lowered, eliminating the need to manually tap the “Measure” button. 7) When the measurement is complete, the sampling curve will show the absorbance of the current sample on the left-hand side of the screen, and the test results are located on the right-hand side of the screen.
- Page 29 ● Standard Curve: 1) Swipe left on the screen to view standard curve. 2) Select the sample type and calibration no. to filter through the testing records. 3) Display: Select the curve type and tap the “Display” button. A curve is produced based on the curve type you have chosen.
- Page 30 ● Test Result: Swipe left on the screen to enter the test result page. Select the start date, end date, sample type and test no. to filter through the testing records. Double tap a record to view a detailed report and test curve. Export: Insert the USB disk drive into the USB port, select the test data and tap the “Export”...
-
Page 31: Sample Measurement
data and tap the “Print” button to print. Delete: Select the data and tap the “Delete” button to delete. 4.4.2. Sample Measurement ● Measurement Steps: Before making a sample measurement, use a suitable buffer to make a blank control. The blank control liquid is the buffer that dissolves the analyte. The pH and ion concentration of the blank control liquid should be the same as the measurement sample. - Page 32 5) When the blank measurement is complete, clean the upper and lower pedestal and add sample to measure. If the “Auto-mode” checkbox has been selected, the sample will be measured automatically as soon as the pedestal arm is lowered, eliminating the need to manually tap the “Measure”...
- Page 33 ● Test Result: Swipe left on the screen to enter the test result page. Select the start date, end date, sample type and test no. to filter through the testing records. Double tap a record to view a detailed report and test curve. Export: Insert the USB disk drive to the USB port, select the test data and tap the “Export”...
-
Page 34: Fluorometer
data and tap the “Print” button to print. Delete: Select the data and tap the “Delete” button to delete. 4.5. Fluorometer 4.5.1. Standard Curve A standard curve is required before starting fluorescence measurement. ● Measurement Steps:... - Page 35 1) When conducting tests, the system will automatically generate a test number, with the format being “year/month/day-serial number”. 2) Tap the “Settings” button to set the parameters. “Test Times” refers to the number of times each sample is tested, and the average values are used to build the standard curve.
- Page 36 ● Standard Curve: Swipe left on the screen to view standard curve. Select the sample type and calibration number to filter through the testing records. Display: select the curve type and tap the “Display” button. A curve is produced based on the curve type you have chosen.
-
Page 37: Sample Measurement
Swipe left on the screen to enter the test result page. Select the start date, end date, sample type and calibration no. to filter through the testing records. Double tap a record to view a detailed report and test curve. Export: Insert the USB disk drive to the USB port, select the test data and tap the “Export”... - Page 38 PCR tube holder into the Fluorometer detection slot. 5) Tap the “Measure” button to start measurement. 6) When the measurement is complete, check the current test data on the screen. 7) Remove the sample in preparation for the next measurement. ●...
-
Page 39: Od600
4.6. OD600 In the home screen, tap the “OD600” icon to enter the testing page. ● Sample Measurement: Before making a sample measurement, use a suitable buffer to make a blank control. The blank control liquid is the buffer that dissolves the analyte. The pH and ion concentration of the blank control liquid should be the same as the measurement sample. -
Page 40: Kinetics
absorbance and concentration). 2) Put the blank control sample into the cuvette, insert the cuvette into the OD600 slot, and tap “Blank” to start blank measurement. 3) When the blank measurement is complete, load your sample into the cuvette. Then insert the loaded cuvette into the OD600 slot and tap “Measure”... -
Page 41: Absorbance
4.7.1. Absorbance ● Sample Measurement: Before making a sample measurement, use a suitable buffer to make a blank control. The blank control liquid is the buffer that dissolves the analyte. The pH and ion concentration of the blank control liquid should be the same as the measurement sample. - Page 42 4) Open the upper pedestal arm, clean the upper and lower pedestal before measurement. Add a 1-2μl blank control sample to the pedestal. Then close the pedestal and tap the “Blank” button to start measurement. 5) When the blank measurement is complete, clean the upper and lower pedestal and add sample to measure.
- Page 43 ● Graph Display: Swipe left on the screen to enter the graph display page. Select start date, end date and test no. to filter through testing records. ● Test Result:...
- Page 44 Swipe left on the screen to enter the test result page. Select the start date, end date, sample type and test no. to filter through the testing records. Double tap a record to view a detailed report and test curve. Export: Insert the USB disk drive to the USB port, select the test data and tap the “Export”...
-
Page 45: Fluorescence
4.7.2.Fluorescence ● Sample Measurement: 1) When conducting tests, the system will automatically generate a test number, with the format being “year/month/day-serial number”. 2) Input measure interval and test times. 3) Tap the “Measure” button to start sample measurement. 4) When the measurement is complete, a dot plot is shown on the left-hand side of the screen, displaying the fluorescence intensity over time. - Page 46 ● Test Result: Swipe left on the screen to enter the test result page. Select the start date, end date, sample type and test no. to filter through the testing records. Double tap a record to view a detailed report and test curve. Export: Insert the USB disk drive into the USB port, select the test data and tap the “Export”...
-
Page 47: System
Delete: Select the data and tap the “Delete” button to delete. 4.8. System The system includes six modules. Tap on any module icon for the associated settings. 4.8.1. Time Tap the “Time” icon to set date and time, and tap “OK“ to save the settings. -
Page 48: Language
4.8.2. Language Tap the “Language” icon to select “简体中文” or “English”, and tap “OK“ to save the settings. 4.8.3. Device Information Tap the “Device Info” icon to view detailed information about this device. -
Page 49: Brightness
4.8.4. Brightness Tap the” Brightness” icon to adjust the brightness of the screen from level 0 to level 5 by tapping “ + ” “ - ” button or dragging the slider. 4.8.5. Upgrade Tap the “Upgrade” icon to view the current software version. For upgrading software or firmware, first save the upgraded version in the USB disk drive, insert the USB disk drive into the device and tap “Upgrade”... -
Page 50: Maintenance
4.8.6. Maintenance Tap the “Maintenance” icon, enter the password “411111111” to access the calibration interface: 1. OD600 Calibration The OD600 module can be calibrated with the use of visible absorbance references in an absorption cuvette. The reference materials may be either glass-based filters or liquid-based standards, with known absorbance values at 600nm. - Page 51 4) Tap the “Measure” button repeatedly (with a 5-second pause interval) to take repeated absorbance value measurements. If there are any erroneous outliers, tap the “Delete” button to remove them. It is recommended to obtain at least 3 valid measurements. 5) Repeat Steps 3 and 4 for each reference material prepared.
-
Page 52: Maintenance And Cleaning
● Calibration steps: 1) Standard concentration (ng/µl): Enter the known concentration for the current reference sample. The calibration pathlength will be automatically chosen based upon this value. 2) Open the upper pedestal arm, clean the upper and lower pedestal. 3) Add a 1-2μl blank control droplet to the pedestal. Then close the pedestal and tap the “Blank”... -
Page 53: Machine Use And Maintenance
1. Use pure water to remove impurities such as sample residues and oxides on the surface of the optical fiber head of the pedestals. The steps are as follows: 1) Add 3-5ul of pure water to the metal surface of the optical fiber at the bottom base. 2) Put the upper pedestal arm down to form a liquid column and let it stand for 2-3 minutes. -
Page 54: Warranty
6. Warranty We guarantee that our scientific instruments adhere to the most rigorous engineering and quality standards. This instrument is warranted to be free from defects in materials and workmanship under normal use and service, for a period of 12 months from the date of dispatch. - Page 55 Date:2024.04.09 Version:V1.1...
Need help?
Do you have a question about the SPT-NanoF and is the answer not in the manual?
Questions and answers