
Related Manuals for Fnirsi DPOX180H


Summary of Contents for Fnirsi DPOX180H
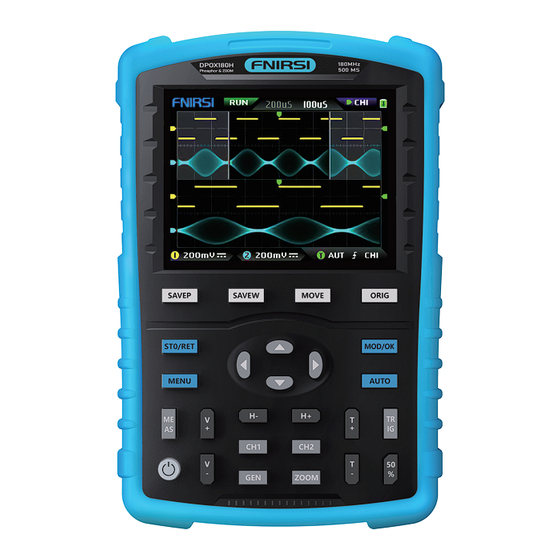
- Page 1 DPOX180H 二 合 一 数 字 荧 光 示 波 器 使 用 说 明 书 2-in-1Digital Phosphor OscilloscopeInstruction Manual SAVEP SAVEW MOVE ORIG STO/RET MOD/OK MENU AUTO ZOOM P h o s p h o r & z o o m...
- Page 3 CATALOG...
- Page 5 Warning ●When the two channels are used at the same time, the ground clips of the two probes must be connected together. It is strictly forbidden to connect the ground clips of the two probes to different electric potentials, especially the different potential terminals of high-power device or 220V.
-
Page 6: Main Interface Description
1.Main interface description... - Page 7 interval represented by one large division in the vertical direction of the background grid scale, and 500mVhere means that the voltage interval of one large division in the vertical direction of the grid scale is 500 mV. ⑧The icon of the input coupling mode of channel 1. The upper part of the icon is a horizontal line and the lower part is a dotted mark, which means DC coupling.
- Page 8 2.ZOOM interface description ①Under the main time base, the reference potential indicator arrow of channel 1, with channel 1 asa reference, indicates that the potential here is 0 V. ②Main time base, in the upper half of the display area, all vertical dimensions are reduced to half of the original.
- Page 9 ⑫Main time base position, indicating the time interval represented by a large grid in the horizontal direction of the grid scale of the main time base. ⑬The ZOOM time base is mapped to the enlarged area of the main time base, indicating that the waveform in this area is enlarged and mapped to the ZOOM time base.
- Page 10 4.X-Y mode interface description ①The reference potential indicator of channel 2, with channel 2 as the reference, indicating that the potential here is0V. ②An X-Yclosed curve graph composed of the signal of channel 1 as Xand the signal of channel 2 asY, with digital fluorescent display. ③The indicator of the reference potential of channel 1, with channel 1 as a reference, indicating that the potential here is0V.
- Page 11 ①Frequency symbol, F is the abbreviation of Frequency, you can switch and control F, Wave type and Duty through the【 MOD/OK】key, and the active state is green. ②Wave type mark, you can switch control F and Wave type and Duty through the 【MOD/OK】key, and the active state is green.
-
Page 12: Key Description
7.Key description Button Function One-click save screen capture, click thisbutton, the system will automatically capture the display content of the entire screen and save SAVEP it asa BMP image file to store in the local disk. Save the waveform with one button, click this button and the system will automatically save the data of the opened channel asa SAVEW WAV waveform file and store it on the local disk. - Page 13 Button Function One-key return to the center button. After clicking this button, all the ORIG indicator arrows will return to the middle position, that is, CH1, CH2, trigger X, and trigger Y will return to the middle position. This button has two functions of pausing sampling and returning to the menu. When all menus are closed, this button switches between running and STO/RET pausing sampling.
- Page 14 Button Function It is used to reduce the trigger level, reduce the trigger threshold voltage, and the trigger indicator arrow will move down. Trigger control setting shortcut key, this key is used to quickly open TRIG the menu and automatically locate the trigger control setting bar. Onekey to automatically set the trigger level to a suitable position, and its ratio will be adaptively adjusted to 25% or 50% or 75%.
- Page 15 Set the movement adjustment speed: Click【 MOVE】to set the movement speed of the current direction key, which is divided into coarse adjustment and fine adjustment. The movement speed of coarse adjustment is10 timesthat of fine adjustment. Return the waveform to the midpoint position: Click【...
- Page 16 Set the trigger channel: Click【 TRIG】, a menu will pop up, use to the Trigger channel column, then click【 MOD/OK】to switch to CH1 or CH2, and then click 【 MENU】 exit menu. Adjust the trigger level: Directly press【 T+】【 T-】to adjust the green trigger electric level arrow up and down.
- Page 17 Set the clipping signal to be output: Click【 MENU】, a menu will pop up, use to locate the selection bar to the Data browser column, then click【 MOD/OK】, and use to the selection bar to the Capture browser column, and then click 【MOD/OK】to enter the waveform browser to browse all the stored clipped signals.
- Page 18 required settings. Then click【 MOD/OK】to set the probe magnification to 1X or 10X or 100X, and then click【 MENU】to exit the menu. Set the input coupling mode: Click【 CH1】or【 CH2】, a menu will pop up, use to the Coupling mode column, and then click【 MOD/OK】to switch the coupling mode to DCDCor AC, and click【...
-
Page 19: Common Problems
X-Y time base mode: Click【 MENU】, a menu will pop up, select the column to Function settings through , then click【 MOD/OK】, select the column through Locate the X-Y curve option column, click【 MOD/OK】 to enable or disable the X-Y time base mode, and then click【MENU】to exit the menu. - Page 20 button will display red, and you can start the device at thistime. Why isthere no waveform in the test, only a straight baseline on the screen ? Answer: Please check whether the pause is pressed, if not, press the [AUTO] button, if not, it may be that the signal source has no signal output, or the probe line is short-cir- cuited or open-circuited, please check the probe with a multimeter and whether the signal source isnormal.
- Page 21 Timebase and vertical sensitivity, and finally release the pause, wait for the arrival of the burst signal, it will automatically pause after it is captured. Why is there no waveform when measuring a battery or other DC voltage ? Answer: The battery voltage signal is a stable DC signal, and there is no curved waveform.In theDCcouplingmode,and then adjust thevertical sensitivity,therewill be an upward or downward offset straight linewaveform.If it isACcoupling,no...
- Page 22 10.Contact US Any FNIRSI'users with any questions who comes to contact us wiil have our promise to get asatisfactory solution + an Extra 6-Month Warranty to thanks for yoursup- port! By the way, We have created an interesting community, welcome to contact FNIRSI staff to join our community.
Need help?
Do you have a question about the DPOX180H and is the answer not in the manual?
Questions and answers