Table of Contents
Advertisement
Quick Links
Advertisement
Table of Contents
Troubleshooting

Related Manuals for Vaisala CT25K


Summary of Contents for Vaisala CT25K
- Page 1 M210885EN-K User Guide â Vaisala AviMet Low-Level Windshear Alert System...
- Page 2 This product contains software developed by party without prior written permission of the Vaisala or third parties. Use of the software is copyright holder. Translated manuals and governed by license terms and conditions...
-
Page 3: Table Of Contents
Table of Contents Table of Contents About This Document..................7 Version Information.....................7 Related Manuals....................7 Documentation Conventions................8 Trademarks......................8 Product Overview..................... 9 System Introduction....................9 AviMetâ Product Platform................10 System Configuration..................10 Use of Anti-Virus Software.................11 End-user Software Applications............... 11 2.5.1 Viewing Current Data................... 11 2.5.2 Viewing Past Data..................12 2.5.3... - Page 4 Troubleshooting ASCII Log View..............65 Sensor Selector....................67 Introduction to Sensor Selector..............67 Sensor Selector User Interface................ 67 Operating Sensor Selector................68 8.3.1 Disabling Data Use..................68 8.3.2 Enabling Data Use..................68 Appendix A: Software End User License Agreement........69 Vaisala AviMetâ Software End User License Agreement......69...
- Page 5 Table of Contents Glossary..........................73 Index..........................77 Technical Support.......................81 Warranty......................... 81 Recycling........................81...
- Page 6 Low-Level Windshear Alert System User Guide M210885EN-K List of Figures Figure A Typical Vaisala AviMet System ..............9 Figure 2 WeatherView: Sample Screen Elements............. 18 Figure 3 WeatherView: LLWAS Screen.................19 Figure 4 WeatherView: Data Field Example............... 21 Figure 5 WeatherView: Example Dimmed Data............23 Figure 6 WeatherView: Example Visual Alert............
- Page 7 AviMetâ Manuals....................7 Table 3 User Groups and Corresponding User Profiles..........13 Table 4 Typical Software Applications by User Profile..........13 Table 5 Vaisala AviMet Application Buttons............... 16 Table 6 WeatherView: LLWAS Screen Texts..............19 Table 7 LLWAS Processing Statuses................20 Table 8 WeatherView: Data Field Status Colors............21...
- Page 8 Low-Level Windshear Alert System User Guide M210885EN-K...
-
Page 9: About This Document
1.1 Version Information This document contains the information necessary to use the end-user software applications of the Vaisala AviMetâ Low-Level Windshear Alert System (LLWAS). The manual is mainly intended for air traffic controllers, observers, and forecasters at the airport. Table 1 Document Versions... -
Page 10: Documentation Conventions
Indicates that you need to take some notes during the task. 1.4 Trademarks AviMetâ is a registered trademark of Vaisala Oyj. Microsoftâ, Windowsâ, and Internet Explorerâ are either registered trademarks or trademarks of Microsoft Corporation in the United States and/or other countries. -
Page 11: Product Overview
Vaisala AviMetâ Low-Level Windshear Alert System (LLWAS) consists of wind speed and wind direction sensors located around the runway area perimeter. The CDU processes the horizontal wind speed and direction data using the LLWAS III algorithm, developed by NCAR for the U.S. -
Page 12: Avimetâ Product Platform
System Maintenance Manual. 2.3 System Configuration Vaisala AviMet systems are always configured individually for each airport to meet the local requirements. During system delivery, Vaisala personnel will define the system parameters and the layout of some application windows. This is typical especially with end-user applications. -
Page 13: Use Of Anti-Virus Software
2.4 Use of Anti-Virus Software WARNING! To ensure proper functioning of the AviMet software, always consult Vaisala about using any anti-virus software. When AviMet system is in operational use, software anti-virus functionalities, especially automatic updates and blocking, cannot be used. AviMet software has been designed to be run on closed and secured networks. -
Page 14: Viewing Past Data
These applications are tools for maintenance and administrator level users. â Low-Level Windshear Alert System For detailed information, see Vaisala AviMet Maintenance Manual. Diagnostics The Diagnostics application is the main tool for system maintenance personnel. The... -
Page 15: User Profiles
Vaisala configures the user profiles for the system. The applications available for each user profile depends on the configuration of the system. To access the applications, the user must log in to the workstation with the appropriate user profile. -
Page 16: Regulatory Compliances
The AviMet systems are designed according to the recommendations of international air traffic authorities as presented in the following sources. The algorithm used for calculations in the Vaisala AviMetâ Low-Level Windshear Alert System (LLWAS) is the latest version of the phase III windshear algorithm developed for the U.S. -
Page 17: Getting Started
Chapter 3 – Getting Started 3. Getting Started 3.1 Logging In Log in to your computer with your Windows user name and password. The AviMet system starts and applies your profile automatically, giving you all the AviMet application rights that you need in your daily tasks. If you receive error messages when trying to log in, contact system maintenance personnel. -
Page 18: Table 5 Vaisala Avimet Application Buttons
For example, the Sensor Control functionality may be part of WeatherView application, or another application, as configured. The following table shows the typical icons used for AviMet applications. Table 5 Vaisala AviMet Application Buttons Button Description Opens the WeatherView application. -
Page 19: Weatherview
Chapter 4 – WeatherView 4. WeatherView 4.1 Introduction to WeatherView The WeatherView application displays windshear and microburst alerts in text format. Windshear and microburst alerts are warnings generated by the system when the calculated windshear and microburst conditions exist. WeatherView also indicates wind direction and wind speed at each runway for arrival, centerfield, and departure, the estimated location of the first encounter with the windshear conditions, the estimated headwind gain or loss, and the status of the windshear calculation. -
Page 20: Figure 2 Weatherview: Sample Screen Elements
Low-Level Windshear Alert System User Guide M210885EN-K Figure 2 WeatherView: Sample Screen Elements Buttons for acknowledging alerts, sound on/off, showing/hiding the site numbers inside the sensor site symbols, and testing Graphical windshear display. Can also include a map on the background. Identification data in application header (for example, time and date) Button for selecting day/night display and for printing Wind rose elements... -
Page 21: Llwas Screen
Chapter 4 – WeatherView 4.2.1 LLWAS Screen WeatherView always includes one or more LLWAS screens. The LLWAS screen displays wind data and windshear alerts in text format. The LLWAS screen includes a data row for each runway. The following figure displays an example of an LLWAS screen. Figure 3 WeatherView: LLWAS Screen Runway name (including departure/arrival indicator) Alert type (microburst or windshear alert) -
Page 22: Centerfield Wind Data And Time
Low-Level Windshear Alert System User Guide M210885EN-K Code Explanation Departure. Left arrival, the leftmost of 2 or 3 parallel runways for arrival. For example, 17LA refers to the leftmost runway facing 170 degrees, designated for arriving aircraft. Right arrival, the rightmost of 2 or 3 parallel runways for arrival. For example, 26RA refers to the rightmost runway facing 260 degrees, designated for arriving aircraft. -
Page 23: Weather Data Fields
Chapter 4 – WeatherView More Information ‣ Troubleshooting WeatherView (page 40) 4.2.4 Weather Data Fields Depending on the workstation type and installation, typically when the LLWAS system is integrated with an AWOS system, the WeatherView application can include other data, in addition to the LLWAS data presented above. - Page 24 Low-Level Windshear Alert System User Guide M210885EN-K Data Color Data Color Status Description (Day) (Night) Red slashes Modified red Missing The data is not available because of problems in the slashes system, or the system has just been restarted and there is not enough data available yet.
-
Page 25: Figure 5 Weatherview: Example Dimmed Data
Chapter 4 – WeatherView 4.2.4.4 Dimmed Data in Accordance with Runway in Use Activity Depending on system configuration, the data for the runway that is not in use can be configured to be "dimmed" (grayed out). The displays will follow the runway in use status and automatically gray out the data when needed. -
Page 26: Figure 7 Weatherview: Tendency Indicators
Low-Level Windshear Alert System User Guide M210885EN-K The following table describes the typical alert types and colors. CAUTION! Depending on your system configuration, other principles and colors may be used. The following presents only some typical examples. Table 9 Alarm Types Type Frame Color Description... -
Page 27: Wind Options
Chapter 4 – WeatherView The following table describes the standard colors. Depending on the configuration, different colors may be used. Table 10 Tendency Indicators Indicator Description Green (arrow up) Increasing Red (arrow down) Decreasing A dot in the same color as the value Not changed 4.2.5 Wind Options 4.2.5.1 Headwind, Tailwind, and Crosswind According to Runway in Use... -
Page 28: Figure 9 Head/Tail And Crosswind In Graphical Format In The Rwy
Low-Level Windshear Alert System User Guide M210885EN-K Figure 9 Head/Tail and Crosswind in Graphical Format in the RWY Ends and RWY Mid Point Figure 10 Head/Tail and Crosswind in Graphical Format for the RWY Touchdown Zones 4.2.5.3 Wind Rose Options WeatherView includes wind roses for wind data indication. The following elements are typically included: •... -
Page 29: Reports And Notifications Pane
Chapter 4 – WeatherView Figure 12 Windrose with Runway Graphic in Tower View (Line Indicating North Direction) Depending on your system configuration, wind direction and wind speed values may be displayed above the wind rose: Figure 13 Wind Rose with Wind Values Above 4.2.6 Reports and Notifications Pane WeatherView screens can also display text fields containing, for example, the text of the latest METAR report that has been sent from the airport. -
Page 30: Radar Warnings
Windows Taskbar. 4.2.7 Radar Warnings Vaisala IRIS ™ Focus weather radar software can be integrated to the Vaisala AviMet AWOS system. Depending on the level of integration in the system, the following features can be available: •... -
Page 31: Sensor Control Feature
Chapter 4 – WeatherView For more information on the IRIS Focus software, see IRIS Focus User Guide. 4.2.8 Sensor Control Feature If configured, the Sensor Control feature can be opened with the WeatherView buttons. With Sensor Control you can select which of the available sensors is used as the source for the automatic data. -
Page 32: Graph Fields
Low-Level Windshear Alert System User Guide M210885EN-K 4.2.9 Graph Fields Typically, the WeatherView displays for Observers include graph fields. A graph field can contain several plot lines indicated with different colors. Figure 17 Graph Field Example Legend: Plot line colors and check boxes for hiding/showing Plot lines Trace view selection check box Time span selection buttons... -
Page 33: Figure 19 Graph Configuration Window
Chapter 4 – WeatherView 4.2.9.1 Graph Configuration Window You can adjust the graph properties in the configuration window. The available adjustable options depend on user rights. The configuration window can be accessed by right-clicking on the graph and then selecting the Configure option. The configuration is made individually for each graph. -
Page 34: Weatherview Buttons
Low-Level Windshear Alert System User Guide M210885EN-K Table 12 Graph Configuration Window Tabs Description Axes Allows the user to change the unit axis and the step, that is, how many graph grid lines are drawn. Grids Allows the user to change in what style the graph grid lines are drawn, for example, whether they are visible and what color is used. -
Page 35: Day And Night Display Modes
Chapter 4 – WeatherView Button Description Buttons for accessing other applications or features, for example, Sensor Control. The number and content of the buttons depend on the system configuration. For icons on the Graph view, refer to Figure 17 (page 30). -
Page 36: Starting And Exiting Weatherview
Low-Level Windshear Alert System User Guide M210885EN-K 4.3.1 Starting and Exiting WeatherView Depending on your user profile and system configuration, the WeatherView application may start automatically when you log in to an AviMet workstation, or you can open it using the WeatherView shortcut icon, for example, in the desktop. -
Page 37: Table 14 Weatherview: Sample Llwas Screen Texts
Chapter 4 – WeatherView To monitor windshear alerts: 1. Look for the windshear alert on the LLWAS screen. Depending on the system configuration, the alert is indicated by one or all of the following: • The letters MBA or WSA in the LLWAS screen •... - Page 38 Low-Level Windshear Alert System User Guide M210885EN-K LLWAS Screen Text Explanation 28LA WSA 30K+ RWY 120 06 28LA Runway, in this case 28, left arrival. Windshear alert. 30K+ Headwind gain, 30 knots. Location of the first encounter with the windshear condition, in this case the runway.
-
Page 39: Monitoring Weather Data And Status
Chapter 4 – WeatherView 4.3.5 Monitoring Weather Data and Status If, in addition to LLWAS data, your system includes other data, monitor the data and status by doing the following: 1. Monitor the color of the data field values. There may be problems in the system if one of the following takes place: •... -
Page 40: Viewing Current System Data And Reported Data
Low-Level Windshear Alert System User Guide M210885EN-K 4.3.9 Viewing Current System Data and Reported Data If configured in your system, the WeatherView application may include the option of comparing the current automatic system data and the data reported in the last METAR report, including the manual changes. - Page 41 Chapter 4 – WeatherView Depending on the system configuration and your user profile, the configuration window may contain only one tab (Axes), two tabs (Axes and Grids), or all three tabs (Axes, Grids, and Plots). The configuration must be changed individually for each graph. When the WeatherView application is closed and restarted, the graph default settings will override the changes made in the Configuration window.
-
Page 42: Troubleshooting Weatherview
Low-Level Windshear Alert System User Guide M210885EN-K When you close the WeatherView application, the default configuration will be used again. 4.3.11.3 Configuring Plot Lines 1. Right-click on the graph you want to configure and select Configure. The Configuration window is displayed. 2. -
Page 43: Table 15 Troubleshooting Weatherview
Chapter 4 – WeatherView Table 15 Troubleshooting WeatherView Problem Probable Cause Solution LLWAS processing status is Some of the sensors are inactive, Contact maintenance. DEGRADED. but the number of inactive sensors does not exceed the limit for inaccurate data. The reported data is still fairly reliable and windshear and microburst alerts can be provided. - Page 44 Low-Level Windshear Alert System User Guide M210885EN-K...
-
Page 45: Graphical Windshear Display
Chapter 5 – Graphical Windshear Display 5. Graphical Windshear Display 5.1 Introduction to Graphical Windshear Display The Graphical Windshear Display provides a graphical user interface to the AviMet LLWAS system. Typically, the display is part of the WeatherView application and accompanied with the LLWAS alert screen. -
Page 46: Figure 21 Example Graphical Windshear Display
Low-Level Windshear Alert System User Guide M210885EN-K Figure 21 Example Graphical Windshear Display Areas Noted for Attention (ARENA) boxes with no alert (no color) Wind flag Sensor site symbol, without site number Buttons for acknowledging alerts, sound on/off, showing/hiding the site numbers inside the sensor site symbols, and testing CAUTION! The user interface is configured individually for each system, thus the colors... -
Page 47: Sensor Site Symbols
Chapter 5 – Graphical Windshear Display 5.2.1 Sensor Site Symbols The round symbols on the map represent the sensor sites on the airport, see Figure 21 (page 44). The color of the sensor site symbols is configured individually for each system. If selected with the Show site info button, the site numbers are displayed inside the site symbol. -
Page 48: Alert Boxes (Area Noted For Attention)
Low-Level Windshear Alert System User Guide M210885EN-K Wind Flag Explanation This flag indicates a wind speed of 50 knots (about 26 meters per second). This flag indicates a wind speed of 55 knots (about 28 meters per second). More Information ‣... -
Page 49: Operating Graphical Windshear Display
Chapter 5 – Graphical Windshear Display 5.3 Operating Graphical Windshear Display 5.3.1 Starting and Exiting Graphical Windshear Display When configured, the Graphical Windshear Display is automatically opened with the WeatherView application. More Information ‣ Starting and Exiting WeatherView (page 34) 5.3.2 Viewing Wind Speed and Direction Values The wind direction and speed values for the wind sites can be viewed in wind flags and in the sensor site legends. -
Page 50: Showing/Hiding Sensor Site Numbers
Low-Level Windshear Alert System User Guide M210885EN-K 5.3.5 Showing/Hiding Sensor Site Numbers To select if the sensor site numbers are displayed inside the sensor site symbols, toggle the Show site info/Hide site info button. 5.3.6 Testing Alarms To test how the alarms will be displayed, click the Test button. All possible alerts are shown as blinking alert boxes. -
Page 51: Diagnostics
Chapter 6 – Diagnostics 6. Diagnostics 6.1 Introduction to Diagnostics The Diagnostics application monitors the overall status of the AviMet system. The application is mainly a tool for maintenance personnel who use it for monitoring and troubleshooting the CDU(s) and other equipment in the system. However, the observers may have a simplified version of the Diagnostics application which allows them to view the system events related to their work. -
Page 52: Events Panel
The Diagnostics user interface for observers typically consists of the Events panel. The Diagnostics application for the maintenance personnel contains several additional features, â Low-Level such as the System Status panel. For more information, see Vaisala AviMet Windshear Alert System Maintenance Manual. Figure 22 Diagnostics Application (Observer User Profile) The elements of the Diagnostics application are briefly described in the following sections. -
Page 53: Table 19 Events Panel Tabs /Event Types
Chapter 6 – Diagnostics 6.2.1.1 Events Panel Tabs/Event Types The system events are displayed on several tabs, the number and type of which depends on the system configuration and the user profile. Table 19 Events Panel Tabs /Event Types Type Explanation Operational/OPER Shows preconfigured operational messages, for example, messages related to predefined changes in weather. -
Page 54: Operating Diagnostics Application
Low-Level Windshear Alert System User Guide M210885EN-K Element Name Description Priority (Optional) Displays the priority of the alarm if the system has priority classification capability. Type The type of the event message. See Events Panel Tabs/Event Types (page 51). Device The sensor, or other piece of equipment, that the event is related to. -
Page 55: Viewing Stored Events
Chapter 6 – Diagnostics When you have read an event message, acknowledge it to inform the system that you have seen the message. The system then stores the event in a history file, together with the time of acknowledgement. A typical system event monitoring procedure is described below. Check the airport-specific practices for a detailed procedure. -
Page 56: Troubleshooting Diagnostics
Low-Level Windshear Alert System User Guide M210885EN-K When the problem has been fixed or the condition causing the event has passed, the event status changes to OVER and the event message disappears from the Events panel. The OVER status is shown only in the history files, which you can view with the ASCII Log View application. -
Page 57: Ascii Log View
Chapter 7 – ASCII Log View 7. ASCII Log View 7.1 Introduction to ASCII Log View ASCII Log View is an application for viewing the history files. Depending on the configuration of the system, the history files are stored either for a period of one year or several years. -
Page 58: Ascii Log View Main Window
Low-Level Windshear Alert System User Guide M210885EN-K 7.2.1 ASCII Log View Main Window The following figure presents the ASCII Log View main window when no files have been selected for viewing. Figure 23 ASCII Log View Main Window When history files have been selected for viewing, the files are displayed either in Tab or Tile mode inside the ASCII Log View main window. -
Page 59: Weather Parameter Files
Chapter 7 – ASCII Log View 7.2.2 Weather Parameter Files The weather parameter files show weather parameters for the measurement sites, as defined during system configuration. For a list of typical parameters at your airport, refer to the airport-specific documentation. Figure 24 ASCII Log View: Weather Parameter File Examples (Tile Mode) Some typical columns in weather parameter files: CREATEDATE The date and time of the measurement. -
Page 60: Reports Files
Low-Level Windshear Alert System User Guide M210885EN-K If the data has several simultaneous statuses, all these statuses are shown in the status column. Table 24 ASCII Log View: Status Codes Status Code Data Status at Storage Time - (no code) Normal status. Data comes from a sensor and is valid. C (Backup/Copied) (For optional weather data when LLWAS is integrated with AviMet AWOS) Data comes from a backup sensor due to a problem with the original sensor. -
Page 61: Events Files
The site of the event. For example, 02L. The event message as displayed in the Events panel of the Diagnostics application. The event type, for example, TECH. For more information on event types, see Vaisala â Low-Level Windshear Alert System Maintenance Manual. -
Page 62: Ascii Log View Toolbar Buttons
Low-Level Windshear Alert System User Guide M210885EN-K ST/Statustext The status of the event: 0 = over 1 = acknowledged 2 = alarm 3 = warning 4 = message notification 7.2.5 ASCII Log View Toolbar Buttons The buttons available in the toolbar at the top of the application: Table 26 ASCII Log View Toolbar Buttons Button Description... -
Page 63: Starting Ascii Log View
Chapter 7 – ASCII Log View 7.3.1 Starting ASCII Log View 1. Click the ASCII Log View icon located, for example, in the desktop. 7.3.2 Opening and Viewing History Files By default, the history files are located in the CDU in the D:\Avimet\history\month folder. -
Page 64: Viewing Several Files At The Same Time
Low-Level Windshear Alert System User Guide M210885EN-K To open and view history files: 1. Start the ASCII Log View application by clicking the ASCII Log View button in the Windows taskbar or the Tools panel in the Diagnostics application. 2. Click Open in the toolbar. 3. -
Page 65: Refreshing Data Automatically
Chapter 7 – ASCII Log View 4. In the Tile mode, several open files are displayed simultaneously. You can do the following: • If the files do not fit the screen, drag the file window borders to resize and arrange the files to suit your needs. -
Page 66: Showing Hidden Rows
Low-Level Windshear Alert System User Guide M210885EN-K 7.3.7 Showing Hidden Rows To check if there are hidden rows, look at the row numbers in the first column. Missing row numbers indicate that rows are hidden. To unhide hidden rows: 1. Right-click anywhere on the open file. 2. -
Page 67: Troubleshooting Ascii Log View
Chapter 7 – ASCII Log View 7.4 Troubleshooting ASCII Log View Table 28 Troubleshooting ASCII Log View Problem Probable Cause Solution You cannot find the history files in The history files might be located Check the location of the history the CDU folder D:\Avimet on another location in the CDU or files from system maintenance, and on a network drive. - Page 68 Low-Level Windshear Alert System User Guide M210885EN-K...
-
Page 69: Sensor Selector
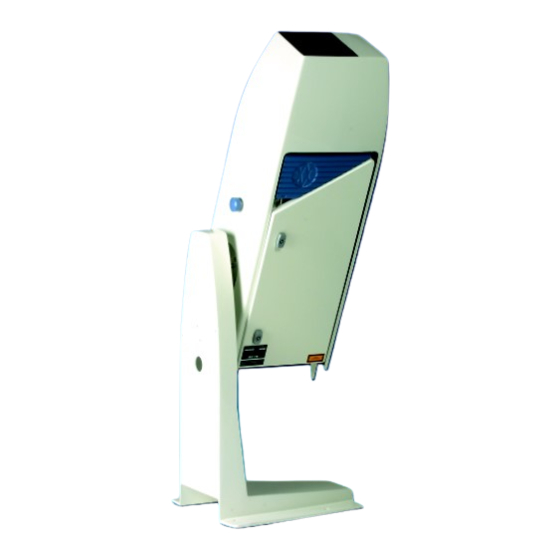
Disabled (= Enabled checkbox not selected): Data from a disabled sensor is not used in the system and its status is Offline. State The current status of data (Manual/Automatic). Type Type: sensor or interface Sensor model, for example, CT25K. Model... -
Page 70: Operating Sensor Selector
Low-Level Windshear Alert System User Guide M210885EN-K Column Description Location Location of the sensor, for example, runway 10L. Status Status of the sensor: • Online: Sensor is working normally and its data is used in the system. • Unavailable: Sensor is offline/unavailable and its data is not used in the system. -
Page 71: Appendix A: Software End User License Agreement
Appendix A. Software End User License Agreement All rights to any software are held by Vaisala or third parties. The customer is allowed to use the software only to the extent that is provided by the applicable supply contract or Software End Used License Agreement. - Page 72 Vaisala equipment that may be operated, controlled, and/or displayed by the Software. You agree that, in the event and at such time as you no longer own any Vaisala equipment that may be controlled by the Software, or in the event of other termination,...
- Page 73 Contracts for the International Sale of Goods (CISG) shall be excluded. Any dispute, controversy or claim arising out of or relating to this Contract between Vaisala and the customer, which cannot be solved by amicable means shall be submitted to arbitration.
- Page 74 Low-Level Windshear Alert System User Guide M210885EN-K 11. Support, Maintenance, Releases. Licensor shall not be obligated to provide you with any support, consulting or maintenance for the Software under this License. Licensor, further, shall not be obligated to provide you with any Modifications under this License. In the event that Licensor, at its sole discretion, provides Modifications, the terms and conditions of this Agreement shall apply to both the Modifications and the modified Software.
-
Page 75: Glossary
Glossary Glossary acknowledge Clicking the ACK button in order to inform the system that you have seen an event message in the Diagnostics application. alarm message A Diagnostics system event message with ALARM or WARNING status. A sign of serious system problems. ASCII Log View An AviMet application for viewing stored data in text files. - Page 76 Low-Level Windshear Alert System User Guide M210885EN-K LLWAS algorithm The algorithm used in the AviMet LLWAS system for calculating the windshear conditions. The LLWAS phase III windshear algorithm developed by NCAR for the U.S. Federal Aviation Administration (FAA). LLWAS screen A screen in the WeatherView application displaying wind data, windshear alert data, and microburst alert data in text format for the specified runways.
- Page 77 The way AviMet systems are customized during system delivery. system delivery The installation and configuration of the AviMet system by Vaisala. During the delivery, the system is customized to meet the local requirements. system maintenance applications Applications used by maintenance personnel for their tasks, mainly Diagnostics and IO...
- Page 78 Low-Level Windshear Alert System User Guide M210885EN-K technical event A message in the Diagnostics application indicating sensor problems in the system. weather data Weather parameter values in the WeatherView application, in contrast to system data. weather data screen A screen in the WeatherView application The system contains at least one weather data screen that includes the centerfield wind data, time, LLWAS processing status information, and one or more LLWAS screens.
-
Page 79: Index
Index Index user interface............49 Diagnostics, how to air-traffic controllers acknowledge events.......... 52 software applications.......... 11 exit application.............52 using WeatherView..........33 monitor events............. 52 WeatherView user interface......17 start application...........52 workstation types..........13 view stored event messages......53 alarms Diagnostics user interface........49 LLWAS alerts............19 alert boxes (Area Noted for Attention)..46 application icons............15... - Page 80 Low-Level Windshear Alert System User Guide M210885EN-K location..............19 message format............19 user interface............. 15 LLWAS algorithm............13 application icons..........15 LLWAS screen in WeatherView......19 ASCII Log View............ 55 logging in..............15 Diagnostics............49 Graphical Windshear Display......43 Sensor Selector............67 maintenance applications........12 WeatherView............17 maintenance workstation........
- Page 81 Index monitor weather data........37 monitor windshear alerts......... 34 start applications..........34 switch between views........34 use trace..............38 view exact values in graphs......38 wind data in Graphical Windshear Display....45 wind rose..............26 windshear alerts LLWAS screen in WeatherView...... 19 message format............19 monitoring.............
- Page 82 Low-Level Windshear Alert System User Guide M210885EN-K...
-
Page 83: Technical Support
Technical Support Contact Vaisala technical support at helpdesk@vaisala.com. Provide at least the following supporting information: • Product name, model, and serial number • Name and location of the installation site • Name and contact information of a technical person who can provide further information on the problem For more information, see www.vaisala.com/support. - Page 84 Low-Level Windshear Alert System User Guide M210885EN-K...
- Page 86 www.vaisala.com...
Need help?
Do you have a question about the CT25K and is the answer not in the manual?
Questions and answers