
Related Manuals for Shimadzu GCMS-QP2010 Series


Summary of Contents for Shimadzu GCMS-QP2010 Series
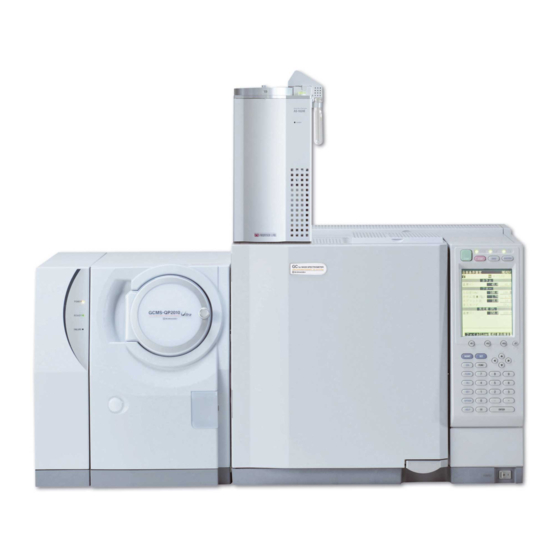
- Page 1 225-18481 Mar. 2010 Gas Chromatograph Mass Spectrometer GCMS-QP2010 Series Operation Guide For GCMSsolution Ver. 2.6 Read the instruction manual thoroughly before you use the product. Keep this instruction manual for future reference.
- Page 2 This page is intentionally left blank.
- Page 3 Shimadzu Corporation is not responsible for errors or injuries resulting from following the instructions in this document. Shimadzu Corporation is not responsible for errors or injuries resulting from the use of equipment by the customer. Replacement parts for this product will be available for a period of seven (7) years after discontinuation of the product.
- Page 4 This document assumes that the user has a working knowledge of Windows. There are references to functions and terminology specific to Windows; refer to a Windows user manual as necessary. Users who have never worked with Windows should read a Windows user manual before using this document. GCMS-QP2010 Series Operation Guide...
- Page 5 3. Limitation of Liability 1) In no event will Shimadzu be liable for any lost revenue, profit or data, or for special, indirect, consequential, incidental or punitive damages, however caused regardless of the theory of liability, arising out of or related to the use of or inability to use the product, even if Shimadzu has been advised of the possibility of such damage.
- Page 6 However, the user still has the option to either use the same method used in version 2.5 or use the new features by following the steps provided in this manual." Indicates items displayed on the screen, such as buttons, menu selections, settings, windows, and icons. Example: Click [OK]. GCMS-QP2010 Series Operation Guide...
- Page 7 Otherwise, the product may tip over or fall off the surface. Do not install the product in locations subject to large amounts of corrosive gas or dust. Otherwise, performance may be adversely affected and the product's service life may be shortened. GCMS-QP2010 Series Operation Guide...
- Page 8 • Check that the pressure gauges are functional at least once every three months. • Warning signs (adhesive aluminum plates) that indicate hydrogen gas use are provided free of charge. Contact your Shimadzu representative in cases of particular necessity. Legal authorization is required to use cylinders with a capacity of 300 m or greater.
- Page 9 Take the measures described below in the event of an emergency, such as a malfunction of the gas chromatograph mass spectrometer. Before resuming operation, take appropriate precautions and, if necessary, contact your Shimadzu representative. Emergency Shutdown Procedure 1 Turn OFF the gas chromatograph mass spectrometer.
- Page 10 This page is intentionally left blank. viii GCMS-QP2010 Series Operation Guide...
-
Page 11: Table Of Contents
Creating a Method File ..................20 Setting Autosampler Parameters ..............21 4.1.1 Setting GC Parameters ..................21 4.1.2 Setting MS Parameters ..................22 4.1.3 Setting Similarity Search Parameters............... 23 4.1.4 Saving the Method File ..................25 4.1.5 GCMS-QP2010 Series Operation Guide... - Page 12 Checking and Correcting Calibration Curves ........... 60 Re-quantifying after Correcting a Calibration Curve ........67 5.3.2 Checking and Correcting Quantitation Results ..........69 5.3.3 Printing Quantitative Analysis Reports .............. 73 Creating and Outputting Quantitative Analysis Reports ........73 5.4.1 GCMS-QP2010 Series Operation Guide...
- Page 13 Ver.2.5 ..87 Changing Replacement Guidelines for septa and Glass Inserts ......89 Appendix E Single Analysis (Manual Injection) Appendix F Index Searches Appendix G Displaying Chromatograms Displaying Chromatograms from Fragment Tables ..........96 Displaying Chromatograms from Mass Spectra ..........98 GCMS-QP2010 Series Operation Guide...
- Page 14 Printing Reports Printing Images (Printing Spectra and Chromatograms Displayed in Windows) ...... 112 Creating Reports .................... 114 Using Templates ................... 114 J.2.1 Using Previously Created Report Files ............115 J.2.2 Manually Setting Report Content ..............116 J.2.3 GCMS-QP2010 Series Operation Guide...
-
Page 15: Overall Configuration Of Gcmssolution
Icons and windows for functions that can only be used on QP2010 Ultra or QP2010 SE model will not be displayed on the software if the GCMS model used is QP2010, QP2010 Plus or QP2010S. GCMS-QP2010 Series Operation Guide... -
Page 16: Flowchart Of Operating Procedure
• Calculate quantitative values for samples with unknown concentrations P.73 Print report • Edit report • Output report Shut down the instrument P.76 • Shut down the vacuum system • Switch the power OFF GCMS-QP2010 Series Operation Guide... -
Page 17: Starting Gc/Ms
GC/MS system. Turn ON the power to the GC. Front Side GC power switch Turn ON the power to the MS. Back Side MS power switch Turn ON the power to the PC, printer, and display. GCMS-QP2010 Series Operation Guide... -
Page 18: Layout Of Operating Areas
Real Time Analysis, Displays command menus corresponding to the window Analysis Editor, Postrun currently open. Analysis, and Browser Toolbar Real Time Analysis, Displays command tool buttons corresponding to the Analysis Editor, Postrun window currently open. Analysis, and Browser GCMS-QP2010 Series Operation Guide... -
Page 19: Inspecting Consumable Items And Maintenance Parts
When replacing the analysis column, or when a consumable item has passed its recommended replacement point, perform maintenance with reference to "Appendix D Maintenance" P.83. Depending on the analysis content, the appropriate replacement frequency may be greater than the recommended frequency. GCMS-QP2010 Series Operation Guide... -
Page 20: System Configuration
Select [AOC-20i+s] in the [Available Modules] area if for example, AOC-20i with AOC-20s are to be used for analysis. Click to register the module in [Modules Used for Analysis]. GCMS-QP2010 Series Operation Guide... -
Page 21: Checking Column Information
If the column to be used is not displayed under [Selected Column] area: Click the name of the column to be used in the [Registered Columns] table. Click [Select]. The column information is displayed under [Selected Column]. GCMS-QP2010 Series Operation Guide... - Page 22 The maximum temperature that can be specified for the column oven, interface, and sample injection unit is normally the [Max. Usable Temp] setting entered here. For the protection of columns, always enter a [Max. Usable Temp] setting. GCMS-QP2010 Series Operation Guide...
-
Page 23: Enabling The Modules Used For Analysis
2.4 System Configuration Click [OK]. The [System Configuration] window returns. 2.4.3 Enabling the Modules Used for Analysis Click [Set]. The system configuration information is transferred to the instrument. GCMS-QP2010 Series Operation Guide... -
Page 24: Vacuum System Startup
If carrier gas is being controlled by accessory/peripheral equipment, use that equipment to supply carrier gas before starting the vacuum system. Click the [Vacuum Control] icon on the [Real Time] assistant bar. The [Vacuum Control] window opens. Click [Auto Startup]. The vacuum system starts. When [Completed] is displayed, click [Close]. GCMS-QP2010 Series Operation Guide... -
Page 25: Checking For Vacuum Leakage
Wait for 10 minutes after starting up the vacuum system. Click the [Tuning] icon on the [Real Time] assistant bar. The [Tuning] window opens. Click the [Peak Monitor View] icon on the [Tuning] assistant bar. The [Peak Monitor] window opens. GCMS-QP2010 Series Operation Guide... - Page 26 Refer to the System User's Guide for details on how to check for vacuum leaks. Click (Filament ON/OFF) to turn OFF the filament. Close the [Tuning] window. The message [Save current tuning file?] is displayed. Click [No]. GCMS-QP2010 Series Operation Guide...
-
Page 27: Autotuning
Click the [Data Acquisition] icon on the [Real Time] assistant bar. The [Acquisition] window opens. Click (Open) on the toolbar. GCMS-QP2010 Series Operation Guide... -
Page 28: Executing Autotuning
The measurement condition in the method file is modified according to the current instrument configuration." appears, click [OK]. 2.7.2 Executing Autotuning Click the [Tuning] icon on the [Real Time] assistant bar. The [Tuning] window opens. GCMS-QP2010 Series Operation Guide... - Page 29 • QP2010 Ultra:High concentration (20 µA), standard (60 µA, default), or high sensitivity (150 µA) • QP2010 SE:High concentration (20 µA) or standard (60 µA, default) Select the filament to be used. GCMS-QP2010 Series Operation Guide...
- Page 30 Click the [Start Auto Tuning] icon on the [Tuning] assistant bar. Enter a file name and click [Save] to start autotuning. When autotuning is completed, a report is printed. Close the [Tuning] window. The message [Save current tuning file?] is displayed. Click [Yes]. GCMS-QP2010 Series Operation Guide...
-
Page 31: Checking Autotuning Results
Check that the peak intensity for m/z 69 is at least twice that for m/z 28. If any irregularities are discovered above, possible causes could include a vacuum leak, poor column connections, or contaminated ion source. "Appendix D Maintenance" P.83 to implement corrective measures. GCMS-QP2010 Series Operation Guide... -
Page 32: Creating A Folder
Creating a Folder with Data Explorer Click the [Data Acquisition] icon on the [Real Time] assistant bar. The [Acquisition] window opens. Click (Data Explorer) on the toolbar to display Data Explorer. Click (Project (Folder) Selection). The [Project (Folder) Selection] window opens. GCMS-QP2010 Series Operation Guide... - Page 33 Type a folder name and click [OK]. A folder is created in the GCMSsolution folder in the C drive and the [Project (Folder) Selection] window returns. Click [Close]. To select an existing folder, see "Appendix C Using Data Explorer" P.81. GCMS-QP2010 Series Operation Guide...
-
Page 34: Qualitative Analysis
Use default values for parameters that are not covered by the following explanations. Click the [Data Acquisition] icon on the [Real Time] assistant bar. The [Acquisition] window opens. Select [New Method File] on the [File] menu. GCMS-QP2010 Series Operation Guide... -
Page 35: Setting Autosampler Parameters
Click the [GC] tab and set the analysis conditions. Input an initial temperature for the column oven (40 to 100 °C). Input an injection temperature based on consideration of the boiling point of the target compound (200 to 300 °C). Select [Split] or [Splitless]. GCMS-QP2010 Series Operation Guide... -
Page 36: Setting Ms Parameters
Set appropriate conditions for separating the target compound from other peaks. 4.1.3 Setting MS Parameters Click the [MS] tab and set the analysis conditions. [GC Program Time] value Input [Interface Temp.] (200 to 300 °C). Input [Start Time] and [End Time] according to the note below. GCMS-QP2010 Series Operation Guide... -
Page 37: Setting Similarity Search Parameters
The typical value for [Start m/z] is 35, and the typical value of [End m/z] is the highest molecular weight of the target compounds in the sample plus some margin of error (+15). 4.1.4 Setting Similarity Search Parameters Select [Qualitative Parameters] on the [Method] menu. The [Qualitative Parameters] window opens. GCMS-QP2010 Series Operation Guide... - Page 38 To remove a library from the selection, highlight the library file name by dragging the mouse over it, then press the [Delete] key. Select [Do not include duplicate hits]. After completing the settings, click [OK] to return to the original window. GCMS-QP2010 Series Operation Guide...
-
Page 39: Saving The Method File
Select [Save Method File As] on the [File] menu. Enter a file name and click [Save]. Repeating Autotuning If autotuning has not been performed under the analysis conditions, perform the procedures described under "2.7 Autotuning" P.13. GCMS-QP2010 Series Operation Guide... -
Page 40: Sequential Analysis
To use an existing batch file, follow the procedure starting in"4.3.2 Editing a Batch File Ver. 2.5" P.29. Click the [Batch Processing] icon on the [Real Time] assistant bar. The [Batch Table] window opens. Select [New Batch File] on the [File] menu. GCMS-QP2010 Series Operation Guide... - Page 41 The [Batch Table Wizard] window opens. With the Batch Table Wizard, make the appropriate settings and create a batch table. Click [New]. Click [Unknown Only]. Click and specify the method file to be used. Deselect both [Data Processing] items. Click [Next]. GCMS-QP2010 Series Operation Guide...
- Page 42 4 Qualitative Analysis Input [Vial #] and [Sample Count]. Input [Injection Volume]. Click [Next]. Enter [Data File Name]. If the file name ends with a number, the files are named sequentially. Click [Finish]. The batch table is displayed. GCMS-QP2010 Series Operation Guide...
-
Page 43: Editing A Batch File ^ Ver. 2.5
Paste Row Pastes the copied row. Delete Row Deletes the selected row. In addition, rows can be added easily by repeatedly entering "1" as the vial number and pressing the down arrow key on the keyboard. GCMS-QP2010 Series Operation Guide... - Page 44 It is not necessary to type file extensions when entering data file names. To set the method file, click within the cell, then click the arrow buttons that appear. The [Select Method File] window opens. Select the method file to use. GCMS-QP2010 Series Operation Guide...
- Page 45 (for quantitative analysis). Select [Fill Down] on the [Edit] menu. The entire content of the first row is copied. Select [Fill Series] on the [Edit] menu. Edited parameters will be appended with serial numbers. GCMS-QP2010 Series Operation Guide...
-
Page 46: Saving Batch Files
4 Qualitative Analysis 4.3.3 Saving Batch Files Select [Save Batch File As] on the [File] menu. Open the folder where the method file is saved, enter a name, and save the file. GCMS-QP2010 Series Operation Guide... -
Page 47: Executing Sequential Analysis
• To modify or add batch files while analysis is in progress, see "Appendix H Editing and Adding Batch Files During Sequential Analysis" P.99. • To execute only specified rows, select the rows by clicking or dragging the mouse, then start the analysis. GCMS-QP2010 Series Operation Guide... -
Page 48: Analyzing Data
Click the [Qualitative] icon on the [Postrun] assistant bar. 4.4.1 Loading Data Files With reference to "Appendix C Using Data Explorer" P.81, double-click the data file to be analyzed. The data file to be analyzed opens. GCMS-QP2010 Series Operation Guide... -
Page 49: Zoom In On A Peak In The Chromatogram And Displaying Mass Spectra
The top window displays the full chromatogram, and the second window displays any enlarged portion of the same chromatogram. To undo the zoom, right-click in the MC window and select [Undo Zoom] on the pop-up menu. GCMS-QP2010 Series Operation Guide... - Page 50 If a red peak appears in the mass spectrum, it indicates that the signal intensity for this m/z has exceeded the scale. To display the proper mass spectrum for target compounds, click the left or right arrow buttons to select a mass spectrum that shows no red peaks. GCMS-QP2010 Series Operation Guide...
-
Page 51: Removing The Background
The target spectrum, from which the background spectrum has been subtracted, is displayed. The background processing position. With the following types of peaks, process the parts indicated by arrows as background. Example 1) Example 2) Example 3) Background spectrum can be subtracted from one of positions. GCMS-QP2010 Series Operation Guide... -
Page 52: Searching For Similarity ^ Ver. 2.5
Similarity: The closer this value is to 100, the greater the similarity in mass spectra. To enter a compound name in the spectrum table, select the box for the applicable compound. Hit numbers for the compounds found. Use to switch between the mass spectra for the compounds found. GCMS-QP2010 Series Operation Guide... -
Page 53: Displaying Mass Chromatograms
P.96. Confirming the Purity of Peaks Displaying mass chromatograms can be used to check the presence of two or more overlapping peaks, or in other words, to check the purity of a peak in the chromatogram. GCMS-QP2010 Series Operation Guide... -
Page 54: Registering Spectra Displayed For Target Compounds ^ Ver. 2.5
Register all the other target compounds using the procedure described in "4.4.2 Zoom in on a Peak in the Chromatogram and Displaying Mass Spectra" P.35. 4.4.7 Editing the Spectrum Process Table Click the [Qualitative Table] icon on the [Qualitative] assistant bar. The [Qualitative Table] window opens. GCMS-QP2010 Series Operation Guide... - Page 55 Similarity: The closer this value is to 100, the greater the similarity in mass spectra. To enter a compound name in the spectrum table, select the box for the applicable compound. Click to copy the selected compound names to the spectrum table. GCMS-QP2010 Series Operation Guide...
-
Page 56: Saving Data Files
To edit compound names or other information in the spectrum process table, click the desired row, then select the [Edit] menu. Close the [Qualitative Table] window. 4.4.8 Saving Data Files Click (Save) on the toolbar. The qualitative table is saved in the data file. GCMS-QP2010 Series Operation Guide... -
Page 57: Printing Qualitative Analysis Reports
The [Data Report] window opens. Click [New Format File] on the [File] menu. The [File New] window opens. Select [Use Template] and select the format [Qualitative Analysis Report]. Click [OK]. The [Qualitative Analysis Report] format opens. GCMS-QP2010 Series Operation Guide... -
Page 58: Editing Report Formats
4 Qualitative Analysis 4.5.2 Editing Report Formats Double-click on the chromatogram. The [GCMS Chromatogram Properties] window opens. Click the [Chromato] tab. GCMS-QP2010 Series Operation Guide... - Page 59 In the [Area] area, deselect [Auto] for the X-axis and enter the time range. Click [OK]. Click the next page icon on the toolbar to display the second page. Double-click on the [Library] display item. The [GCMS Library Properties] window opens. GCMS-QP2010 Series Operation Guide...
- Page 60 4 Qualitative Analysis Click the [Result] tab. Enter the [Maximum Compound Number] (maximum number of search results to display). Click [OK]. GCMS-QP2010 Series Operation Guide...
-
Page 61: Outputting Reports
Click the [Preview] icon on the [Data Report] assistant bar. The print preview window opens. After checking the report content, click [Print] to print the report. Click (Save) on the toolbar. The report is saved as part of the data file. GCMS-QP2010 Series Operation Guide... -
Page 62: Quantitative Analysis
From Data Explorer, double-click the data file in which the spectrum process table for the target compounds was saved. Click the [Wizard (New)] icon on the [Compound Table] assistant bar. The [Compound Table Wizard] window opens. GCMS-QP2010 Series Operation Guide... - Page 63 5.1 Creating a Method File Select [Use current Spectrum Process Table] and then click [Next]. Click [Next]. Select a row in the table, check the mass spectrum for each compound, and click [Next]. GCMS-QP2010 Series Operation Guide...
- Page 64 Select [Area] or [Height]. Normally, select [Area]. # of Calib. Levels Input the number of concentration levels of the calibration curve. Unit Set the concentration unit used for reports. Format of Set the number of digits used to indicate concentrations. Concentration GCMS-QP2010 Series Operation Guide...
- Page 65 Set the type, compound name, target ion, and reference ion for each substance. After entering the required information for all the compounds, click [Next]. Select [Target] in the [Type] list. Select [I.S.] when setting for an internal standard. Change the type and m/z value. GCMS-QP2010 Series Operation Guide...
- Page 66 When editing is completed, return to display mode by clicking Click the [Save Compound Table] icon on the [Compound Table] assistant bar. The method file that was used to acquire the data will be selected automatically. GCMS-QP2010 Series Operation Guide...
-
Page 67: Creating A Sim Table
Click the [Create SIM Table [COAST]] icon on the [Compound Table] assistant bar. The [Select Method File] window opens. Enter a file name and click [Save]. The [Create SIM Table [COAST]] window opens. Click (Maximize) in the [Creation of Automatic SIM (Scan/SIM) Table [COAST]] window. GCMS-QP2010 Series Operation Guide... - Page 68 3. Click the inserted row and drag the mouse on the chromatogram to specify and enlarge the desired area. 4. Click near the center of peaks labeled with compound names. Group 3 is divided into two groups. GCMS-QP2010 Series Operation Guide...
-
Page 69: Sequential Analysis
Start the [GCMS Real Time Analysis] program and click the [Batch Processing] icon on the [Real Time] assistant bar. The [Batch Table] window opens. Select [New Batch File] on the [File] menu. Click the [Wizard] icon on the [Batch] assistant bar. The [Batch Table Wizard] window opens. GCMS-QP2010 Series Operation Guide... - Page 70 Select [Quantitative]. Click [Next]. Input [Vial #]. The number of calibration points is loaded automatically from the method. Input [Injection Volume]. Input [Average Count] (i.e., the number of repetitions). Click [Next]. GCMS-QP2010 Series Operation Guide...
- Page 71 5.2 Sequential Analysis Enter [Data File Name]. If the file name ends with a number, the files are named sequentially. Click [Next]. Input [Vial #]. Input [Sample Count]. Input [Injection Volume]. Click [Next]. GCMS-QP2010 Series Operation Guide...
-
Page 72: Editing A Batch File ^ Ver. 2.5
The batch table is displayed. 5.2.2 Editing a Batch File Ver. 2.5 To edit a batch file, see "4.3.2 Editing a Batch File Ver. 2.5" P.29. 5.2.3 Saving Batch Files Select [Save Batch File As] on the [File] menu. GCMS-QP2010 Series Operation Guide... -
Page 73: Executing Sequential Analysis
• To modify or add batch files while analysis is in progress, see "Appendix H Editing and Adding Batch Files During Sequential Analysis" P.99. • To execute only specified rows, select the rows by clicking or dragging the mouse and start the analysis. GCMS-QP2010 Series Operation Guide... -
Page 74: Analyzing Data
Checking and Correcting Calibration Curves Start the [GCMS Postrun Analysis] program and click the [Calibration Curve] icon on the [Postrun] assistant bar. The [Calibration Curve] window opens. Double-click the method file used in analysis from Data Explorer. GCMS-QP2010 Series Operation Guide... - Page 75 Peaks that are detected in the chromatograms after automatic peak integration, will have peak detection marks ( The detected peaks are subjected to identification based on the retention times and ion ratios peak identification mark). Peak identification mark Peak detection marks GCMS-QP2010 Series Operation Guide...
- Page 76 Peaks are detected but different peaks are identified. Perform manual identification. Peaks are detected and identified but peak integration is not performed Perform manual peak integration. properly. Only after correcting the calibration curves, click (Save) on the toolbar to save the method file. GCMS-QP2010 Series Operation Guide...
- Page 77 If no peaks are identified or detected, perform identification or peak integration using the procedure described below. Manual Identification Right-click in a chromatogram and select [Manual Identification] from the displayed menu. A bar is displayed. Click the top of the peak to be identified. The peak is identified. GCMS-QP2010 Series Operation Guide...
- Page 78 Right-click in a chromatogram and select [Manual Peak Integrate…] from the displayed menu. A bar is displayed. Drag the mouse from the start point to the end point of the peak. The [Base Line] window opens. GCMS-QP2010 Series Operation Guide...
- Page 79 Manual Peak Integration [Ctrl] + right-click-drag Connects points with horizontal baseline. Changing Parameters for Quantitative Processing Change quantitative processing parameters as necessary. Click the [Quantitative Parameters] icon on the [Calibration] assistant bar. The [Quantitative Parameters] window opens. Click the [Quantitative] tab. GCMS-QP2010 Series Operation Guide...
- Page 80 • [1/A]: Formulas are weighted by the inverse of the area value (or height value when a height is specified for the data used). After finishing making changes, click [OK]. Calibration curves are corrected according to the changed parameters. GCMS-QP2010 Series Operation Guide...
-
Page 81: Re-Quantifying After Correcting A Calibration Curve
Click the [Batch Processing] icon on the [Postrun] assistant bar. The [Batch Table] window opens. Select [New Batch File] on the [File] menu. Click the [Select Data File] icon on the [Batch] assistant bar. The [Select Data File] window opens. GCMS-QP2010 Series Operation Guide... - Page 82 The data file is selected. Click [OK]. A batch table is displayed. Assign a name to the batch file and save it. Click the [Start] icon on the [Batch] assistant bar. The data is re-quantified using the corrected calibration curve. GCMS-QP2010 Series Operation Guide...
-
Page 83: Checking And Correcting Quantitation Results
Click the [Quantitative] icon on the [Postrun] assistant bar. Double-click the data file to be checked from Data Explorer. The data file being checked opens. Click the [Results] tab in the [Compound Table View]. The quantitation results are displayed. GCMS-QP2010 Series Operation Guide... - Page 84 Standard Spectrum Reference Data Click on a compound name in the compound table and check the chromatogram in the [Quantitative View]. Check the results while viewing the peak identification/detection marks and baseline in the chromatogram. Qantitative View GCMS-QP2010 Series Operation Guide...
- Page 85 Under the minimum similarity index. Peak is not identified due to the measured similarity being less than the specified similarity setting, when mass pattern matching is specified in identification parameters. No peak is identified. Automatic identification results were manually deleted. GCMS-QP2010 Series Operation Guide...
- Page 86 Compounds can be identified from the shape of chromatograms, retention times, and other information obtained by referencing measurement data of standard samples or spiked samples. Select [Open Reference Data File] on the [File] menu to open the data file being referenced. The reference data is displayed. GCMS-QP2010 Series Operation Guide...
-
Page 87: Printing Quantitative Analysis Reports
Printing Quantitative Analysis Reports 5.4.1 Creating and Outputting Quantitative Analysis Reports Click the [Report] icon on the [Quantitative] assistant bar. The [Data Report] window opens. Click [New Format File] on the [File] menu. The [File New] window opens. GCMS-QP2010 Series Operation Guide... - Page 88 5 Quantitative Analysis Select [Use Template] and select the format [Quantitative Analysis Report]. Click [OK]. The [Quantitative Analysis Report] format opens. Click the [Preview] icon on the [Data Report] assistant bar. The print preview window opens. GCMS-QP2010 Series Operation Guide...
- Page 89 5.4 Printing Quantitative Analysis Reports After checking the report content, click [Print] to print the report. Click (Save) on the toolbar. The report is saved as a data file. GCMS-QP2010 Series Operation Guide...
-
Page 90: Shutting Down Gc/Ms
Shutting Down GC/MS Vacuum System Shutdown Click the [Vacuum Control] icon on the [Real Time] assistant bar. The [Vacuum Control] window opens. Click [Auto Shutdown]. The vacuum system shuts down. When [Completed] is displayed, click [Close]. GCMS-QP2010 Series Operation Guide... -
Page 91: Turning Off The Power
Quit the [GCMS Real Time Analysis] program and all other programs that are running. Turn OFF the power to the PC, printer, and display. Turn OFF the power to the MS unit. Turn OFF the power to the GC unit. GCMS-QP2010 Series Operation Guide... -
Page 92: File Format
Library file .lib These files are used to register the compound information and spectral data used to perform similarity searches. The libraries consist of public libraries (e.g., NIST and Wiley) and private libraries. GCMS-QP2010 Series Operation Guide... -
Page 93: Appendix B Viewing Help
B.1.2 Displaying Help from the Menu Bar Click [Contents] on the [Help] menu displayed in the menu bar of a window to display the [GCMS Help window]. Searching from the [Contents] Tab Double-click the applicable topic. GCMS-QP2010 Series Operation Guide... -
Page 94: Displaying Help With The F1 Key
The search results are displayed. Select the applicable topic and click [Display]. Details on the selected topic are displayed. B.1.3 Displaying Help with the F1 Key Press the [F1] key on the keyboard. Help for the open window is displayed. GCMS-QP2010 Series Operation Guide... -
Page 95: Appendix C Using Data Explorer
Click [Close] to close the [Project (Folder) Selection] window. Click a tab to display the file of the corresponding type. Click a file name (6) to display the corresponding file information. Double-click the appropriate file to load the data. GCMS-QP2010 Series Operation Guide... - Page 96 (calibration curve already created) (calibration curve already created) calibration curve. Batch File Batch File Create a new project from Data files for standard samples used to Folder A. create calibration curves and samples with unknown concentrations GCMS-QP2010 Series Operation Guide...
-
Page 97: Appendix D Maintenance
Navigator] window using the procedure described below. Double-click the (GCMS Real Time Analysis) icon. The [GCMS Real Time Analysis] program starts. Select [Maintenance] on the [Help] menu. The [MS Navigator] window opens. Click on the instrument for which maintenance will be performed. GCMS-QP2010 Series Operation Guide... - Page 98 D Maintenance Read the precautionary information carefully and then click the applicable item under the maintenance menu. GCMS-QP2010 Series Operation Guide...
-
Page 99: Easy Stop
70 °C or below. Consequently, it can take about 30 minutes until glass inserts and septa can be replaced. Double-click one of the icons for consumables in the instrument monitor. The [Consumable] tab page opens in the [Monitor Settings] window. GCMS-QP2010 Series Operation Guide... - Page 100 When each temperature reaches 70 °C or lower, the "Ready" status is displayed in the [Easy sTop] window. Click [Replace], then replace septa or glass inserts in the sample injection unit. For replacement procedures, refer to the septum replacement procedure or insert replacement procedure in the [MS Navigator] window. GCMS-QP2010 Series Operation Guide...
-
Page 101: Reset Procedure For Usage Frequencies And Usage Times ^ Ver.2.5
After replacing a consumable item or cleaning the ion source, reset the usage frequencies and usage times using the procedure described below. Double-click one of the icons for consumables in the instrument monitor. The [Consumable] tab page opens in the [Monitor Settings] window. GCMS-QP2010 Series Operation Guide... - Page 102 Click [Clear] for the consumable items subjected to maintenance or input "0" in the usage time cells as appropriate, and click [OK]. The previous window returns. Click [OK] in the [Monitor Settings] window. The window closes. GCMS-QP2010 Series Operation Guide...
-
Page 103: Changing Replacement Guidelines For Septa And Glass Inserts
Glass insert replacement frequency varies depending on the sample. Set replacement guidelines based on the sample. Click the [System Configuration] icon on the [Real Time] assistant bar. The [System Configuration] window opens. Double-click [SPL1] under [Modules Used for Analysis]. The [Modules of Analytical Line #1] window opens. GCMS-QP2010 Series Operation Guide... - Page 104 The [Injection Port Maintenance (SPL1)] window opens. Input [Septum Used Counts] and [Insert Used Counts] settings. To restore default settings, click [Default]. Click [OK]. The [Modules of Analytical Line #1] window returns. Click [OK]. The [System Configuration] window returns. GCMS-QP2010 Series Operation Guide...
- Page 105 D.4 Changing Replacement Guidelines for septa and Glass Inserts Click [Set]. The replacement guidelines for septa and glass inserts are changed. GCMS-QP2010 Series Operation Guide...
-
Page 106: Single Analysis (Manual Injection)
Start the [GCMS Real Time Analysis] program, then click the [Data Acquisition] icon on the [Real Time] assistant bar. The [Acquisition] window opens. Double-click the method file to be used in Data Explorer. Click the [Sample Login] icon on the [Acquisition] assistant bar. GCMS-QP2010 Series Operation Guide... - Page 107 Inject the sample and press the [START] button on the keyboard at the GC unit. If using accessory/peripheral equipment, start such equipment first, then click the (Start) icon. To abort analysis before completion, click the (Stop) icon on the [Acquisition] assistant bar. GCMS-QP2010 Series Operation Guide...
-
Page 108: Appendix F Index Searches
Click [Open Library] on the [File] menu to open the library to be used. The library opens. Click the second row cell in the [Index] column to select an item. Enter information for the index item in the [Parameter] column for the row where the index item was selected. GCMS-QP2010 Series Operation Guide... - Page 109 Click [Start] on the [Index Search] menu. The results are displayed. Add index items until the target compound is found. Confirm the applicable information (e.g., spectrum or structure). GCMS-QP2010 Series Operation Guide...
-
Page 110: Appendix G Displaying Chromatograms
The [MC Fragment Table] window opens. Enter the applicable values in the [m/z] and [Factor] columns, select the corresponding cells in the [Disp.] column, and click [OK]. A mass chromatogram is displayed in the MC window. GCMS-QP2010 Series Operation Guide... - Page 111 G.1 Displaying Chromatograms from Fragment Tables The display can be changed as shown below by enabling/disabling [Base Shift] in the table. • With Base Shift • Without Base Shift GCMS-QP2010 Series Operation Guide...
-
Page 112: Displaying Chromatograms From Mass Spectra
• To hide the mass chromatogram, deselect the applicable cell in the [Disp.] column in the [MC Fragment Table] window. • To undo enlarging, right-click on the mass spectrum and select [Undo Zoom] on the menu that appears. GCMS-QP2010 Series Operation Guide... -
Page 113: Editing Batch Files
When analyses are in progress, both the [Batch Table] window and [Acquisition] window are displayed. To switch to the [Batch Table] window, click on the table. Analysis of rows currently being analyzed will continue to be executed. GCMS-QP2010 Series Operation Guide... - Page 114 The vial number, data file name, or other information can be changed as well. Click (Save) on the toolbar. Click the [Pause/Restart] icon on the [Batch] assistant bar. The analysis restarts. Some accessory/peripheral equipment may prevent using this function. GCMS-QP2010 Series Operation Guide...
-
Page 115: Adding Batch Files (Batch Queue)
Creating Batch Files to Add Double-click the (GCMS Analysis Editor) icon. The [GCMS Analysis Editor] program starts. Click the [Batch Processing] icon on the [Real Time] assistant bar. The [Batch Table] window opens. Create the batch file to be added. GCMS-QP2010 Series Operation Guide... -
Page 116: Adding Batch Files
• The batch queue is not activated until the [GCMS Analysis Editor] program is closed. H.2.2 Adding Batch Files Start the [GCMS Real Time Analysis] program. During analysis, both the [Acquisition] and [Batch Table] windows are displayed simultaneously. [Batch Table] Window [Acquisition] Window GCMS-QP2010 Series Operation Guide... - Page 117 H.2 Adding Batch Files (Batch Queue) Click the [Batch Table] window. The content of the toolbar, menu bar, and assistant bar changes. Select [Batch Queue] on the [Batch] menu. The [Batch Queue] window opens. GCMS-QP2010 Series Operation Guide...
- Page 118 If multiple batch files were added, change their order by clicking to select the desired batch file, then clicking [Move Up] or [Move Down]. Files are executed consecutively from the top. When finished editing, click [OK]. GCMS-QP2010 Series Operation Guide...
-
Page 119: Appendix I Reducing The Carrier Gas Flow Rate After Sequential
As an example, the following describes how to create a method file that reduces the total flow rate to 20 mL/min. Start the [GCMS Real Time Analysis] program, then in Data Explorer, double-click the method file to be used for sequential analysis. GCMS-QP2010 Series Operation Guide... -
Page 120: Creating Batch Files
Change [Total Flow] to 20 mL/min, then name and save the method file. I.1.2 Creating Batch Files Click the [Batch Processing] icon on the [Real Time] assistant bar. The [Batch Table] window opens. In Data Explorer, double-click the batch file to be used for sequential analysis. GCMS-QP2010 Series Operation Guide... - Page 121 Right-click on the batch table and select [Table Style] on the menu that appears. The [Table Style] window opens. Click [Run Mode] in the [Hide Items] list, then click [Add>>] and [OK]. A [Run Mode] column is added to the end of the batch schedule. GCMS-QP2010 Series Operation Guide...
- Page 122 Name and save the batch file, then click the [Start] icon on the [Batch] assistant bar. This results in loading the method file that reduces flow rate after the analysis for the seventh row is finished, which ends the sequential analysis with the carrier gas flow rate at 20 mL/min. GCMS-QP2010 Series Operation Guide...
-
Page 123: Ecology Mode
[GCMS Real Time Analysis] to perform operations in other windows. To cancel the ecology mode, click [Cancel] in the [Ecology Mode] window. When the ecology mode is canceled, settings before switching to the ecology mode are restored. GCMS-QP2010 Series Operation Guide... -
Page 124: Setting The Mode Using Batch Processing
This allows switching the instrument to the ecology mode after the entire sequential analysis is finished. Click the [Batch Processing] icon on the [Real Time] assistant bar. The [Batch Table] window opens. Create and save a batch file. GCMS-QP2010 Series Operation Guide... - Page 125 [GCMS Real Time Analysis] to perform operations in other windows. To cancel the ecology mode, click [Cancel] in the [Ecology Mode] window. When the ecology mode is canceled, settings before switching to the ecology mode are restored. GCMS-QP2010 Series Operation Guide...
-
Page 126: Printing Reports
Call up the applicable data in the [Data Analysis] window in the qualitative or quantitative processing modes of the [GCMS Postrun Analysis] program. Display the chromatogram and mass spectrum in the window in the way desired for the report. GCMS-QP2010 Series Operation Guide... - Page 127 J.1 Printing Images (Printing Spectra and Chromatograms Displayed in Windows) Point to [Print Image] on the [File] menu and select [Edit Format]. The [Report] window opens. Adjust the size as necessary. GCMS-QP2010 Series Operation Guide...
-
Page 128: Creating Reports
The same report is output for both the qualitative and quantitative windows. Click the (Report) icon on the [Qualitative] or [Quantitative] assistant bar. The [Data Report] window opens. J.2.1 Using Templates Select [New Format File] on the [File] menu. GCMS-QP2010 Series Operation Guide... -
Page 129: Using Previously Created Report Files
If this selection window is not displayed, select [Option] on the [Tool] menu to display the [Setting Options] window and, on the [File New] tab, select [Prompt on File New] for the report format file. J.2.2 Using Previously Created Report Files In Data Explorer, double-click the report file to be used. GCMS-QP2010 Series Operation Guide... -
Page 130: Manually Setting Report Content
Select to print the tuning results obtained when data acquisition is executed. Library search Select to print the library search results obtained for the mass spectra registered in spectrum tables. • Searches must be performed in the spectrum tables. GCMS-QP2010 Series Operation Guide... - Page 131 The properties window for the item being laid out opens. Drag mouse diagonally Set [Properties] and click [OK]. ^ Reference Refer to Help for details on property settings. To display a properties window again, double-click on the corresponding item. GCMS-QP2010 Series Operation Guide...
- Page 132 After the checking the report content, click [Print] to output the report. Select [Save Format File As] on the [File] menu to name and save the report file. This allows loading the report format in the future to create reports easily. GCMS-QP2010 Series Operation Guide...
Need help?
Do you have a question about the GCMS-QP2010 Series and is the answer not in the manual?
Questions and answers