Table of Contents
Advertisement
Quick Links
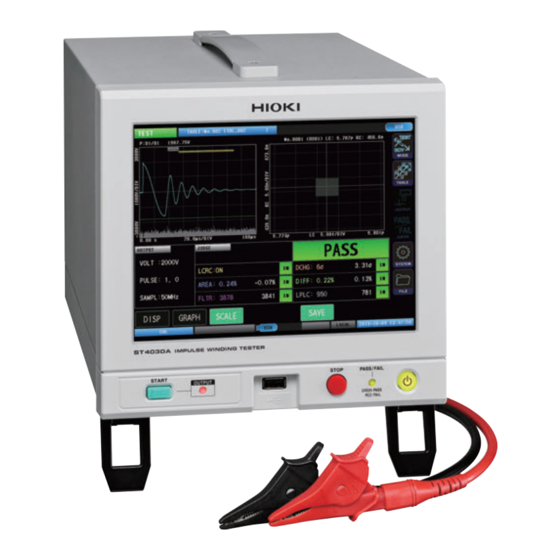
ST4030
ST4030A
IMPULSE WINDING TESTER
Be sure to read this manual before using the instrument.
When using the instrument for the
first time
Parts Names and Functions
Communication Command
Instruction Manual
Dec. 2019 Revised edition 2
ST4030A961-02 19-12H
Troubleshooting
p.8
Maintenance and Service
CD
Error Display and Solution
Instruction Manual
p.5
p.207
p.214
EN
Advertisement
Table of Contents

Related Manuals for Hioki ST4030A


Summary of Contents for Hioki ST4030A
- Page 1 ST4030 ST4030A Instruction Manual IMPULSE WINDING TESTER Be sure to read this manual before using the instrument. p.5 When using the instrument for the Troubleshooting first time Parts Names and Functions Maintenance and Service p.207 Communication Command Error Display and Solution p.214...
- Page 3 Measurement Flowchart The basic measuring flow is as described below. Preparation See “2 Preparation for Measurements” (p. 1 3) Master workpiece Workpiece (known-good winding) under test Setting Test Conditions and Judgment Conditions [SETTING] Select in test conditions settings mode. (p. 1 8) Select the settings table that will acquire the master waveform.
- Page 4 Calibrate the voltage and acquire the master waveform. (p. 4 9) Set the judgment criteria. (p. 5 3) Implementing tests [TEST] Select in test mode. (p. 1 8) Select the settings table that acquired the master waveform to be used in the test (p. 2 9) Connect the workpiece under test to the test lead.
-
Page 5: Table Of Contents
Contents Introduction Table Deletion ............1 ........31 Notations Changing the Table Name ............2 ....32 Confirming Package Contents Table Copying ......3 ........33 Options (Sold separately) ........4 Setting the Test Usage Notes ............5 Conditions Overview Overview ..........35 Overview ..........7 Operations flowchart in test conditions Features ...........7 settings mode... - Page 6 Contents Displays Threshold value of the test waveform ..........111 discharge amount over the master Graph Display Settings ......112 ...... 74 waveform discharge amount Overlay settings ........112 Deviation threshold value of the test ......113 Waveform color settings ...... 75 waveform discharge amount LC and RC graph scale settings ....
- Page 7 Contents ......186 Deleting files and folders Communications Creating folders ........187 Interface .. 188 Changing the folder name and file name Information display ........189 11.1 Overview ..........146 Specifications ......... 146 Screen display 11.2 Specifications ........147 ..........147 RS-232C 13.1 General Specifications .......191 GP-IB...
- Page 8 Contents Appendix 15.1 Block Diagram ........221 15.2 Circuit Configuration ......222 ....222 Circuit operations during tests ..223 Effects of cable parasitic components 15.3 Rack Mount .........224 ......225 Metal fitting dimensions Installation method ........227 15.4 Dimensions Diagram ......229 15.5 Repeat Accuracy (Reference Value) Reproducibility of the voltage generated ..
-
Page 9: Introduction
Introduction Introduction Thank you for choosing the Hioki ST4030, ST4030A Impulse Winding Tester. Preserve this manual carefully and keep it handy to make full use of this instrument for a long time. Read the separate document “Operating Precautions” carefully before using the instrument. -
Page 10: Notations
Notations Notations Safety symbols In this document, the risk seriousness and the hazard levels are classified as follows. Indicates a potentially hazardous situation that may result in death or serious WARNING injury to the operator. Indicates a potentially hazardous situation that may result in minor injury to the CAUTION operator or damage to the instrument or malfunction. -
Page 11: Confirming Package Contents
When you receive the instrument, inspect it carefully to ensure that no damage occurred during shipping. In particular, check the accessories, panel switches, and connectors. If damage is evident, or if it fails to operate according to the specifications, contact your authorized Hioki distributor or reseller. -
Page 12: Options (Sold Separately)
Options (Sold separately) The following options are available for the instrument. To purchase an option, please contact your authorized Hioki distributor or reseller. Options are subject to change. Please check Hioki’s website for the latest information. Model ST9000 Discharge Detection Upgrade (Optional when shipped from factory) ... -
Page 13: Usage Notes
• Keep discs inside a protective case and do not expose them to direct sunlight, high temperature, or high humidity. • Hioki is not liable for any issues your computer system experiences in the course of using this disc. Test lead CAUTION •... - Page 14 Usage Notes...
-
Page 15: Overview
The condition is called a “layer short circuit”. The ST4030, ST4030A Impedance Winding Tester not only compares and judges waveform conformance through comparisons with existing response waveforms, but also detects layer short circuits using judgment methods that employ the rendering of response waveforms as numerical values (LC and RC values). -
Page 16: Parts Names And Functions
Parts Names and Functions 1.3 Parts Names and Functions Front Rear Bottom... - Page 17 Parts Names and Functions Name Function Reference Display 8.4-inch color TFT liquid crystal display. p. 10 Comes with a resistant film touch panel. START button Starts measurements. p. 77 OUTPUT lamp Shows the voltage Red: Voltage is being applied p. 84 application status.
-
Page 18: Screen Operations
Screen Operations 1.4 Screen Operations The instrument uses a touch panel for all settings and changes to the measuring conditions. Gently touch the onscreen keys to select the items and values set for those keys. CAUTION Do not press the touch panel forcefully or jab it with the point of a hard object. Doing so may cause a malfunction. -
Page 19: Moving Windows
Screen Operations Moving windows Press and hold the window title bar while dragging the window to move the window to a new position. Window title bar Touch keyboard inputs [SET] to confirm. To cancel, tap [CANCEL]. Enter text and then tap Moves the cursor to the left. -
Page 20: Screen Configuration
Screen Operations Screen configuration The instrument settings windows are configured using the following stages. Measurement screen MODE SETTING VOLT OUTPUT PULSE SAMPLING DELAY JUDGE LCRC AREA DISCHARGE AREA DIFF AREA FLUTTER LAPLACIAN TEST OUTPUT START NONE STEP PULSE SAMPLING TABLE LCRC AREA JUDGE DISCHARGE... -
Page 21: Preparation For Measurements
Preparation for Measurements Make sure to read through both “Usage Notes” (p. 5) in this manual and the separate “Operating Precautions” before starting the preparations that precede measuring. For rack mounts, see “15.3 Rack Mount” (p. 224). Installing the device. p. -
Page 22: Connecting The Test Lead (On The St4030)
Connecting the Test Lead (on the ST4030) 2.1 Connecting the Test Lead (on the ST4030) Connect the test lead to the voltage output terminal on the instrument. CAUTION • To prevent damage to the coaxial connectors or joint, make sure to unlock first, and grasp the coaxial connector and pull it out. -
Page 23: Connecting The Power Cord
Connecting the Power Cord 2.2 Connecting the Power Cord To supply power to the instrument, connect the power cord to the power supply inlet on the rear of the instrument. WARNING Before turning on the power supply, check that the power supply voltage described on the power supply connector on the instrument and the power supply voltage to be used match each other. -
Page 24: Power Supply On/Off
Power Supply ON/OFF 2.3 Power Supply ON/OFF Turn ON the main power supply on the rear of the instrument beforehand to enable turning ON and OFF the power supply using the startup button on the front. This is convenient if incorporating the instrument into an automated machine or assembly line. -
Page 25: Sleep Mode
Power Supply ON/OFF Sleep mode This is the mode in which the device power supply is OFF. Only the circuit that turns on the startup button lamp is operating. With the main power supply switch turned ON, press and hold the startup button for approx. 2 sec. -
Page 26: Select Measuring Mode
Select Measuring Mode 2.4 Select Measuring Mode [MODE] in the measurement screen to display the measuring mode selection window. Choose from 4 types of measuring mode. [SETTING] Test conditions settings mode Sets the test conditions, sets the judgment conditions, and acquire the master waveforms. -
Page 27: Inspecting Before Measurement And Verifying Operations
Inspection Before using the instrument for the first time, verify that it operates normally to ensure that no damage occurred during storage or shipping. If you find any damage, contact your authorized Hioki distributor or reseller. This may cause electric shock or short circuit, Is the sheath of the cable so replace with an undamaged cable. -
Page 28: Checking The Voltage Generated
Implement the test with nothing connected to the voltage output terminal. Check that the peak voltage (value displayed on the instrument) is below. ST4030: 3300 V±2% ST4030A: 4200 V±2% IMPORTANT Contact your authorized Hioki distributor or reseller if the peak voltage differs from the set voltage by 2% or greater. -
Page 29: Checking The Impulse Response Waveforms
Inspecting before Measurement and Verifying Operations Checking the impulse response waveforms Implement impulse testing on the inspection master workpiece to check that there are no abnormalities in the instrument or equipment. Set the test conditions according to the workpiece. Tools to be prepared Master workpiece (a workpiece close to the mass production master workpiece, or a coil of approx. - Page 30 Inspecting before Measurement and Verifying Operations (2) Waveform reproducibility is poor. Periods of magnetic saturation reduces the workpiece inductance, so the vibration frequency of the response waveform increases (i.e., inclination is more sudden). The waveform may experience major variation when multiple impulse tests are performed on the same workpiece because of the magnetic characteristics of the core.
- Page 31 Prepare a new master workpiece, and implement voltage calibration. (4) Test lead insulation is worn. Prepare a new test lead, and implement voltage calibration. IMPORTANT If none of these apply, there is a risk that the instrument is damaged. Contact your authorized Hioki distributor or reseller.
- Page 32 Inspecting before Measurement and Verifying Operations...
-
Page 33: Overview
Switching Test Conditions (Table Functions) 3.1 Overview • The test conditions, judgment conditions, and master waveform are saved to the instrument’s internal memory as settings tables. A maximum of 255 settings tables (No. 001 to No. 255) can be created. •... -
Page 34: Items That Can Be Saved
Overview Items that can be saved The following items can be saved to settings tables. Test conditions settings VOLT Applied voltage PULSE No. of applied pulses, No. of degaussing pulses, min. interval between pulse outputs SAMPLING Sampling frequency, No. of sampling data DELAY Trigger delay Judgment conditions settings... -
Page 35: Operations Flowchart In Test Conditions Settings Mode And Test Mode
Overview Operations flowchart in test conditions settings mode and test mode In test conditions settings mode and test mode, select the table to be used before you move on to the next operation, by using the operations procedure as shown in the diagram. Test conditions Test mode settings mode... -
Page 36: Screen Configuration
Overview Screen configuration (Measurement screen) [MODE] > [SETTING] [TEST] > [TABLE] Current table number Number and name of the (current) table that is presently set. Table name Tables list List of the tables that have been saved. The table in which the characters are light blue is the present table. Scroll bar Drag to scroll the table. -
Page 37: Current Table Selection
Current Table Selection 3.2 Current Table Selection Sets the table used as the test conditions as the current table (i.e., the table to be used from now on). (Measurement screen) [MODE] > [SETTING] [TEST] > [TABLE] Tap the table that is to be set as the current table. The table selected will be surrounded by a yellow frame. - Page 38 Table Initialization 3.3 Table Initialization Restores the settings details of the selected table to their default values. Also deletes the master waveform. Reference: “Default settings table” on the application disc [MODE] [SETTING] [TABLE] (Measurement screen) > > Tap the table. Tap [INIT].
- Page 39 Table Deletion 3.4 Table Deletion Deletes the settings details from unnecessary tables. After deletion, the [TABLE NAME] displayed as [– – –]. (Measurement screen) [MODE] > [SETTING] > [TABLE] Tap the table to be deleted. Tap [DELETE]. The confirmation window will be displayed. Tap [OK].
-
Page 40: Changing The Table Name
Changing the Table Name 3.5 Changing the Table Name Changes the name of the table saved to the instrument. [MODE] [SETTING] [TABLE] (Measurement screen) > > Tap the table whose name you want to change. Tap [RENAME]. Enter the new name of the table. Reference: “Touch keyboard inputs”... - Page 41 Table Copying 3.6 Table Copying You can copy the table that has been created and paste it to your chosen table. (Measurement screen) [MODE] > [SETTING] > [TABLE] Tap the table to be copied. Tap [COPY]. Tap the table to be pasted. Tap [PASTE].
- Page 42 Table Copying...
-
Page 43: Setting The Test Conditions
Setting the Test Conditions 4.1 Overview Use the master workpiece to set the test conditions in order to judge whether or not the workpiece to be tested is defective. In test conditions settings mode, set the output conditions and the judgment conditions such as the pulse to be applied, etc., and acquire the master waveform. -
Page 44: Screen Configuration
Overview Screen configuration Measurement screen Graph display Displays the waveform graph and the LC and RC graph. Reference: “Graph display (display graph switching)” (p. 37) Menu icons [MODE]: See “2.4 Select Measuring Mode” (p. 18) [TABLE]: See “3.2 Current Table Selection” (p. 29) [OUTPUT]: See “4 Setting the Test Conditions”... - Page 45 Overview Graph display (display graph switching) Waveform graph display Displays the waveform graph only. Number of applied pulses and [P:XX/XX]: Number of pulses that have been applied/Total number of peak voltage display pulses [xxxV]: Max. peak voltage value of the response waveform Waveform judgment area and Blue: AREA judgment area LC and RC values operation...
- Page 46 Overview LC and RC graph display Displays only the LC and RC graph. LC and RC graph Blue (dots): Latest LC and RC values Yellow (dots): Imported LC and RC values master data Gray (solid): LC and RC values PASS judgment area Note: Dotted colors operate in tandem with the waveform colors.
- Page 47 Overview Display the waveform graph and the LC and RC graph Displays the waveform graph and the LC and RC graph simultaneously.
- Page 48 Overview Instrument status display and error display Current measurement Voltage application disabled mode mode display Test conditions settings mode Test mode BDV mode Current table display Displays the number and table name of the table presently being used. Communications Displays the settings for the communications interface presently being interface settings display used.
-
Page 49: Applied Voltage
> > > Set the applied voltage value. Settings range: ST4030: 100 V to 3300 V (resolution: 10 V) ST4030A: 100 V to 4200 V (resolution:10 V) Increases by 1. Decreases by 1. Sets to the default values. -
Page 50: Number Of Applied Pulses
Number of Applied Pulses 4.3 Number of Applied Pulses Sets the number of test pulses to be used in the tests and the number of degaussing pulse applications to eliminate magnetic fields from the workpiece. Both the test pulses and degaussing pulses continue to be applied until their set number is reached. - Page 51 Number of Applied Pulses (Measurement screen) [MODE] > [SETTING] > [OUTPUT] > [PULSE] Set the number of test pulses. Setting range: 1 to 32 Increases by 1. Decreases by 1. Sets to the default values. Set the number of degaussing pulses. Setting range: 0 to 10 Increases by 1.
-
Page 52: Sampling Frequency/Number Of
Sampling Frequency/Number of Sampling Data 4.4 Sampling Frequency/Number of Sampling Data Sets the voltage sampling frequency and the number of sampling data to be imported to the instrument. Sets the voltage sampling frequency. If a sufficiently long response waveform cannot be imported because SAMPLING the response waveform vibration period is long, you can extend the (Sampling frequency) - Page 53 Sampling Frequency/Number of Sampling Data (Measurement screen) [MODE] > [SETTING] > [OUTPUT] > [SAMPLING] Set the sampling frequency. Setting range: 10 MHz, 20 MHz, 50 MHz, 100 MHz, 200 MHz Slows the sampling frequency. Accelerates the sampling frequency. Set the number of sampling data.
-
Page 54: Automatic Settings For Range Of Waveform Acquisition
Sampling Frequency/Number of Sampling Data Automatic settings for range of waveform acquisition You can automatically adjust and set the sampling frequency and number of sampling data during voltage calibration so that the waveform acquisition range is optimal. [MODE] [SETTING] [OUTPUT] [SAMPLING] (Measurement screen) >... -
Page 55: Trigger Delay
Trigger Delay 4.5 Trigger Delay Sets the delay time (trigger delay) from the start of measuring to the application of the first pulse. If using this function, you can start measuring after the workpiece connection status has stabilized even if trigger timing and probing timing are the same when combined in the equipment. Trigger delay Pulse application Trigger... - Page 56 Trigger Delay (Measurement screen) [MODE] > [SETTING] > [OUTPUT] > [DELAY] Set the trigger delay. Setting range: 0.000 s to 9.999 s (resolution: 0.001 s) Increases by 1. Decreases by 1. Sets to the default values. 10‑KEY Displays the numeric keypad.
-
Page 57: Voltage Calibration
Voltage Calibration 4.6 Voltage Calibration Calibrates the voltages after the test conditions settings are finished. Voltage calibration adjusts the output voltage so that the set voltage is applied to the workpiece, and then imports the master waveform using the output voltage after making the adjustments. Items implemented using voltage calibration Gradually raise and adjust the output voltage so that the max. - Page 58 Voltage Calibration (Measurement screen) [MODE] > [SETTING] > [OUTPUT] CAL]. The settings window will open. Select the calibration type. TYPE1 If the instrument determines that the entire workpiece response waveform can be measured using more appropriate settings by adjusting the sampling frequency and sampling data count, either “INFORMATION 1021”...
-
Page 59: Setting Judgment Conditions
Setting Judgment Conditions 5.1 Overview Applies a set impulse voltage using voltage calibration to the workpiece to be tested, and compares the response waveform, LC and RC values, and discharge composition amount to the master workpiece data to judge whether or not the workpiece being tested conforms to quality. LC and RC values judgments Waveform judgments Discharge judgments... -
Page 60: Settings Operations Procedure
Overview Settings operations procedure Imports the master workpiece waveform as the master waveform, and sets the threshold values for each judgment function from the master waveform. Turns ON the [ENABLE] settings for the Test conditions judgment functions to be used. (p. 55) settings mode •... -
Page 61: Lc And Rc Values Area Judgments [Lcrc Area]
LC and RC Values Area Judgments [LCRC AREA] 5.2 LC and RC Values Area Judgments [LCRC AREA] What are LC and RC values? The equivalence circuit for the impulse tests is viewed as a LCR linear equivalence circuit as shown in the diagram below, and is the value that was quantified as the 2 parameters of “L*C”... - Page 62 LC and RC Values Area Judgments [LCRC AREA] LC and RC values judgments Test conditions settings mode The PASS judgment area is created based on multiple LC and RC values imported from the master workpiece after voltage calibration has been implemented. LC and RC graph (Test conditions settings mode) Yellow dots: Imported LC and RC master values...
-
Page 63: Enabling The Lc And Rc Values Judgments Function
LC and RC Values Area Judgments [LCRC AREA] Enabling the LC and RC values judgments function (Measurement screen) [MODE] > [SETTING] > [JUDGE] > [LCRC AREA] Tap [ENABLE], and turn [ON] the LC and RC values area operation functions. Tap [JUDGE], and turn [ON] the LC and RC values judgments functions. -
Page 64: Importing Lc And Rc Master Values
LC and RC Values Area Judgments [LCRC AREA] Importing LC and RC master values Implement voltage calibration and import the master waveform before importing multiple LC and RC values as the master values. Test while implementing voltage calibration to save the LC and RC values acquired for each test as master values to the instrument. - Page 65 LC and RC Values Area Judgments [LCRC AREA] LC and RC cursor values [No.XXX]: Master data number of the cursor value. [(XXX)]: Total number of master data that have been imported. [DELETE] Deletes the master data for the LC and RC values shown by the cursor. Reference: “Importing LC and RC master values”...
-
Page 66: Auto Creation Of The Pass Judgment Area
LC and RC Values Area Judgments [LCRC AREA] Auto creation of the PASS judgment area The PASS judgment area is created automatically from the imported LC and RC master values. (Measurement screen) [MODE] > [SETTING] [CREATE] (on the measurements screen). [AREA TYPE] to set the shape of the area when the PASS judgment area is created automatically. - Page 67 LC and RC Values Area Judgments [LCRC AREA] Tap [CREATE]. The PASS judgment area is created automatically. The PASS judgment area that has been created is displayed in a gray square on the LC and RC graph. IMPORTANT • When the margin is 0%, the distribution of the imported LC and RC master values remain unchanged, and a PASS judgment area is created for the distribution to act as the PASS judgment area threshold values.
-
Page 68: Manually Creating The Pass Judgment Area
LC and RC Values Area Judgments [LCRC AREA] Manually creating the PASS judgment area You can set the PASS judgment area manually. You can manually micro-adjust the PASS judgment area after auto creation. (Measurement screen) [MODE] > [SETTING] > [JUDGE] >... - Page 69 LC and RC Values Area Judgments [LCRC AREA] Use the numeric keypad to enter the threshold values. Settings range: ±(0.000 f to 1.000) (effective number of digits: 4) Clear the entered value. − Enter a minus sign. Multiplies the entered value by ×1000. Multiplies the entered value by ×1/1000.
-
Page 70: Waveform Judgments
Waveform Judgments 5.3 Waveform Judgments Surface area comparison judgments [AREA] Compares the master waveform surface area and the test waveform surface area in the area specified by the user and judges whether the workpiece being tested conforms by the extent of the difference. - Page 71 Waveform Judgments Setting the surface area comparison judgment threshold value (Measurement screen) [MODE] > [SETTING] > [JUDGE] > [AREA] Tap [LIMIT]. Use the numeric keypad to enter the surface area comparison threshold value. Settings range: 0.00% to 99.99% (resolution: 0.01%) Surface area comparison value operations are implemented, but judgments are not.
-
Page 72: Differential Surface Area Comparison Judgments [Diff Area]
Waveform Judgments Differential surface area comparison judgments [DIFF AREA] Calculates the surface area surrounded by the master waveform and test waveform in the user- designated area to judge whether the test workpiece within that area conforms. The surface area surrounded by the master and test waveforms in the judgment area (surface area in a solid orange color) is calculated as shown in the “Differential surface area calculation example”... - Page 73 Waveform Judgments Setting the differential surface area comparison judgment threshold value [MODE] [SETTING] [JUDGE] [DIFF AREA] (Measurement screen) > > > Tap [LIMIT]. Use the numeric keypad to enter the threshold values. Settings range: 0.00% to 99.99% (resolution: 0.01%) Differential surface area comparison value operations are implemented, but judgments are not. [SET] to confirm.
-
Page 74: Flutter Detection Judgments [Flutter]
Waveform Judgments Flutter detection judgments [FLUTTER] The amount of the high-frequency component expressed by the test waveform in the user- designated area is detected, and the size of the amount used to judge the discharge. The response waveform is primarily differentiated and the surface area of the differentiated waveform calculated as the amount of the high-frequency component. - Page 75 Waveform Judgments Enabling waveform flutter detection judgment functions [MODE] [SETTING] [JUDGE] [FLUTTER] (Measurement screen) > > > Tap [ENABLE], and turn [ON] the flutter detection judgment functions. Setting the flutter detection judgment threshold values [MODE] [SETTING] [JUDGE] [FLUTTER] (Measurement screen) >...
- Page 76 Waveform Judgments Setting the flutter detection judgment area [MODE] [SETTING] [JUDGE] [FLUTTER] (Measurement screen) > > > Judgment area bar You can change the judgment area by dragging the lines of the start and end points. Moves 1 point. / [END]: End point Moves 100 points.
-
Page 77: Secondary Differential Detection Judgments [Laplacian]
Waveform Judgments Secondary differential detection judgments [LAPLACIAN] The amount of the high-frequency component expressed by the test waveform in the user- designated area is detected, and the size of the amount used to judge the discharge. The response waveform is secondarily differentiated and the surface area of the differentiated waveform calculated as the amount of the high-frequency component. - Page 78 Waveform Judgments Setting the secondary differential detection judgment threshold values [MODE] [SETTING] [JUDGE] [LAPLACIAN] (Measurement screen) > > > Tap [LIMIT]. Enter the secondary differential detection judgment threshold values. Setting range: 0 to 999,999 (resolution: 1) Laplacian value operations are implemented, but judgments are not. [SET] to confirm.
-
Page 79: Waveform Judgment Area And Judgment Threshold Value Automatic Settings Functions
Waveform Judgments Waveform judgment area and judgment threshold value automatic settings functions Waveform judgment areas and judgment threshold values are set automatically by the instrument based on the waveform and variability at the set voltage during voltage calibration so as to optimize judgment settings for waveform judgment functions. -
Page 80: Discharge Judgments (When Incorporating Model St9000)
Discharge Judgments (When Incorporating Model ST9000) 5.4 Discharge Judgments (When Incorporating Model ST9000) Noise manifesting at a fixed level in the overall waveform among the high-frequency components manifesting in the test waveform is eliminated, and only the amount of the partial discharge components manifesting locally are sampled and judged. -
Page 81: Discharge Judgment Methods [Discharge]
Discharge Judgments (When Incorporating Model ST9000) Discharge judgment methods [DISCHARGE] (Measurement screen) [MODE] > [SETTING] > [JUDGE] > [DISCHARGE] Tap [ENABLE], and turn [ON] the discharge judgment methods. Disables the Discharge Detection Upgrade. FIXED Compares the amount of the discharge component of the master waveform and the amount of the discharge component of the test waveform. -
Page 82: Threshold Value Of The Test Waveform Discharge Amount Over The Master Waveform Discharge Amount
Discharge Judgments (When Incorporating Model ST9000) Threshold value of the test waveform discharge amount over the master waveform discharge amount When the judgment method is [FIXED] (Measurement screen) [MODE] > [SETTING] > [JUDGE] > [DISCHARGE] Tap [LIMIT]. Enter the threshold value of the test waveform discharge amount over the master waveform discharge amount. -
Page 83: Deviation Threshold Value Of The Test Waveform Discharge Amount
Discharge Judgments (When Incorporating Model ST9000) Deviation threshold value of the test waveform discharge amount When the judgment method is [AUTO] (Measurement screen) [MODE] > [SETTING] > [JUDGE] > [DISCHARGE] Tap [LIMIT]. Enter the deviation threshold value of the test waveform discharge amount. Setting range: 3σ... -
Page 84: Setting The Discharge Amount Judgment Area
Discharge Judgments (When Incorporating Model ST9000) Setting the discharge amount judgment area Sets the extend of the the response waveform for the discharge judgment to target. Shorten the judgment area to reduce the operations time. (Measurement screen) [MODE] > [SETTING] >... -
Page 85: Implementing Tests
Implementing Tests 6.1 Overview Calls the master waveform that has been set using test conditions settings mode, and tests the workpiece to be tested. The text results are output to the screen, communications, and external control terminal (EXT. I/O). Operations flowchart in test mode In test mode, select the master waveform and implement the test, by using the operations procedure as shown in the diagram. -
Page 86: Screen Configuration
Overview Screen configuration Measurement screen Graph display Displays the waveform graph and the LC and RC graph. Reference: “Graph display (display graph switching)” (p. 79) [MODE]: “2.4 Select Measuring Mode” (p. 18) Menu icons [TABLE]: “3.2 Current Table Selection” (p. 29) [SYSTEM]: “9 System Settings”... - Page 87 Overview Graph display (display graph switching) Waveform graph display Displays the waveform graph only. [P:XX/XX]: Number of pulses that have been applied/Total number of Number of applied pulses and peak voltage display pulses [xxxV]: Max. peak voltage value of the response waveform Waveform judgment area and Blue: AREA judgment area LC and RC values operation...
- Page 88 Overview LC and RC graph display Displays only the LC and RC graph. LC and RC graph Blue dots: Test LC and RC values (Failures displayed in red) Gray (solid): LC and RC values PASS judgment area LC and RC cursor values [No.XXX, (XXX)]: Cursor value test number, (total number of LC and RC values)
- Page 89 Overview Display waveform graph and the LC and RC graph Displays the waveform graph and the LC and RC graph simultaneously.
- Page 90 Overview Expanded judgment results Expands and displays the judgment results. Tap the LC and RC values judgments area to check the LC and RC values for each pulse. Judgment settings Displays the set values of the judgment functions. Total judgment results Displays the total judgment results.
- Page 91 Overview Instrument status display and error display Present measurement Voltage application disabled mode mode display Test conditions settings mode Test mode BDV mode Current table display Displays the number and table name of the table presently being used. Information saved to Number of data saved to internal memory internal memory Communications...
-
Page 92: Checking Test Start And Test Results
Checking Test Start and Test Results 6.2 Checking Test Start and Test Results Press the instrument START button to implement the test. (You can start the test from either communications or external control terminal as well.) When a test finishes, the test results are output to the screen and external control terminal (EXT.I/O). Test results can also be acquired using communications. -
Page 93: Break Down Voltage Test (Bdv)
Break down voltage test (BDV) 7.1 Overview Implement the test while gradually increasing the voltage applied to the test object, and evaluate the voltage at which the insulation starts to break down from the waveform LC and RC values, discharge amount, and waveform surface area, etc. Operations flowchart in break down voltage test mode Break down voltage test mode evaluates the break down voltage, by using the operations procedure as shown in the diagram. -
Page 94: Screen Configuration
Overview Screen configuration Measurement screen Graph display Displays the waveform graph and the LC and RC graph. Reference: “Graph display (display graph switching)” (p. 37) Menu icons [MODE]: “2.4 Select Measuring Mode” (p. 18) [OUTPUT]: “7.3 Setting the Test Conditions” (p. 90) [JUDGE]: “7.4 Setting Insulation Break down Judgment Conditions”... - Page 95 Overview Graph display Number of steps, number [S:X/X]: Present number of steps/total number of steps of applied pulses, and peak [P:X/X]: Present number of pulse applications/total number of pulses voltage value display [xxxxV]: Response waveform peak voltage Response waveform Blue: PASS waveform Red: FAIL waveform Discharge judgment threshold Discharge judgment threshold value...
- Page 96 Overview Instrument status display and error display Present measurement Voltage application disabled mode mode display Test conditions settings mode Test mode BDV mode Communications Displays the settings for the communications interface presently being interface settings display used. Test status display Displays the test status.
-
Page 97: Checking Test Start And Test Results
Checking Test Start and Test Results 7.2 Checking Test Start and Test Results Press the instrument START button to implement the test. (You can start the test from either communications or external control terminal as well.) When a test finishes, the test results are output to the screen, communications, and external control terminal (EXT. -
Page 98: Setting The Test Conditions
START Settings range: ST4030: 100 V to 3300 V (resolution: 10 V) (Application start voltage) ST4030A: 100 V to 4200 V (resolution: 10 V) Sets the max. applied voltage. Implement tests while increasing the voltage to the set voltage. Settings range: ST4030: 100 V to 3300 V (resolution: 10 V) (Max. -
Page 99: Number Of Applied Pulses Settings
Setting the Test Conditions Number of applied pulses settings Sets the number of test pulses to be used in the tests and the number of degaussing pulse applications to eliminate magnetic fields from the workpiece. Reference: “4.3 Number of Applied Pulses” (p. 42) PULSE NUM Sets the number of test pulses to be applied. - Page 100 Setting the Test Conditions IMPORTANT Since statistical values are used in the calculation of discharge judgments, reducing the number of pulse applications will increase the magnitude of errors and may result in erroneous judgments. If you encounter this issue, either increase the LCRC and AREA judgment thresholds or set judgment to “OFF.”...
-
Page 101: Setting The Sampling Frequency And Number Of Sampling Data
Setting the Test Conditions Setting the sampling frequency and number of sampling data Sets the voltage sampling frequency and the number of sampling data to be imported to the instrument. Sets the voltage sampling frequency. SAMPLING If a sufficiently long response waveform cannot be imported because (Sampling frequency) the response waveform vibration period is long, you can extend the waveform to be imported by extending the sampling frequency. -
Page 102: Setting The Waveform Acquisition Area Automatically
Setting the Test Conditions Setting the waveform acquisition area automatically The instrument can automatically adjust the sampling frequency and sampling data count during voltage calibration in order to optimize the waveform acquisition area. (Measurement screen) [MODE] > [BDV] > [OUTPUT] >... -
Page 103: Setting Dielectric Break Down Judgment Conditions
Setting Dielectric Break down Judgment Conditions 7.4 Setting Dielectric Break down Judgment Conditions Sets the conditions for judging dielectric break down from variations in the LC and RC values between multiple pulses, discharge amount, waveform surface area values, peak voltage values, and vibration frequency for each applied voltage. -
Page 104: Discharge Judgment
Setting Dielectric Break down Judgment Conditions Discharge judgment Judges breakdown from the variations in the discharge amount between multiple pulses for each applied voltage. If the variations in the discharge amount between multiple pulses are greater than the set deviation threshold value, dielectric breakdown is judged to have occurred. -
Page 105: Waveform Surface Area Comparison Judgment
Setting Dielectric Break down Judgment Conditions Waveform surface area comparison judgment Judges breakdown from the variations in the surface area values between multiple pulses for each applied voltage. If the variations in the surface area values between multiple pulses are greater than the set deviation threshold value, dielectric breakdown is judged to have occurred. -
Page 106: Peak Voltage Value Fluctuations
Setting Dielectric Break down Judgment Conditions Peak voltage value fluctuations Discharges are detected based on variations in the first peak voltages among multiple pulses of each applied voltage. If the amount of variability in the first peak voltages for multiple pulses exceeds the set threshold, the instrument will conclude that discharges are occurring. -
Page 107: Vibration Frequency Fluctuations
Setting Dielectric Break down Judgment Conditions Vibration frequency fluctuations Discharges are detected based on variations in the vibration frequency among multiple pulses of each applied voltage. If the amount of variability in the vibration frequency for multiple pulses exceeds the set threshold, the instrument will conclude that discharges are occurring. - Page 108 Setting Dielectric Break down Judgment Conditions...
-
Page 109: Other Functions
Other Functions 8.1 Interlock Function The interlock function cuts off instrument outputs by operating in tandem with external devices, etc. All instrument key operations are disabled. If the interlock functions are enabled while the external control terminal (EXT. I/O) No. 3 pin ―... - Page 110 Interlock Function Operations when the interlock is enabled ― ― ― ― ― ― ― ― ― If the external control terminal (EXT. I/O) INTERLOCK pin is OFF while the interlock function is [INTERLOCK] enabled, the interlock is engaged, and is displayed at the bottom right of the screen.
-
Page 111: Unlocking The Interlocks
Interlock Function Unlocking the interlocks Enter the pass code that has been set, to cancel the interlocks. Make sure not to forget your pass code. If you forget the pass code, full reset to return the system to its factory settings. The default pass code setting is “0000”. -
Page 112: Key Lock Function
Key Lock Function 8.2 Key Lock Function The key lock function disables the instrument touch panel operations. You can also set the pass code (PIN). If a pass code has been set, it is necessary to enter the code when unlocking the key locks. Make sure not to forget your pass code. IMPORTANT •... -
Page 113: Unlocking The Key Locks
Key Lock Function Unlocking the key locks Enter the pass code that has been set to cancel the key locks. Make sure not to forget your pass code. If you forget the pass code, full reset to return the system to its factory settings. The default pass code setting is “0000”. -
Page 114: Double Action Function
Double Action Function 8.3 Double Action Function The double action function prevents misoperations during test startup. When the double action function is enabled, merely pressing the START button does not start the test. Press the STOP button and then press the START button within approx. -
Page 115: Memory Function
Memory Function 8.4 Memory Function Saves the test results to the memory in the instrument. (1000 tests max.) You can save the test results that have been stored to USB memory. Further, you can acquire the saved data using communications commands. The items saved by the memory function are described below. -
Page 116: Memory Function Settings (On/Off)
Memory Function Memory function settings (ON/OFF) Sets whether to enable or disable the memory functions. If enabled, the test results are automatically saved to the memory in the instrument when the test finishes. (Measurement screen) [SYSTEM] > [SYSTEM] Tap [MEMORY], and set the memory function to ON or OFF. Memory function is disabled. -
Page 117: Saving Memory Data
Memory Function Saving memory data The data saved to internal memory is saved to USB memory. (Measurement screen) [SYSTEM] > [SYSTEM] [MEM SAVE]. A confirmation message is displayed. Tap [OK]. CANCEL Cancels the saving. Implements save. -
Page 118: Deleting Memory Data
Memory Function Deleting memory data The data saved to internal memory is deleted. [SYSTEM] [SYSTEM] (Measurement screen) > [MEM CLEAR]. A confirmation message is displayed. Tap [OK]. CANCEL Cancels the deletion. Implements deletion. -
Page 119: Displays
Displays 8.5 Displays Sets the items to be displayed. (Measurement screen) [SYSTEM] > [SYSTEM] > [DISP] Tap [DISP], and set the display lamps on settings. The display will turn off 10 sec. after the touch panel was last touched. After the display turns off, touching the touch panel again will turn on the display again. The display is always on. -
Page 120: Graph Display Settings
Graph Display Settings 8.6 Graph Display Settings You can set the display methods for the graphs displayed on the measurement screen. Overlay settings Sets the overlay of the waveform and LC and RC graphs. When overlay is enabled, you can check visually any variations per waveform and LC and RC values test. -
Page 121: Waveform Color Settings
Graph Display Settings Waveform color settings Sets the colors of the waveform and LC and RC graphs. Colors can be set using the test conditions settings mode, test mode, and BDV mode respectively. Test conditions settings mode [GRAPH] (Measurement screen) (Bottom left of screen) Example: Test conditions settings mode screen Tap the item buttons. - Page 122 Graph Display Settings Test conditions settings mode STD WAVE Sets the master waveform color and LC and RC values master data color. SMPL WAVE Sets the test waveform color and the test LC and RC values color. PASS DCHG Sets the waveform color for the part that does not exceed the threshold values on the discharge amount graph.
-
Page 123: Lc And Rc Graph Scale Settings
Graph Display Settings LC and RC graph scale settings Sets the scale value of the LC and RC graph X axis (LC value) and Y axis (RC value). Overlay can be set from the test conditions settings mode and test mode. (Measurement screen) [GRAPH] (Bottom left of screen) -
Page 124: Implementing The Lc And Rc Graph Auto Scale
Graph Display Settings Implementing the LC and RC graph auto scale Implements auto scaling so that the upper and lower limits of the LC and RC graph display X axis (LC values) and Y axis (RC axis) are within a suitable display range. Overlay can be implemented from the test conditions settings mode and test mode. -
Page 125: Judgment Beep
Judgment Beep 8.7 Judgment Beep Sets a beep that varies according to the judgment results. (Measurement screen) [SYSTEM] > [SYSTEM] > [JUDGE BEEP] Tap [BEEP], and set the conditions for when to sound the judgment beep. Beep does not sound regardless of the judgment results. PASS Sounds the beep when the overall judgment result is PASS. -
Page 126: Key Beep
Key Beep 8.8 Key Beep You can set the keys to beep. (Measurement screen) [SYSTEM] > [SYSTEM] > [KEY BEEP] Tap [BEEP], and set whether or not to sound the key beep. Key beep does not sound. Key beep sounds. Set the scale of the key beep sound. -
Page 127: Test Time (Eom) Display
Test Time (EOM) Display 8.9 Test Time (EOM) Display Displays the test time (EOM) for 1 test. Test time= (INDEX + software processing time + judgment times) × Number of pulse applications (Measurement screen) [SYSTEM] > [SYSTEM] [EOM TIME], and set whether to display or hide the test times (EOM). Test times are not displayed. -
Page 128: Communications Commands Long Format Settings
Communications Commands Long Format Settings 8.10 Communications Commands Long Format Settings Sets the long format during data transfer using communications commands. When the long format is enabled, you can increase the number of effective digits in the voltage values that are acquired using communications commands. (Measurement screen) [SYSTEM] >... -
Page 129: Initializing The Instrument (System Reset)
Initializing the Instrument (System Reset) 8.11 Initializing the Instrument (System Reset) Initializes all the instrument settings. For the initialization items and default set values, see the “Default settings table” on the application disc. If the system reset screen cannot be displayed, implement a full reset. Reference: “14.2 Initializing the Instrument (Full Reset)”... -
Page 130: Terminal Open Error Setting
Terminal Open Error Setting 8.12 Terminal Open Error Setting This section describes how to enable and disable the display of terminal open errors. When the setting is enabled, the instrument will conclude that the terminals are open and display an open error if the voltage value fails to fall after the response waveform’s maximum value is acquired. -
Page 131: Voltage Error Setting
Voltage Error Setting 8.13 Voltage Error Setting This section describes how to enable and disable the display of voltage errors. When voltage errors are enabled, the instrument will display a voltage error if the test voltage fails to reach the set voltage. (Measurement screen) [SYSTEM] >... - Page 132 Terminal Open Error Setting...
-
Page 133: System Settings
System Settings 9.1 Instrument System Information You can check the instrument system information. [SYSTEM] [INFO] (Measurement screen) > Serial No. Serial number Software Version Software version FPGA Main Main FPGA version FPGA Receive Sub FPGA version MAC Address MAC address of the instrument USB ID USB ID Interface Board... -
Page 134: Self-Test Function
Reference: “Touch panel correction” (p. 127) IMPORTANT If the black square still cannot be tapped even after panel correction, there is a risk of malfunction. Contact your authorized Hioki distributor or reseller. When the test is finished, tap [EXIT]. -
Page 135: Touch Panel Correction
Press and hold on the center of the two in order until (green) is displayed. Tap [SET]. [SET] is displayed together with the two when (green) is displayed. IMPORTANT [SET] is not displayed, repairs are necessary. Contact your authorized Hioki distributor or reseller. -
Page 136: Screen Display Test
[OUTPUT] [PASS/FAIL] lamps at the bottom of the instrument will also turn on and off according to the screen color. IMPORTANT If the full screen is not the same color, repairs are necessary. Contact your authorized Hioki distributor or reseller. -
Page 137: Rom/Ram Test
All ROM/RAM memories are normal. One or more of the ROM/RAM memories is abnormal. IMPORTANT • All instrument operations are disabled during ROM/RAM tests. • If the judgment results display is [NG], repairs are necessary. Contact your authorized Hioki distributor or reseller. - Page 138 The test results will be displayed to the right of [FULL]. PASS All ROM/RAM memories are normal. One or more of the ROM/RAM memories is abnormal. IMPORTANT If the judgment results display is [NG], repairs are necessary. Contact your authorized Hioki distributor or reseller.
-
Page 139: Ext. I/O Test
Self-test Function EXT. I/O test Checks whether the output signals from the external control terminal (EXT.I/O) are normal, and whether the input signals can be read normally. (Measurement screen) [SYSTEM] > [TEST] Tap [EXEC]. Implement output signal tests and input signal tests. I/O OUT Implements output signal tests. -
Page 140: Date And Time Settings
Date and Time Settings 9.3 Date and Time Settings Sets the instrument date and time. You can record and manage data using the set date and time. (Measurement screen) [SYSTEM] > [CLOCK] Set the date and time. Settings range: 00 o’clock 00mins. 00s January 1, 2000 to 23 o’clock 59mins. 59s December 31, 2099 Tap [SET]. -
Page 141: External Control
External Control (EXT. I/O) WARNING To prevent an electric shock or damage to the equipment, always observe the following precautions when connecting the cables to external control terminal connectors. • Always turn OFF the instrument and any devices that are connected before making connections. -
Page 142: External Control Measurement Flow
External Control Measurement Flow 10.1 External Control Measurement Flow The external control measurement flow is as described below. Preparation Checking I/O specifications of the external device to be connected. Setting NPN/PNP in the instrument. p. 135 Connecting the instrument and the external device. p. -
Page 143: Sinking Current (Npn) / Sourcing Current (Pnp)
Sinking Current (NPN) / Sourcing Current (PNP) 10.2 Sinking Current (NPN) / Sourcing Current (PNP) You can use NPN/PNP switching to change the type of corresponding programmable controller. NPN is sinking current and PNP is sourcing current. It is set to NPN at the time of shipment from the factory. CAUTION To avoid damaging the instruments, observe the following. -
Page 144: Connection (Instrument And Control Devices)
Connection (Instrument and Control Devices) 10.3 Connection (Instrument and Control Devices) Instrument connector and compatible connectors Connectors used (instrument unit side) • D-SUB 37 pin, female #4-40 inch screw Compatible connectors • DC-37P-ULR (solder type) • DCSP-JB37PR (crimp type) Japan Aviation Electronics Industry, Ltd. 19 18 17 16 15 14 13 12 11 10 9 37 36 35 34 33 32 31 30 29 28 27 26 25 24 23 22 21 20 Rear... - Page 145 Connection (Instrument and Control Devices) Signal name Logic Function OUT2 – General outputs PASS – Total judgment PASS (Reserved) – – STOP Edge Measurement stopped (Reserved) – – TBL0 Level Table number selection TBL2 Level Table number selection TBL4 Level Table number selection TBL6 Level...
-
Page 146: Signal Functions
Connection (Instrument and Control Devices) Signal functions (1) Isolated power supply output NPN/PNP switch settings Signal name ISO_5 V Isolated power supply +5 V Isolated power supply −5 V 9, 27 ISO_COM Isolated power supply Isolated power supply common common (2) Input signal Signal name Description... -
Page 147: Internal Circuit Configuration
Connection (Instrument and Control Devices) Internal circuit configuration Use ISO_COM for the common terminal for both the input and output signals. If a large current flows through common wiring, branch the output signals common wiring and the input signals common wiring close to the ISO_COM terminal. NPN setting ST4030 Programmable controller, etc. -
Page 148: Electrical Specifications
Connection (Instrument and Control Devices) Electrical specifications Input signal Input format Photocoupler isolated non-voltage contact input (compatible with sinking/sourcing current outputs) Input ON Residual voltage 1 V max. (input ON current 4 mA (reference value)) Input OFF OPEN (interrupting current 100 µA or less) Output signal Output format Photocoupler isolated open drain output (non-polar) - Page 149 Connection (Instrument and Control Devices) Output circuit ST4030 ST4030 Output Output Connection to the LED Connection to the relay ST4030 Output ST4030 Output Output Negative-true logic output Negative-true logic output Wired-OR Programmable Programmable ST4030 ST4030 controller controller Output Output Input Input Common Common...
-
Page 150: Timing Chart
Timing Chart 10.4 Timing Chart The level of each signal shows the contact ON/OFF status. In the sourcing current (PNP) setting, these are the same as the voltage level of the external control terminal. HI and LO are reversed for the voltage level in the sinking current (NPN) setting. -
Page 151: Measurement Timing Example
Timing Chart Measurement timing example START TBL0 to 7 TBL signal imports Measurement Pulse application and Table Trigger delay Operation, judgment processing sampling switching INDEX Judgment Judgment results ERR results IMPORTANT • The instrument outputs judgment results signals before immediately outputting EOM signals. If responses from the input circuit of the external device that is connected are slow, it may take considerable time to import judgment results after an EOM signal ON is detected. -
Page 152: Flow Of Starting Measurements From An External Device, And Reading The Judgment Results
Timing Chart Flow of starting measurements from an external device, and reading the judgment results Describes the flow from the start of measurements to obtaining the judgment results when a trigger is input from an external device. The instrument outputs judgment results signals before immediately outputting EOM signals. If responses from the input circuit of the external device that is connected are slow, it may take considerable time to import judgment results after an EOM signal ON is detected. -
Page 153: Communications Interface
• To prevent instrument damage or an electric shock, use only the screws that are originally installed to secure the interface. If you have lost a screw or find that a screw is damaged, please contact your authorized Hioki distributor or reseller. -
Page 154: Overview
Overview 11.1 Overview You can control the instrument using communications commands from a PC via RS-232C, GP-IB, USB, and LAN. There are 4 types of interface, as described below. It is necessary to set the instrument communications conditions to communicate. RS‑232C communications You can implement command control using RS-232C serial (p. -
Page 155: Specifications
Specifications 11.2 Specifications RS‑232C Transmission method Communications method: Full duplex Sync method: Asynchronous transmission system Transmission speed 9600 bps, 19200 bps, 38400 bps, 57600 bps Data length 8 bits Parity None Stop bit 1 bit Message terminators CR+LF, CR (delimiters) Flow control Software (XON/XOFF control) See “Handshaking (Buffer Flow Control)”... -
Page 156: Gp-Ib
Compatible OS Windows 7, Windows 8, Windows 10 Connector RJ-45 connector ×1 Electrical Conforms to IEEE802.3 specifications Transmission 10BASE-T/ 100BASE-TX/ 1000BASE-T automatic recognition method Protocol TCP/IP Function Command control Max. cable length 30 m max. Total Command system Unique HIOKI SCPI... -
Page 157: Mounting And Removing An Interface
Mounting and Removing an Interface 11.3 Mounting and Removing an Interface You can check onscreen information for interfaces mounted to the instrument. Reference: “9.1 Device System Information” (p. 125): “11.4 Interface Settings” (p. 151) Communicating using Z3000:GP-IB (p. 154) Communicating using Z3001:RS-232C (p. 152) Rear Installation method Required items... - Page 158 When not using the interface after its removal Mount the blank panel. The specifications cannot be satisfied if measuring without mounting the blank panel. To purchase an additional blank panel, contact your authorized Hioki distributor or reseller. Mount the blank panel.
-
Page 159: Interface Settings
Interface Settings 11.4 Interface Settings You can control the instrument from a PC via RS-232C, GP-IB, USB, or LAN. GP-IB settings are possible only when the optional Z3000 GP-IB interface is mounted, and RS- 232C settings are possible only when the optional Z3001 RS-232C interface is mounted. (Measurement screen) [SYSTEM] >... -
Page 160: Connecting And Setting Rs-232C (Model Z3001)
Connecting and Setting RS-232C (Model Z3001) 11.5 Connecting and Setting RS‑232C (Model Z3001) Connection method Connect a RS-232C cable to the RS-232C connector of the instrument. Model 9637 RS-232C cable (9pin-9pin/1.8 m) is recommended. D-sub9 Pin male, terminal block screw #4-40 Rear When connecting a controller (DTE), prepare a instrument connector and a cross cable with the controller connector specifications. - Page 161 Connecting and Setting RS-232C (Model Z3001) Setting procedure Set RS-232C communications settings using the system screen. Settable only when the Z3001 RS- 232C interface is mounted to the instrument. [SYSTEM] [I/F] (Measurement screen) > Tap [RS‑232C]. Select the baud rate. 9600 9600 bps 19200...
-
Page 162: Connecting And Setting Gp-Ib (Model Z3000)
Connecting and Setting GP-IB (Model Z3000) 11.6 Connecting and Setting GP‑IB (Model Z3000) Connection method Connect a GP-IB cable to the GP-IB connector of the instrument. Model 9151-02 GP-IB connector cable (2 m) is recommended. Rear Setting procedure Set GP-IB communications settings using the system screen. Settable only when a Z3000 GP-IB interface is mounted to the instrument. -
Page 163: Connecting And Setting Usb
When the instrument is connected to a PC for the first time, the dedicated USB driver is required. Before connecting the instrument and PC, install the USB driver. The USB drivers are on the enclosed application disc, or you can download them from the Hioki website (http://www.hioki.com). - Page 164 Connecting and Setting USB Setting procedure [SYSTEM] [I/F] (Test screen) > Tap [USB]. Set the terminator. CR+LF CR+LF...
-
Page 165: Setting And Connecting Lan
Setting and Connecting LAN 11.8 Setting and Connecting LAN Connection method When connecting the instrument and PC using a LAN cable, you can control and monitor the instrument from the PC. Use a LAN cable to connect the instrument to the 1000BASE-T connector on the PC. - Page 166 Setting and Connecting LAN (2) Connect the instrument and PC for 1‑to‑1 use When connecting the instrument and PC using a LAN cable, you can control and monitor the instrument from the PC. LAN cable* ST4030 *Use either of the following. •...
-
Page 167: Setting Procedure
Setting and Connecting LAN Setting procedure You can implement command control using TCP/IP protocols. Set the instrument according to the network environment in use beforehand. IMPORTANT • Make sure to make the LAN settings before connecting to the network. • If the settings were changed without disconnecting, there is a risk that the IP address will duplicate the address of another instrument on the LAN, so that illegal address information may be sent to the LAN. - Page 168 Setting and Connecting LAN Network environment configuration example Example 1: Connecting the instrument to the existing network If connecting the instrument to an existing network, it is necessary to check the network settings beforehand. It is necessary to allocate IP addresses so that they do not overlap with other network devices. Check the following items with the network administrator, and keep a memo.
- Page 169 Setting and Connecting LAN (Measurement screen) [SYSTEM] > [I/F] Tap [LAN]. Set the IP addresses. Set the port numbers. Setting range: 1024 to 65535 Set the subnet mask. Set the gateway. If it is not necessary to set a default gateway, for example if setting the instrument and PC 1-to-1 using a cross cable, the gateway may remain OFF.
-
Page 170: Remote Mode
Remote Mode 11.9 Remote Mode If starting communications after connecting an interface to the instrument, the instrument will enter remote mode (remote operations mode). In remote mode, operations by tapping the screen are disabled. Remote mode ON Remote mode OFF To return to local mode (normal communications), tap [LOCAL]. -
Page 171: Communications Monitor
Communications Monitor 11.10 Communications Monitor You can display the communications commands and query responses onscreen by using the communications monitoring functions. [SYSTEM] [I/F] (Measurement screen) > [COMM LOG]. Communications monitor is not displayed. Communications monitor is displayed. Communications monitor is displayed onscreen. The max. number of lines that can be displayed is 30. - Page 172 Communications Monitor Commands and messages displayed by the communications monitor, and their meaning The displayed commands are color-coded as described below. Light blue display Incoming commands Green display Outgoing commands Red display Error messages Error messages are displayed as described below. QUERY ERROR Query error DEVICE-SPECIFIC ERROR...
-
Page 173: Usb Host
USB Host 12.1 Overview You can save the measured value and instrument settings to USB memory. Further, you can also import the settings that have been saved to USB memory to the instrument. You can save data from the instrument to USB memory. •... -
Page 174: Removing The Usb Memory
Removing the USB Memory 12.2 Removing the USB Memory Inserting the USB memory Insert the USB memory into the USB memory connector on the front. • Do not insert anything other than a mass storage class-compatible USB memory. • Not all commercially-available USB memories are compatible. •... - Page 175 Removing the USB Memory Icon display when using the USB When a USB memory is detected normally, the USB memory icon is displayed at the bottom of the measurements screen. When USB memory is being accessed, the icon color turns red. (Blue) If the instrument detects a USB memory (Red)
-
Page 176: File Window
File Window 12.3 File Window When using USB, the following will be displayed. Further, you can set the format of the file to be saved to USB, the save destination, the text save format, and so on. Header portion [filename +++]: File name [size ++]: File size... -
Page 177: Settings For Saving The Data
Settings for Saving the Data 12.4 Settings for Saving the Data Set beforehand to save the measurement results to USB memory. Both auto and manual save are available. You can select the test results (CSV file format) and measurement screen (BMP file format) to be saved. -
Page 178: Setting Manual Save
Settings for Saving the Data Setting manual save Tap [SAVE], and set to save the measurement results. (Measurement screen) [FILE] > [SETUP] Set the operations when [SAVE] is tapped. SELECT The save details selection window will be displayed. QUICK Saves the saved items that have been set immediately. Tap [TEXT], and set whether or not to save text (CSV file format) of the test results during manual saving. -
Page 179: Text Save Items Settings
Settings for Saving the Data Text save items settings Sets the save items when saving text of the test results (CSV file format). (Measurement screen) [FILE] > [SETUP] Tap [DATE], and set whether or not to save the date and time. Tap [SET], and set whether or not to save the measuring conditions. -
Page 180: Setting The Text Save Format
Settings for Saving the Data Setting the text save format Sets the delimiters and quote marks when saving text of the test results (CSV file format). (Measurement screen) [FILE] > [SETUP] > [PAGE] Tap [QUOTE], and set the item quotation type. None “... -
Page 181: Setting The Image Save Format
Settings for Saving the Data [DATE FORM], and set the date format. YYYYMMDD Year, month, day MMDDYYYY Month, day, year DDMMYYYY Day, month, year YYMMDD Year, month, day MMDDYY Month, day, year DDMMYY Day, month, year [DATE DELIM], and set the date delimiter type. Slash Hyphen Period... -
Page 182: Setting The Name Of The Saved File And Its Folder
Settings for Saving the Data Setting the name of the saved file and its folder Specifies the name of the saved file. IMPORTANT File names are shared between text saved data, image saved data, and memory data. If a file with the same name already exists, “00001” to “65534” will be appended in order after the file name. (Measurement screen) [FILE] >... - Page 183 Settings for Saving the Data Operating the file name input screen (Same as the folder name input screen) Moves the cursor. Deletes 1 character from the file name that has been entered. Deletes all characters from the file name that has been entered. KEY TYPE Switches the keyboard type.
-
Page 184: Saving Test Results
Saving Test Results 12.5 Saving Test Results [SAVE] to implement the save. Manual saving QUICK: [SAVE] to save immediately according to the settings details. SELECT: [SAVE] to display the selection window. If automatic saving has been turned ON using [FILE] >... - Page 185 Saving Test Results Only when [SELECT] is selected Select the details to be saved and implement the save operation. TEXT Saves the text data. SCREEN Saves the image. Tap [SAVE]. Implements manual save.
-
Page 186: Checking The Test Results That Have Been Saved
Saving Test Results Checking the test results that have been saved Saves using TEST mode “ ” ” ” ” “ ” ” HIOKI E.E. CORPORATION ST4030 Ver. 1.00 Header “ ” ” ” Serial No. 123456789 “ ” ”... - Page 187 Saving Test Results Saves using BDV mode “ ” ” ” ” “ ” ” HIOKI E.E. CORPORATION ST4030 Ver. 1.00 Header “ ” ” ” Serial No. 123456789 “ ” ” ” DATE 2019/02/26 Save date and time “...
-
Page 188: Saving And Importing Test Conditions
Saving and Importing Test Conditions 12.6 Saving and Importing Test Conditions Saves the instrument settings information to USB memory as a settings file. Imports the settings file that has been saved to USB memory and restores the settings. Saving test conditions There are 2 types of test conditions that can be saved. - Page 189 Saving and Importing Test Conditions Saving all table settings (Measurement screen) [FILE] > [PAGE] > [PAGE3/3] [ALL SAVE]. Enter the file name. Reference: “Touch keyboard inputs” (p. 11)
-
Page 190: Importing Test Conditions
- User-defined table settings - All settings IMPORTANT When loading a settings file saved by the ST4030A with the ST4030, only settings with voltages that can be output by the ST4030 will be loaded. Importing user‑defined table settings (Measurement screen) [FILE] >... - Page 191 Saving and Importing Test Conditions Importing all settings (Measurement screen) [FILE] > [PAGE] > [PAGE1/3] Select files with the “ALL” extension. Tap [LOAD]. The implementation confirmation window will be displayed. Tap [YES].
-
Page 192: Editing Files And Folders
Editing Files and Folders 12.7 Editing Files and Folders You can edit the files and folders that have been saved to USB memory. • Formatting USB memory • Deleting files and folders • Creating folders • Changing the names of files and folders •... - Page 193 Editing Files and Folders (Measurement screen) [FILE] > [PAGE2/3] Tap [FORMAT]. The confirmation window will be displayed. Tap [YES]. The confirmation window will be displayed again. Tap [YES].
-
Page 194: Deleting Files And Folders
Editing Files and Folders Deleting files and folders Deletes the files or folders that have been saved to USB memory. IMPORTANT Deleted files and folders cannot be restored. Check thoroughly before deleting. (Measurement screen) [FILE] > [PAGE] > [PAGE2/3] (When deleting files) (When deleting folders) Select the file or folder to be deleted. -
Page 195: Creating Folders
Editing Files and Folders Creating folders Create a folder in USB memory. You can set up to 31 characters max. (Measurement screen) [FILE] > [PAGE 2/3] Tap [FOLDER]. The keyboard will be displayed. Set the folder name. Reference: “Touch keyboard inputs” (p. 11) -
Page 196: Changing The Folder Name And File Name
Editing Files and Folders Changing the folder name and file name Changes the name of the files or folders that have been saved to USB memory. (Measurement screen) [FILE] > [PAGE...] Tap a file or folder. Tap [RENAME]. The keyboard will be displayed. Change the name of a file or folder. -
Page 197: Information Display
Editing Files and Folders Information display You can use the screen to check the test results files (CSV) and measurements screen files (BMP) that have been saved to USB memory. (Measurement screen) [FILE] Tap the desired file. Tap [VIEW]. Example 1: Measurements screen file (BMP) Example 2: Test results file (CSV) - Page 198 Editing Files and Folders...
-
Page 199: Specifications
Specifications 13.1 General Specifications Operating environment Indoor, Pollution Degree 2, altitude up to 2000 m (6562 ft.) Operating temperature and Temperature: 0ºC to 40ºC (32ºF to 104ºF) humidity Humidity: 80% RH or less (no condensation) Storage temperature and Temperature: 10ºC to 50ºC (14ºF to 122ºF) humidity Humidity: 80% RH or less (no condensation) -
Page 200: Input Specifications/Output Specifications/Measurement Specifications
Set voltage range ST4030: 100 V to 3300 V (Maximum applied energy: approx. 55 mJ) ST4030A: 100 V to 4200 V (Maximum applied energy: approx. 88 mJ) Set voltage resolution 10 V Testable inductance range 10 µH to 100 mH... -
Page 201: Functional Specifications
Applied voltage Sets the values of the impulse voltage applied to the workpiece Settings range: ST4030: 100 V to 3300 V (resolution: 10 V) ST4030A: 100 V to 4200 V (resolution: 10 V) Number of applied pulses Sets the number of... - Page 202 Functional Specifications (1) LC and RC value judgments LC and RC values judgments Compares the LC and RC values distribution of the master workpiece and the LC and RC values of the workpiece to be tested. [LCRC AREA] LC and RC values: The quantification of the response waveform as 2 parameters of the LC and RC values Sets the waveform area used in LC and RC values operations.
-
Page 203: Test Conditions Switching Functions
Functional Specifications Waveform secondary The amount of the high-frequency component expressed by the test waveform differential detection in the user-designated area is detected, and judge the discharge by its size. judgments Secondarily differentiates the test waveform, and calculates the surface area of the differentiated waveform as the discharge component amount. -
Page 204: Break Down Voltage Test (Bdv) Mode
Sets the values of the start voltage, max. voltage, and voltage rise width Start voltage Settings range: ST4030: 100 V to 3300 V (resolution: 10 V) ST4030A: 100 V to 4200 V (resolution: 10 V) Max. voltage Settings range: ST4030: 100 V to 3300 V (resolution: 10 V) -
Page 205: Safety Protection Function
Functional Specifications Set judgment conditions Waveform surface area Discharge judgments from the variation in the waveform surface area with the comparison judgment same voltage. [AREA] Judgment values Sets the deviation (σ) threshold value of the waveform surface area Settings range OFF / 3 to 100 Discharge judgments Discharge judgments from the variation in the discharge amount with the same... -
Page 206: Other Functions
Functional Specifications Other functions Automatic settings function This function automatically sets the sampling frequency and number of sampling for scope of waveform data during voltage calibration so that the waveform acquisition range is optimal. acquisition Function settings OFF / ON Waveform judgment range, This function automatically sets the waveform judgment ranges and threshold values from the waveform variations during voltage calibration so that the... - Page 207 Functional Specifications Self-check function Touch panel test Checks whether there is an error in the touch panel Touch panel Corrects the touch panel position correction Screen display test Checks the screen display status and LED ON/OFF status ROM/RAM test Checks whether there are any errors in the main unit internal memory (ROM and RAM) EXT.I/O test Displays the input signal status of the external control...
-
Page 208: Interface Specifications
Interface Specifications 13.4 Interface Specifications For the initialization, see the “Default settings table” on the application disc. The set values are saved even after the power supply is turned off. External control terminal (EXT.I/O) specifications Connector used D-SUB 37 pin and socket connection (female) Fixing stud #4-40 inch screw NPN/PNP Switch settings using the switch on the rear of the main unit. - Page 209 Interface Specifications External control terminal (on instrument) pin layout diagram Signal name Logic Function START Edge Start of measurement (Reserved) – – ー ー ー ー ー ー ー ー ー INTERLOCK Level Unlocking the interlocks condition TBL1 Level Table number selection TBL3 Level Table number selection...
-
Page 210: Communications Interface Specifications
Data bit length 8 bits Stop bit Parity bit None Delimiter CR+LF/CR Handshake OFF/X flow Protocol Non-procedure Command system Unique HIOKI SCPI Communications monitor Displays the send and receive status of commands and queries function Settings range: OFF / ON... -
Page 211: Usb Host Specifications
Interface Specifications USB host specifications (1) Electrical specifications Connector USB type A connector Electrical specifications USB2.0 (High Speed) Power supply 500 mA max. Number of ports Compatible USB memory USB Mass Storage Class compatible (2) USB host operations Save the test results Function Saves the test results presently displayed onscreen Save items... -
Page 212: Test Time (Reference Value)
Interface Specifications Test time (Reference value) Measuring time EOM= (INDEX + software processing time + judgment times) × Number of pulse applications (EOM) Note: There is no software processing time or judgment times in degaussing pulses. During multiple pulse applications, control makes sure that the pulse application intervals are not less than the minimum pulse interval setting. -
Page 213: L2250 Clip Type Lead (Option)
L2250 Clip Type Lead (Option) 13.5 L2250 Clip Type Lead (Option) General specifications Operating environment Indoor, pollution level 2, altitude up to 2000 m (6562 ft.) Operating temperature and Temperature: 0 C to 40 C (32 F to 104 F) humidity Humidity: 80% RH or less (no condensation) - Page 214 Interface Specifications...
-
Page 215: Maintenance And Service
To ensure the product can be used over the long term, it is recommended to replace these parts on a periodic basis. When replacing parts, please contact your authorized Hioki distributor or reseller. The service life of parts varies with the operating environment and frequency of use. Parts are not guaranteed to operate throughout the recommended replacement cycle. -
Page 216: Troubleshooting
14.1 Troubleshooting If damage is suspected, check the “Before sending the instrument for repair” section before contacting your authorized Hioki distributor or reseller. If the cause is unknown, implement a system reset. All settings will return to the default factory settings. - Page 217 Troubleshooting Measurement issues Symptom Check item or cause Corrective action and reference page Detection wave varies or Is an error displayed? Check the relevant items in the error abnormal display, and remove the cause before measuring. Reference: “14.3 Error Display” (p. 214) [UNCAL] is displayed, implement voltage calibration.
- Page 218 Troubleshooting Symptom Check item or cause Corrective action and reference page Error occurs during testing Have you checked the details Check the details of the error icon of the error icon displayed displayed onscreen. onscreen? Reference: “14.3 Error Display” (p. 214) Is probing unstable? An open error such as unstable probing may occur.
- Page 219 Troubleshooting Communications Symptom Check item or cause Corrective action and reference page Communications are disabled Have communications been Check that the connector connections [REMOTE] icon is not established? are correct. displayed) Check that the interface settings are correct. Reference: “11 Communications Interface”...
-
Page 220: Faq Regarding External Control (Ext. I/O)
Troubleshooting External controls (EXT.I/O) Symptom Check item or cause Corrective action and reference page All operations are disabled Is the wiring correct? When wiring is incorrect, check the EXT. I/O again. • Connector is disconnected • Are the pin numbers incorrect? •... -
Page 221: Initializing The Instrument (Full Reset)
IMPORTANT • Remove the test leads from the workpiece and implement a full reset. • If operations are still not normal even after a full reset, repairs are required. Contact your authorized Hioki distributor or reseller. Turn ON the main power supply switch with the power cord connected. -
Page 222: Error Display
Error Display 14.3 Error Display If an error is displayed, repairs are required. Contact your authorized Hioki distributor or reseller. Error during tests Communications Total EXT.I/O Judgment Error type measurement judgment Solution results ERR pin status results Normal Normal Normal –... - Page 223 If the error continues to persist, the instrument may be malfunctioning. Please contact your authorized Hioki distributor or reseller. *1: If an invalid table is specified using table switching from an external control terminal (EXT.I/O), measurements will not be performed and the ERR pin will turn ON.
- Page 224 • There is a risk that the probing status is unstable. • If you encounter this error with a normal, non-defective workpiece, the instrument may be malfunctioning. Please contact your authorized Hioki distributor or reseller. ERROR 24 • Model ST4030 does not support the Waveform analysis failure workpiece.
- Page 225 Error Display WARNING EXT.I/O Communications Display * Meaning/Solution VCAL status ERR pin WARNING 102 • Disturbances were detected in a number of waveforms during voltage calibration. • The calibration process may be experiencing the effects of noise. Consider taking steps to prevent noise.
- Page 226 Error Display EXT.I/O Communications Display * Meaning VCAL status ERR pin INFORMATION 1013 Indicates that voltage calibration was canceled by the instrument’s interlock function. INFORMATION 1021 The workpiece’s entire response waveform can be recorded by either reducing the sampling frequency or increasing the number of data points.
- Page 227 (When the power supply is turned ON after a version upgrade) If you encounter an error that is not listed above, please make a note of the display and contact your authorized Hioki distributor or reseller.
-
Page 228: Discarding The Instrument (Removing The Lithium Battery)
Discarding the Instrument (Removing the Lithium Battery) 14.4 Discarding the Instrument (Removing the Lithium Battery) When discarding the instrument, remove the lithium battery, and dispose according to local regulations. The instrument has a built-in lithium battery for backup. Required items Phillips screwdriver (No. -
Page 229: Appendix
15.1 Block Diagram • Outputs impulse signals from 100 V to 3300 V. This is to prevent voltage drop that occurs when the inductance of the workpiece being tested (DUT) is low due to the fast startup of Hioki’s proprietary technology (A). -
Page 230: Circuit Configuration
Circuit Configuration 15.2 Circuit Configuration Circuit operations during tests A overview of the internal circuit of the instrument is shown below. 100 V - 3300 V The circuit operations after testing starts are as described below. The detection circuit gain is set automatically according to the output voltage. The set DC voltage (100 V to 3300 V) is generated by the booster circuit using switching. -
Page 231: Effects Of Cable Parasitic Components
3300 V Circuit Configuration Effects of cable parasitic components The equivalence circuit of the workpiece to be tested and the cable as seen from the output terminal is as described below. There is parasitic capacity between the core of the coaxial cable and the shield (Ccable1, Ccable2). Model L2250 capacity is approx. -
Page 232: Rack Mount
• Use the screws that were used in installation when shipped from the factory to mount to the rack. If you have lost a screw or find that a screw is damaged, please contact your authorized Hioki distributor or reseller. -
Page 233: Metal Fitting Dimensions
Rack Mount Metal fitting dimensions Rack mount base (JIS) SPCC t2.0 4 × M3 countersink Unit: mm... - Page 234 Rack Mount Rack mount base (EIA) SPCC t1.6 9 × M4 press nuts (protruding back) Rack mount panel (EIA) 9 × M4 countersink Unit: mm...
-
Page 235: Installation Method
Rack Mount Installation method When mounting the instrument on a rack, use a commercially available base for reinforcement. Required items Phillips screwdriver (No. 2), countersunk screws (M3 × 10 mm) ×4 Turn OFF the instrument power supply and remove the cable. Remove the screws ×4 that secure the support feet on the base. - Page 236 Rack Mount Required items Phillips screwdriver (No. 2) Turn OFF the instrument power supply and remove the cable. Remove the screws ×4 that secure the support feet on the base. Remove the top screws ×2, and remove the handle. Slide the instrument from the front of the rack mount fittings until it is all the way in.
-
Page 237: Dimensions Diagram
Dimensions Diagram 15.4 Dimensions Diagram Unit: mm 348±3 215±1 40.3±1 285.6±0.5 15.3±1... -
Page 238: Repeat Accuracy (Reference Value)
Repeat Accuracy (Reference Value) 15.5 Repeat Accuracy (Reference Value) Reproducibility of the voltage generated The max. value of the waveform obtained by applying the trigger with the terminal open is defined as the generated voltage. The typical values of the generated voltage variation during 100 repeat outputs is 0.16% max. when the set voltage is 100 V and 0.09% max. -
Page 239: Oscillation Waveform Reproducibility
Repeat Accuracy (Reference Value) Oscillation waveform reproducibility Describes the typical values of waveform variation when implementing impulse tests on the coil. The oscillation waveform when implementing impulse tests on a low-loss 1 mH coil using 1000 V is as described below. First peak voltage Third peak voltage Second peak voltage... -
Page 240: Max. Applicable Voltage (Reference Value) According To The Workpiece Inductance
Max. Applicable Voltage (Reference Value) According to the Workpiece Inductance 15.6 Max. Applicable Voltage (Reference Value) According to the Workpiece Inductance The smaller the inductance of the workpiece being tested, the stronger the impact of voltage drop inside the impulse winding tester, so the max. voltage that can be applied to the workpiece being tested will become smaller. -
Page 241: Voltage Switching Time (Reference Value)
Voltage Switching Time (Reference Value) 15.7 Voltage Switching Time (Reference Value) If implementing low-voltage impulse tests immediately after high-voltage impulse tests, leave enough time for the voltage inside the tester to fall. The longest interval is when switching from 3300 V to 100 V, and the 100 V impulse is output approx. -
Page 242: Waveform Differences (Typical Values) Between Instruments
Waveform Differences (Typical Values) Between Instruments 15.8 Waveform Differences (Typical Values) Between Instruments Even a slight difference in the interior of the impulse winding tester produces a difference in the oscillation waveform even if using the same workpiece and test leads. Instrument differences for the voltage peak value and cycle (zero-cross value) obtained with 14 Model ST4030 instruments when using the same workpiece and test leads are described as reference values. - Page 243 Waveform Differences (Typical Values) Between Instruments The instrument difference when measuring 1 mH coils is 1% max. How the instrument differences appear depends on the workpiece. The smaller the inductance, the more likely the instrument differences are affected. A comparison of the response waveforms for the two 10 µH coils with the greatest differences are shown in the following graph.
-
Page 244: Affects On Measurements According To The Length Of The Test Lead
Affects on Measurements According to the Length of the Test Lead 15.9 Affects on Measurements According to the Length of the Test Lead Even if measuring the same workpiece, the length of the test lead changes the waveform. Following are waveforms with test lead lengths of 1.5 m, 3.0 m, and 5.0 m. 1.5 m 3.0 m 5.0 m... -
Page 245: Precautions When Processing Test Leads
Model L2250 Clip Type Leads or Model L2252 Unprocessed Lead Cable to connect probes to the instrument. Model L2250 Clip Type Lead with a cable length of 3.0 m and 5.0 m are available on a special-order basis. Please contact your your authorized Hioki distributor or reseller. - Page 246 Precautions when Processing Test Leads Variations in oscillation frequency and variations in measurement cable inductance will have a particularly significant effect on test results when testing low-inductance workpieces. It is recommended that you bundle the 2 cables as shown below to minimize impedance changes due to shape.
-
Page 247: Ver. 1.01 Compatibility Function
• When a SET settings file saved by an ST4030 running firmware Ver. 1.00 or 1.01 is loaded by an ST4030 or ST4030A running firmware Ver. 1.02 or later, the same measurement operation as Ver. 1.01 will be performed for loaded tables only. Subsequent measurements made during voltage calibration or in BDV mode will consist of measurement operation added as new functionality in Ver. - Page 248 Precautions when Processing Test Leads...
-
Page 249: Index
Index Number Discharge judgments ..........72 Discharge judgments flowchart ........ 72 9151-02 GP-IB Connector Cable (2 m) ....154 DISP ............36, 78, 111 9637 RS-232C Cable (9pin-9pin/1.8 m) ....152 Disposal ..............220 9642 LAN Cable ............. 160 Double action function ..........106 Application disc............ - Page 250 Index I/F ................151 Magnetic saturation ..........22 Image save format ..........173 Main power supply............ 16 Importing judgment results ........144 Manual save ............170 Impulse response waveform....... 21, 53 Margin............... 58 INFO ............... 125 Master waveform imports ......... 49 Initialization .............
- Page 251 Index PULSE NUM............. 42 Table functions............25 PULSE PERIOD ............42 TCP/IP ..............159 Terminator............... 161 TEST ..............18, 126 Test conditions settings mode ........18 Test lead ..............14 QUERY ERROR ............. 164 Test mode ..............18 QUICK ..............170 Test pulse ..............
- Page 252 Index...
Need help?
Do you have a question about the ST4030A and is the answer not in the manual?
Questions and answers