Table of Contents
Advertisement
Quick Links
Read this Operation Manual carefully before using the
WARNING !
and safe operation. If you come up any question about this instrument or the
Manual, ask your Tomey representative or local distributor.
13-90013.03
Do not use this instrument by any procedures other than those specified in
this Manual.
Only well-trained or skilled personnel is allowed to operate this instrument.
Keep the Operation Manual in a place where you can easily access while
operating instrument.
OPERATION MANUAL
CHART PANEL
TCP-2000P
TCP-2000P
for proper
Advertisement
Table of Contents

Subscribe to Our Youtube Channel
Related Manuals for Tomey TCP-2000P


Summary of Contents for Tomey TCP-2000P
- Page 1 WARNING ! and safe operation. If you come up any question about this instrument or the Manual, ask your Tomey representative or local distributor. Do not use this instrument by any procedures other than those specified in ...
-
Page 3: Table Of Contents
CONTENTS 1. INTRODUCTION..................7 1.1. Safety precautions ................8 2. TECHNICAL DATA................. 10 3. INSTALLATION AND USE..............11 3.1. Package Content................11 3.2. Available tests................. 12 3.3. Installation..................20 3.3.1 Sockets / LEDs description ............20 3.5. Changing remote control channel..........22 4. - Page 4 4.13.13. Beep enabled ................41 4.13.14. Fixed distance enable .............. 42 4.13.15. Fixed distance................. 42 4.13.16. Demonstration mode ( Demo )..........42 4.13.17. Colour adjustment ( Masks ) ........... 42 4.14. Exiting Menu ................43 4.15. Shutdown system................44 5.
- Page 5 5.5.10.8. Exiting From File Manager............. 69 5.5.11 Reports ..................69 5.5.12 Patient Education ............... 70 5.5.13 Fixation Disparity Test............... 70 5.5.14 Fan and Block Test ..............70 5.5.15. Hearing and Speaking Impaired Tests........72 5.5.16. Crowding Bars................76 5.5.17. Amsler Test ................77 5.5.18.
- Page 6 11.2. Repairs..................111 11.3. Checking..................111 12. WARRANTY ..................112 Operation Manual...
-
Page 7: Introduction
Also for testing color recognition problems. This OPERATION MANUAL describes the purpose, overall view and user maintenance of the TCP-2000P LCD CHART PANEL. This manual is intended for medical and technical personnel who will perform tests on patients. -
Page 8: Safety Precautions
1.1. Safety precautions Power connections Before connecting the DC external Power Supply of the chart panel to the mains outlet, check that the local voltage and frequency ratings corresponds with the ratings of the PSU. External connection Do not connect any other external devices to the chart panel other than ... - Page 9 Disposal Disposal of the device, or parts of it, should be done according to local environmental and waste disposal regulations. Do not dispose to the nature. The manufacturer accepts no responsibility for any modifications made to the Chart Panel outside the factory. Operation Manual...
-
Page 10: Technical Data
2. TECHNICAL DATA Picture to Picture change time: 0,5s Adjustable refraction distance: 2 to 7m Background luminance: 200 cd/m2 Auto off function: 5,10,15 min - adjustable Up to three user program (15 steps each) available Power supply: external, ... -
Page 11: Installation And Use
3. INSTALLATION AND USE 3.1. Package Content No Spare part Part Number IR remote 96-13002.01 Power supply 06-50009 Power cord 3m 06-48015 Power cord 0,7m 06-49017 Red – Green glasses 33-07012.01 Polarizing glasses 33-07014.01 Battery for remote control 06-35002 Operating manual English 13-90013.xx Packing box and foams –... -
Page 12: Available Tests
3.2. Available tests Description Name of test TCP-2000P OPTOTYPES Snellen, LogMar, Sloan Snellen, modified, Letters Snellen Snellen Contrast, • Cyrillic Snellen, LogMar, Standard Snellen, modified, Allen Snellen Contrast, Symbols Hands HOTV • HYVA Symbols Pigassou Snellen, LogMar, Standard Snellen, modified,... - Page 13 Bailey-Lovie • Osterberg • Hearing Impared • Crowding bars • White-Black Cross Grid • Cross Grid ( white ) • Grid ( children ) • Cross Cylinder • Cross Cylinder • ( White ) Astigmatism Green • Operation Manual...
- Page 14 Astigmatism Green • Astigmatism Snellen • Fixation point • Amsler • Amsler • Amsler • Amsler • Red-Green (Anaglyph tests) Schober • Schober • Red- Green • Operation Manual...
- Page 15 Worth • Four dot • Vertical • Coincidence Horizontal • Coincidence Stereo • Fixation Disparity • Polarization tests Duochrome balance • • Stereo circles Worth • Phoria • Operation Manual...
- Page 16 Phoria with fixation • Accomodation balance • Accomodation balance • Accomodation balance • Accomodation balance • Minute Stereo • Vertical Coincidence • Horizontal • Coincidence Other tests Driving tests • Contrast Sensitivity • Operation Manual...
- Page 17 100 Hue • • D15 saturated D15 desaturated • FAN and Block • FAN and Block • FAN and Block • FAN and Block • Children images • Animations • Street Lamp Test • Operation Manual...
- Page 18 • filemanager • Reports • WiFi • iPad Communication • slideshow • Optotype randomization • PHOROPTERS POTEC TCP-2002(A) • POTEC TCP-2002(R) • TOMEY TAP-1000E • TOMEY TAP-1000C • UNICOS UDR-700 • UNICOS UDR-800 • TC ACP8 (IS) • Operation Manual...
- Page 19 TC ACP8 (H) • TC ACP8 (B(F)) • TC ACP8 (B(M)) • TC ACP8 (B1(F)) • TC ACP8 (B1(M)) • TC ACP8 (F) • TC ACP8 (C) • TC ACP8 (C1) • SN DR-900TC • Table 1. TCP-2000P available tests. Operation Manual...
-
Page 20: Installation
A – IR receiver window /status LED B – USB sockets C – 12 V DC Power socket D – Lamp socket The TCP-2000P Chart Panel is designed to operate on DC 12V provided by supplied external power supply. Operation Manual... - Page 21 3.4. How to operate chart panel with remote control. All functions of Chart Panel are controlled via IR remote control. Picture 2 describes functions of remote control buttons. Pic. 1. IR remote control. Operation Manual...
-
Page 22: Changing Remote Control Channel
3.5. Changing remote control channel. When two or more units of the TCP-2000P systems are used in the same room, a device failure may occur due to interference if the same remote control channels are used. In such case, set different channels for each remote control. There are 3 remote control channels available. -
Page 23: Chart Panel Configuration
4. CHART PANEL CONFIGURATION. If TCP-2000P Chart Panel is securely installed in its operating position, connect the power cord to the panel first, then the plug power cord to the power outlet. Chart Panel will start automatically. Flashing LED in bottom right corner will indicate start-up process. -
Page 24: Distance
4.1. Distance This option allows user to set proper distance between patient and TCP-2000P Chart Panel. It is crucial that this parameter is correctly set before first use of the Chart Panel. 1. Enter ‘Distance’, using Arrow Up or Arrow Down button. -
Page 25: Optotypes Config
4.3. Optotypes Config This option allows to choose optotype kind: letters/children/numbers and to turn on optotype negative mode Pic. 3. Optotype Negative Mode 1. Choose ‘Optotypes Config’ using Arrow Up or Arrow Down button. Press right Arrow to enter ‘Optotypes Config’ Press Arrow Up or Arrow Down to choose optotype kind. -
Page 26: Visus Units
2. Press Right Arrow to enter edit mode. 3. Use Up and Down Arrows to select parameter ‘Snellen Chart’, ‘LogMar Chart Modified’, ‘Snellen Chart Modified’ or ‘Snellen Contrast’. 4. Press Left Arrow to apply changes. Chart Type can be changed directly from IR remote. You can HINT ! select chart type using ‘CHART TYPE’... -
Page 27: Keep Parameters
Information about currently selected visus scale is continuously HINT ! displayed on the left top part of the screen. Set ‘Visus unit’ to ‘None’ to hide this information. 4.6. Keep Parameters When you activate this option, visus values (size), contrast, masks will not change when you switch to other chart types or tests. -
Page 28: Mirror
4.8. Mirror Option `Mirror` allows to display all tests in mirror presentation. 1. Enter ‘Mirror’, using Arrow Up or Arrow Down button. 2. Press Right Arrow to enter edit mode. 3. Use Up and Down Arrows to set edited parameter to ‘Yes’ or ‘No’ value. 4. -
Page 29: Phoropter
Pic. 6. Screen with white background 4.10. Phoropter Set this option to ‘Yes’ when you use TCP-2000P Chart Panel together with phoropter. Adjust colours ( see chapter 4.13.12. ) to assure interpretability with the phoropter colour filters. 1. Select ‘Phoropter’, using Arrow Up or Arrow Down button. -
Page 30: Programming Mode
4.11.1. Programming Mode To define your own program follow step 1 to 4: 1. Choose program you would like to edit using Arrow Up or Arrow Down. 2. Press Right Arrow, to enter Programming Mode. Now you can start building your program sequence. Select test you want to add to current program (picture, tests or masks). -
Page 31: Auto-Off
30min, 1h, 2h, 3h, 4h or 8h, or turn this feature off completely, depending on the customer needs. If TCP-2000P is in off-mode LED on the front panel is also off. To restart TCP-2000P simply press any key on the remote control. Time needed for startup is approximately 45sec. - Page 32 If the incorrect sequence has been entered, message ‘Invalid service code. Press any key’ appears. To repeat password entering operation press any button and repeat procedure. Service menu options: 1. Language 2. Distance units: meter, feet 3. Program 4. Variant Phoropter 5.
-
Page 33: Language
4.13.1. Language From the Language menu you can select one of available languages for displaying messages. 1. Select ‘Language’ from the list. Press right Arrow, to display list of available languages. 3. Press Arrow Up or Arrow Down button to move over language list. 4. - Page 34 There are 4 types of programs with different visus size and with different set of optotypes. DECIMAL LOGMAR 20/ft 10/ft 0.006 2.20 3200 1600 0.008 2.10 2500 1250 0.010 2.00 2000 1000 0.013 1.90 1600 0.016 1.80 1250 0.020 1.70 1000 0.025 1.60...
- Page 35 DECIMAL LOGMAR 20/ft 10/ft 0.006 2.20 3200 1600 0.008 2.10 2500 1250 0.010 2.00 2000 1000 0.013 1.90 1600 0.016 1.80 1250 0.020 1.70 1000 0.025 1.60 0.032 1.50 0.040 1.40 0.050 1.30 0.063 1.20 0.080 1.10 0.100 1.00 0.125 0.90 0.160 0.80...
- Page 36 DECIMAL LOGMAR 20/ft 10/ft 0.006 2.20 3200 1600 0.008 2.10 2500 1250 0.010 2.00 2000 1000 0.013 1.90 1600 0.016 1.80 1250 0.020 1.70 1000 0.025 1.60 0.032 1.50 0.040 1.40 0.050 1.30 0.100 1.00 0.20 0.70 0.25 0.60 0.285 0.55 17.5 10.5...
- Page 37 DECIMAL LOGMAR 20/ft 10/ft 0.006 2.20 3200 1600 0.008 2.10 2500 1250 0.010 2.00 2000 1000 0.013 1.90 1600 0.016 1.80 1250 0.020 1.70 1000 0.025 1.60 0.032 1.50 0.040 1.40 0.050 1.30 0.066 1.15 0.100 1.00 0.133 0.85 37.5 22.5 0.20 0.70...
-
Page 38: Variant Phoropter
14. TC ACP8 (C) 15. TC ACP8 (C1) 16. DR-900TC 4.13.5. Slideshow speed [s] The TCP-2000P in file manager allows slideshow images by pressing two times 'OK' button on image file. The option 'slideshow speed' sets time between images. Operation Manual... -
Page 39: Network Manager
With this option the results of the reports are available in computer network. To connect the TCP-2000P to the network you need compatible WARNING ! Compact Wireless USB Adapter (not included). For configuring the TCP-2000P network setup, you need to plug into USB ports: Compact Wireless USB Adapter ... -
Page 40: Sharing Manager
4.13.7. Sharing manager ‘Sharing’ option enables access to reports folder in the local network. Navigate between the setup fields using [TAB] key. HINT ! Mark / unmark a tic box using space bar. Exit share configuration using [ESC] key on RC To properly configure file sharing it is necessary to have WARNING ! adequate knowledge of network management. -
Page 41: Startup Visus
4.13.10. Startup Visus 1. Select ‘Startup Visus’ from the list. 2. Press Right Arrow to enter Press Arrow Up or Arrow Down to choose startup visus kind. 4. Press Left Arrow to apply changes. 5. Select ‘Previous Menu’ using Arrow Up or Arrow Down to exit from ‘Startup Visus’. -
Page 42: Fixed Distance Enable
NO/- buttons 4.13.16. Demonstration mode ( Demo ). Purpose of this mode is to present all TCP-2000P charts and tests at random cycle. This feature is mostly used during exhibitions and etc. 1. Select ‘Demo’, using Arrow Up or Arrow Down button. -
Page 43: Exiting Menu
4.14. Exiting Menu Select ‘Exit (SETUP)’ using Arrow Up or Arrow Down button. 1. Press Right Arrow to exit Service Menu. TCP-2000P will return to the last displayed test. Changes implemented will be saved after Chart Panel is turned off. -
Page 44: Shutdown System
Press ‘F3’ button to shut down system. Press ‘ESC’ button to cancel. Pic. 9. Shutdown system If you Press ‘SLEEP/OFF’ button for about 6 seconds, above screen will also appear. To start TCP-2000P simply press ‘SLEEP/OFF’ button on the remote control. Operation Manual... -
Page 45: Tests
5. TESTS This chapter includes all detailed information regarding charts and tests available in TCP-2000P Chart Panel. 5.1. Standard optotypes When working with optotype charts you can at any time change HINT ! contrast of the optotype. Use ‘YES/+’ or ’NO/-‘ buttons to set contrast level. -
Page 46: Chart Types
Pic. 10. Example of Snellen type chart TCP-2000P Chart Panel always starts with 20/400 visus ( 0,050 NOTE ! decimal ). The maximum size of the visus depends on distance setting. -
Page 47: Logmar Modified Type Chart Presentation
5.2.2. LogMar Modified type chart presentation The LogMar Modified chart is a superior design to the Snellen chart. A wide range of optotypes can be displayed in LogMar Modified format. Pic. 11. Example of LogMar Modified type chart. 5.2.3. Snellen Modified type chart presentation A wide range of optotypes can be displayed in Snellen Modified format Pic. -
Page 48: Snellen Contrast Type Chart Presentation
All signs on the screen have the same sharpness degree. NOTE ! When you press contrast adjustment buttons then contrast changes in the same way for all rows. NOTE ! More than one version of every stimulus displayed on the screen is always available. -
Page 49: Black-White Tests
5.3. Black-white tests To display one of black-white charts simply press button corresponding to its picture on IR remote. This will directly display selected chart. Test name description Cross grid Cross cylinder Fixation point Astigmatism Cross grid test has three presentations. To change from one presentation to another press again button or Right/Left Arrow. -
Page 50: Red-Green Tests
5.4. Red-green tests To display one of red-green charts simply press button corresponding to its picture on IR remote. This will directly display selected chart. Test name description Schrober Red-Green panel Schrober test has two presentations (colours reverse). To change from one presentation to another press again button or Right/Left Arrow ... -
Page 51: Other Tests
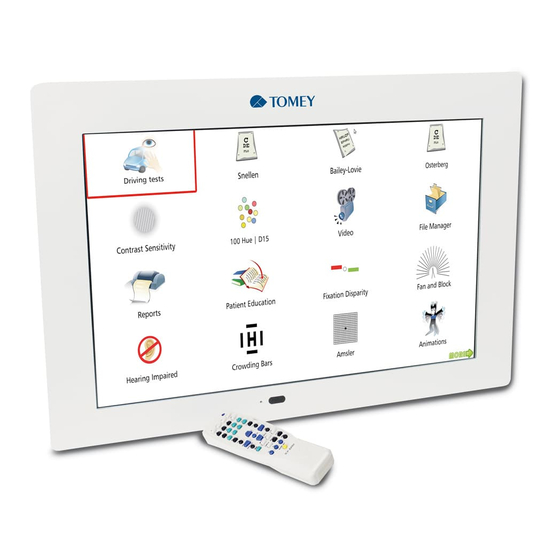
5.5. Other Tests ‘Other Tests’ To enter press MENU button. Pic. 14. Other tests Fitness to Drive Test ETDRS Charts Standard Snellen Chart Bailey-Lovie Chart Osterberg Contrast Sensitivity Test 100 HUE / D15 Tests ... - Page 52 Fan and Block Hearing Impaired Mode Crowding Bars Amsler Tests Animations Street Lamp Test Colour Pictures For Children Stereo images Images of an eye. Description of the IR remote How to navigate in ‘Other Tests’? 1.
-
Page 53: Fitness To Drive Test (Optional)
5.5.1. Fitness to Drive Test (optional) There is installed 5 kinds of Fitness to Drive tests: Visual Acuity (a standard optotype test, in accordance to 5.5..1.1), and opdional driving tests: Twilight Vision Glare Sensitivity Driving Contrast Sensitivity Photostress Recovery Time EU directives, 2006/126/CE and 2009/113/CE, changed the eligibility minimum requirements to obtain or renew driving license for people affected by visual diseases. -
Page 54: Twilight Vision Test
5.5.1.2. Twilight Vision Test For Twilight Vision test the environment shall be obscured with a backlight luminance of 1 or 2 lux. The test is conducted in binocular vision. After an adjustment to the environment light for ten minutes at most, proceed to evaluate the twilight visual acuity, starting from 0,1 line showed by the optotype. -
Page 55: Glare Sensitivity Test
5.5.1.3. Glare Sensitivity Test To conduct this test the additional lamps have to be NOTE! necessarily installed to the panel. The lamps are optional equipment and are provided separately – on request. Installation instructions are supplied with the lamps. In this test two lamps are situated both on the right and the left side of the chart panel. -
Page 56: Driving Contrast Sensitivity Test
5.5.1.4. Driving Contrast Sensitivity Test The test must be conducted in binocular vision, with bare eye or with correction in case of refractive vice. A line is considered read when two out three letters or three out five are correctly recognized. In case of subjects with lenses, affected by advanced preosbia a better correction with the addition of + 1.00 diopter might be needed. - Page 57 5.5.2. ETDRS Charts There is installed 6 kinds of ETDRS tests: Original Series ETDRS chart 1 Original Series ETDRS chart 2 Original Series ETDRS chart R Revised 2000 Series ETDRS Revised 2000 Revised 2000 Series ETDRS Revised 2000 Revised 2000 Series ETDRS Revised 2000 Pic.
-
Page 58: Standard Snellen Chart
5.5.3. Standard Snellen Chart Pic. 16. Standard Snellen Chart In Standard Snellen Chart single and horizontal HINT ! underlining, red-green mask are available. The report function is available for this test. Please, refer HINT ! 7 Report function. to chapter In Standard Snellen Chart Low Vision Mode is not WARNING available. -
Page 59: Bailey-Lovie Chart
5.5.4. Bailey-Lovie Chart In Bailey-Lovie Chart single and horizontal underlining, HINT ! red-green mask are available. The report function is available for this test. Please, refer HINT ! 7 Report function. to chapter In Bailey-Lovie Chart Low Vision Mode is not available. WARNING 5.5.5. -
Page 60: Contrast Sensitivity Test (Cst)
The report function is available for this test. Please, refer HINT ! 7 Report function. to chapter In Osterberg Chart Low Vision Mode is not available. WARNING 5.5.6. Contrast Sensitivity Test (CST) It is possible to enter CST in two ways: from ‘Other tests’ and pressing ‘CONTRAST’... - Page 61 Pic. 18. 100 HUE Test The patient is asked to arrange the dots so that the colours/hues go smoothly from the first pilot colour dot to the last (see Pic. 23. 100 HUE Test ). There is a predetermined sequence for each set. The closer the patient is to the correct sequence, the better his/her colour discrimination.
-
Page 62: Hue Report Function
In this way the patient goes through 4 sets of colour dots. When the fourth set has been arranged, a message ‘Click here or Press OK to finish’ appears at the bottom of the screen. When the whole test has been completed, a diagram with the results is generated. Pic. -
Page 63: D15 Saturated And D15 Desaturated Tests
5.5.8. D15 Saturated and D15 Desaturated Tests The D15 Tests is widely used in industries where colour decisions are critical. In a quick, precise and easy way the test determines colour vision abnormalities and checks patient’s ability to make color discrimination. The test can also be used to determine eye diseases, diabetes, Parkinson's disease and the effects of various pharmaceuticals on colour vision. - Page 64 In order to arrange the dots the patient has to drag each dot from the centre of the screen (using a computer mouse) and drop it in an appropriate ‘hole’ on the edge of the screen. When all the dots in one set have been fitted, a message ‘Click here or Press OK to finish’...
-
Page 65: D15 Saturated And D15 Desaturated Report Function
Pic. 24. D15 Desaturated Test report 5.5.8.1. D15 Saturated and D15 Desaturated Report Function 7 Report function For more information please, refer to chapter 5.5.9.Video This option allows you to play video. Please refer to chapters : 5.5.10 File Manager, 5.5.10.1 Entering File Manager Help. -
Page 66: File Manager
5.5.10 File Manager File Manager allows the user adding, playing and deleting own videos, images and animations . How to navigate in ‘File Manager’? To enter File Manager : 1. Use Arrows to highlight ‘File Manager’ and press ‘OK’ button on the remote control. 2. -
Page 67: Entering File Manager Help
TOTAL FREE: total available space ( KB ) 5.5.10.1 Entering File Manager Help 1. Press ‘F1’ button to enter FILE MANAGER HELP Pic. 26. File Manager Help 2. Press ‘ESC’ button to exit from FILE MANAGER HELP 5.5.10.2. Opening Removable USB Pen Drive Put USB PEN DRIVE into USB slot 1 and press REPORT button. -
Page 68: Deleting Files
left-right arrows. Select file using up/down Arrows, Cursor button (more files), YES/+ button (all files) Press ‘F2’ button to copy file. Press ‘OK’ button to confirm copying or ‘ESC’ button to cancel. After copying or deleting files you have to close USB PEN WARNING ! DRIVE using REPORT button. -
Page 69: Exiting From File Manager
1. Select video file using arrow up or down. 2. Press ‘OK’ button to play video. 3. Press up or down button to adjust volume. 4. Use ‘OK’ button to pause/play video. 5. Press right arrow to forward 10s. 6. Press left arrow to rewind 10s. 7. -
Page 70: Patient Education
5.5.12 Patient Education This option allows educating the patient about e.g. eye structure, methods of treatment etc. There is a possibility to add own presentations: images, HINT ! video. Please, contact with the local distributor. 5.5.13 Fixation Disparity Test Press ‘OK’ button to enter Fixation Disparity Test. 1. - Page 71 Pic. 27. Fan test ( Black) Pic. 28. Fan test ( white ) Pic. 29. Block test ( white ) Operation Manual...
-
Page 72: Hearing And Speaking Impaired Tests
Pic. 30. Block test ( white ) 5.5.15. Hearing and Speaking Impaired Tests The Chart Panel allows for communicating with hearing and speaking impaired patients not only during a regular examination, but also when they are being refracted. This mode is designed to enable giving instructions and asking questions of deaf patients. - Page 73 Tests available in Hearing and Speaking Impaired Mode: Pic. 31. Hearing and Speaking Impaired Tests Sloan letters Numbers Snellen E Landolt Rings Standard pictures Allen HOTV Hands Symbols HYVA Operation Manual...
- Page 74 Sample instructions for hearing and speaking impaired patients: I. Instructions for patients being presented with: Sloan Letters, Numbers and Standard Pictures: When two bars, blue at the top and green at the bottom of the display are presented, the examiner is indicating to you that you are going to see two new choices.
- Page 75 To obtain more reliable results, matching technique can be applied also to Pictures and Numbers, as there are not many optotypes to choose from. If you recognize choice two, you are asked to point to an appropriate letter from the chart received from the doctor. If you do not recognize choice two, point with your right hand to the side.
-
Page 76: Crowding Bars
5.5.16. Crowding Bars There are 25 options of tests with crowding bars: Pic. 32. Crowding Bars 1. To enter a test with crowding bars, choose one and press ‘OK’ button. 2. To display charts with optotypes of different sizes use Up and Down Arrows (Down Arrow –... -
Page 77: Amsler Test
5.5.17. Amsler Test There are three options of Amsler test: Black bars on white background White bars on black background Red bars on black background Use left and right arrows to proceed from one test to another. 5.5.18. -
Page 78: Stereo Images
5.5.21. Stereo Images There are installed two kinds of stereo tests: SIRDS images ( Single Random Image Dot Stereograms ) Stereo circles test 5.5.21.1 SIRDS – Single Image Random Dot Stereograms Pic. 33. SIRDS Image Single Image Random Stereograms (SIRDS, sometimes... - Page 79 There are many ways to teach this de-coupling to either yourself or to others, including (in almost no particular order): It is generally easier to see Stereograms under bright light NOTE ! because your eye relies less on focus under harsh conditions.
-
Page 80: Eye Pictures
You can't see anything, what now ?? If you don't manage to see the amazing pictures hidden inside the autostereograms immediately, don't let it get you down. Your brain needs time to switch between 'NORMAL' vision to that of stereoscopic vision. Try not to force your eyes when focusing. -
Page 81: Polarization Tests
5.6. Polarization tests To display one of polarization charts simply press button corresponding to picture on IR remote. This will directly display selected chart. Test name description Duochrome Balance Horizontal, Vertical Coincidence Polarized Double Panel Phoria Stereo Worth (polarazing) NAVIGATION: To change from one test to another press Down/Up Arrow ... -
Page 82: Ishihara Tests
5.7. Ishihara tests 1. Press to display first Ishihara test. 2. Press Right Arrow to display next test. 3. Press Left Arrow to display previous test. 4. Press Up Arrow to jump 10 tests forward. 5. Press Down Arrow to jump 10 tests backward. 6. -
Page 83: How Contrast Sensitivity Test Works
sizes, a contrast sensitivity test measures two variables, size and contrast. The ability to detect objects of different sizes at lower contrasts is expressed as a contrast sensitivity function (CSF). The test determines the person’s contrast detection threshold, the lowest contrast at which a pattern can be seen. Only standard letter tests combined with contrast sensitivity tests can provide the opticians with a complex knowledge about their patient’s visual condition. - Page 84 There is a beep signal after each answer. Continue this procedure throughout the test. The information about the present contrast sensitivity and spatial frequency is displayed in the right-bottom corner. Pic. 38a Left gratings, Pic. 38b Vertical gratings, Pic. 38c Right gratings. The test starts at the lowest spatial frequency and goes through 8 levels of contrast sensitivity.
-
Page 85: Contrast Sensitivity Report Function
HORIZONTAL PART: 1. The first circle is displayed. The patient has to recognize the direction of the top of each grating and name it: down (picture 39a), horizontal (picture 39b), up (picture 39c). Pic. 39a Down gratings, Pic. 39b Horizontal gratings, Pic. 39c Up gratings. 2. -
Page 86: Contrast Adjustment
contrast are obtained by concurrently varying the luminance of the light and dark bands as to keep the mean luminance unvaried. mean L = (Lmax + Lmin) / 2 C = (Lmax – Lmin) / (Lmax + Lmin) S = (Lmax + Lmin) / (Lmax – Lmin) L –... - Page 87 1. Select any optotype chart. It will be displayed at 100%. 2. To change contrast level press ‘YES/+’ or ‘NO/-‘. For instance, to set contrast to 80% press ‘NO/-‘ button twice. Pic. 40 Contrast test Operation Manual...
-
Page 88: Masks
'OK' button. Information is visible for a few seconds. Information that TCP-2000P is in the mask mode is continuously displayed in the left bottom corner of screen. Depending which mask type you are using different shapes are displayed: square –... -
Page 89: Single Mask
To switch off mask simply press button that corresponds to mask type you are currently using. You can switch from one mask type to another without need of switching off current mask. 6.1. Single mask Allows you to select single mask over selected chart of optotypes. 1. -
Page 90: Vertical Mask
3. Press again to deactivate. Pic. 42 Horizontal mask 6.3. Vertical mask Allows you to select vertical mask over selected optotype chart. 1. To activate press 2. Use Arrows to move mask in any direction. 3. Press again to deactivate. Pic. -
Page 91: Red-Green Mask
By default, masks are not available for LogMar Modified type WARNING ! chart, ETDRS chart and Standard Snellen chart (in ‘Other Tests’). Instead there is an option of underlining: - a single optotype (with button) - a line (with button) You can turn on single line presentation for these charts in service menu, see sections 4.13.11 and 4.13.12. -
Page 92: Polarization Mask
Pic. 44 Red-green mask 6.5. Polarization mask There is no accessible polarization mask in TCP-2000P panel. WARNING ! Polarization test will be activate by pressing button. 7. Report function Report function is available for all Optotype Tests, Fixation Disparity Test and Contrast Sensitivity Test. - Page 93 If the patient was registered without entering name data, there will be information: ANONYMOUS To cancel registration use ESC button. HINT ! After the new patient has been registered, the TCP-2000P will return to the last displayed test. Operation Manual...
-
Page 94: Optotypes Chart Report
7.2 Optotypes Chart Report. 1. Choose an optotype test that interests you, e.g. press ‘A’ button. Set contrast value for the test using YES/+ or NO/- buttons. 2. Press ‘CURSOR’ button. On the left side of the screen a blue vertical line will appear. - Page 95 When the complete examination for a particular test is conducted, the result of the examination should be saved. 5. Press REPORT button. A message ‘SELECT EYE FOR REPORT’ will appear. Continue according to the info on the screen and press: 6.
-
Page 96: Contrast Sensitivity Test Report
again either for the other eye or for both eyes. You can also do a different test. If you want to finish testing and create a report, choose option SAVE AND CREATE REPORT. If you want to cancel the operations, choose option CONTINUE ... - Page 97 1. Press REPORT button. A message ‘SELECT EYE FOR REPORT’ will appear. Continue according to the info on the screen and press: 2. When you have chosen the eye, following screen will appear. If you want to save the result of the test and continue the examination, ...
-
Page 98: Hue And D15 Tests Report
If you want to finish testing and create a report, choose option SAVE AND CREATE REPORT. If you want to cancel the operations, choose option CONTINUE WITHOUT SAVING CONTINUE If you have chosen option WITHOUT SAVING, following screen will appear. Press ESC button to continue examination ... - Page 99 2. When you have chosen the eye, following screen will appear. If you want to save the result of the test and continue the examination, choose option SAVE AND CONTINUE. You can do the same test once again either for the other eye or for both eyes. You can also do a different test.
- Page 100 CONTINUE If you have chosen option WITHOUT SAVING, following screen will appear. Press ESC button to continue examination Press REPORT button to generate a report of already done tests. Press OK button to unregister the patient. When you have generated a report, the current patient’s data is WARNING ! deleted.
-
Page 101: Fixation Disparity Test Report
7.5 Fixation Disparity Test Report Please do Fixation Disparity Test according to instructions in chapter 5.5.13 Fixation Disparity Test 1. Press REPORT button. A message ‘SELECT EYE FOR REPORT’ will appear. Continue according to the info on the screen and press: 2. - Page 102 If you want to save the result of the test and continue the examination, choose option SAVE AND CONTINUE. You can do the same test once again either for the other eye or for both eyes. You can also do a different test.
-
Page 103: Copying And Deleting Report
Reports are saved in chart panel permanently even after shut down of the device and they can be printed via iPad or copied on removable USB Pen Drive. Please refer to chapters : 5.5.10 File Manager, 5.5.10.1 Entering File Manager Help. - Page 104 Operation Manual...
- Page 105 Operation Manual...
- Page 106 Pic. 46 Example Chart Panel Report Operation Manual...
-
Page 107: Software Version
Information about current version of chart panel software is displayed in right bottom part of Configuration Menu screen. 9. TROUBLESCHOOTING All possible failures are listed in table. Failure Cause Action TCP-2000P Fails Power cord broken or -Check power cord operate when connected power cord not connected -Check power cord connection to the mains ( Power LED or no voltage in mains. - Page 108 Message: -Printer broken or power -Check power cord Could not print cord not connected or no -Check power cord connection document. IF PROBLEM voltage in mains. -Check main voltage in wall socket. PERSISTS CONTACT -Check printer Cable SERVICE -Call service -Mother board or power -Call service supply defective.
-
Page 109: Warnings
10. WARNINGS Exercise care to locate the Chart Panel away from any hazardous sources. It has been tested to the following specification: EN 60601-1-2:2001+A1:2006 Medical electrical equipment. General requirements for basic safety and essential performance. Excessive interference may affect the Chart Panel operation. If it occurs the ... -
Page 110: Chart Panel Maintenance
11. CHART PANEL MAINTENANCE 11.1. Cleaning When carrying out cleaning, the CHART PANEL shall be switched off and disconnected from mains. After cleaning wait at least one minute before switching on the chart panel. Cleaning shall be carried out using a piece of cloth moistened with cleaning solution. - Page 111 11.2. Repairs In order to ensure long life time of Chart Panel, it is necessary to check periodically its status and replace the parts if damaged. In the case on any fault of the Chart Panel immediately consult the ...
- Page 112 12. WARRANTY The Manufacturer warrants the high-quality workmanship of the Chart Panel for a period of 24 month after the purchase date. The Manufacturer or its authorized representatives takes obligation to carry out the warranty repair of the Chart Panel or to replace it with an operational one in case the Manufacturer or its authorized representatives determines that the cause of Chart Panel’s failure was related to the manufacturing process.
- Page 113 Manufacturer: Distributor: FREY TOMEY GmbH 05-502 Piaseczno Wiesbadener Straße 21 Wolodyjowskiego 38 90427 Nürnberg POLAND GERMANY Operation Manual...
Need help?
Do you have a question about the TCP-2000P and is the answer not in the manual?
Questions and answers