Table of Contents
Advertisement
Quick Links
INSTRUCTION MANUAL
Topographic Modeling System
Read this manual thoroughly before using the
instrument to ensure correct and safe operation.
Contact Tomey Corporation or our local distributor
if you have any questions or you encounter any
problems during operation.
■ Always follow the operation
■ Keep this manual in a readily accessible
■ Contact our local distributor if you lose
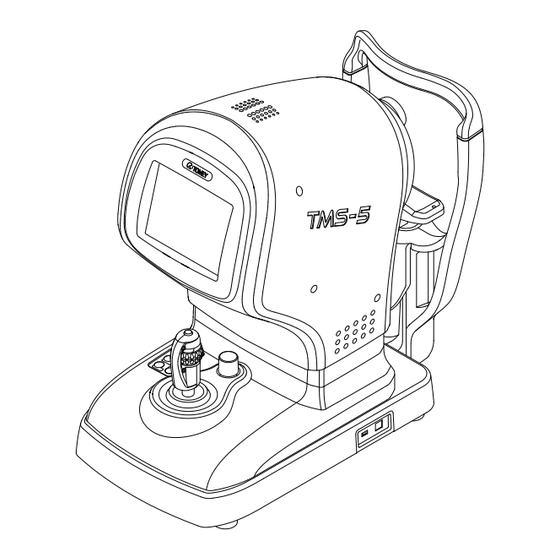
TMS-5
procedures described in this manual.
location while operating this instrument.
this manual.
229A9090-1D
Advertisement
Table of Contents

Related Manuals for Tomey TMS-5


Summary of Contents for Tomey TMS-5
- Page 1 Topographic Modeling System TMS-5 Read this manual thoroughly before using the instrument to ensure correct and safe operation. Contact Tomey Corporation or our local distributor if you have any questions or you encounter any problems during operation. ■ Always follow the operation procedures described in this manual.
-
Page 3: Important Safety Information
Refer to “8. Specifications” for the performance requirements of the personal computer and Isolation transformer. Contact our local distributor or Tomey Corporation if you have any questions. „ Use a personal computer conforming to IEC60950-1 and an Isolation transformer conforming to IEC60601-1. - Page 4 „ Do not place water or chemicals on the instrument. Any water or chemicals entering the instrument may cause an electric shock or failure. „ This instrument is a diagnostic/capturing device specifically designed for ophthalmology. Never use the instrument for other purposes. „...
- Page 5 „ Never mark or damage the caution labels on the instrument. The caution labels are provided at two locations as shown below. „ If a label is damaged or becomes illegible, please contact Tomey Corporation or our local distributor. Main unit...
- Page 6 This page is intentionally blank...
-
Page 7: How To Read This Manual
ii How to read this manual Outline This manual is structured as follows. 1. PRIOR TO USE Describes safety precautions and important information to be understood before installing and using the instrument. 2. NAMES AND FUNCTIONS OF PARTS AND COMPONENTS Describes names and functions of each section of the instrument. -
Page 8: Symbols Used In This Manual
SYMBOLS USED IN THIS MANUAL Sentences accompanied with the symbols below indicate the following: „ This is a precaution that, if unheeded, will result in a hazardous situation where there is an imminent danger of serious injury or death. „ This is a precaution that, if unheeded, could result in a hazardous situation where there is a possibility of serious injury or death. -
Page 9: Table Of Contents
iii Contents i Important safety information ..................i-1 ii How to read this manual ..................ii-1 Outline ........................ ii-1 SYMBOLS USED IN THIS MANUAL ..............ii-2 1. PRIOR TO USE .....................1-1 1.1 Precautions for operation ................1-1 1.2 Checking package contents ................ 1-6 1.3 Glossary .......................1-7 1.4 Indication for Use .................. - Page 10 3.3.1 Turning the power on ................3-7 3.3.2 Entering patient information ..............3-9 3.3.3 Selecting the capture mode ..............3-10 3.4 Capturing ....................3-11 3.4.1 Patient's eye height adjustment ............3-11 3.4.2 Using the joystick ................3-12 3.4.3 Capturing in ring topo mode ...............3-13 3.4.4 Capturing in slit mode .................3-16 3.4.5 Checking captured images ..............3-19 3.5 Settings for main unit ................
- Page 11 4. TECHNICAL INFORMATION ................4-1 4.1 Corneal refractive index used to calculate refractive power distribution ..4-1 4.2 Calculating the keratometer simulation values ..........4-1 4.3 Refractive power correction by analysis of capturing in slit mode ....4-2 4.4 Axial direction and symbol of alignment and pupil offset .........4-2 4.5 Direction of external light interference that affects capturing in slit mode ...
- Page 12 8.3 Operating environment ................8-3 8.4 Classification ....................8-3 8.5 Declaration of conformity to EMC ............... 8-4 8.6 Classification by ISO15004-2 Group 2 instrument ........8-8 9. INDEX ........................9-1 iii-4...
-
Page 13: Prior To Use
1. PRIOR TO USE „ Read this manual thoroughly before using the instrument to ensure proper and safe operation. „ Always follow the operation procedures described in this manual. „ Check that there are no devices that generate a strong magnetic field near the instrument. - Page 14 Do not connect a device with data transmission specifications that are not compatible. Fire or electric shock may occur. Contact Tomey Corporation or our local distributor before using the instrument while connected to another device.
- Page 15 „ Precautions during operation Do not place any container with liquid in it on the instrument. Any liquid entering the instrument may cause electric shock or failure. Be sure to touch the “New Patient” button to delete the measurement data for the previous patient before measuring a new patient.
- Page 16 If any smoke, offensive odor, or abnormal sound occurs, turn off the instrument immediately, disconnect the power plug from the outlet, and contact our local distributor or Tomey Corporation. „ Precautions after operation Do not place any container with liquid in it on the instrument. Any liquid entering the instrument may cause electric shock or failure.
- Page 17 Use the power cord and fuses provided with the instrument or specified by Tomey to ensure safety. Also, do not use the accessories provided with the instrument for other equipment.
-
Page 18: Checking Package Contents
● Model eye (for 31 rings topo mode) ......1 ● Model eye (for slit mode) ......... 1 ● Hood ................ 1 ● OKULIX USB GUID ..........1 ● TMS-5 INSTRUCTION MANUAL (this manual) ..1 ● TB-1000 INSTRUCTION MANUAL ......1 ● TB-1000 INSTALLATION CD ........1... -
Page 19: Glossary
Glossary [AS] : Auto Shot. Function to automatically start measurement when the patient's eyes are within the measuring range. [MS] : Manual Shot [AA] : Alignment Assist. Auxiliary alignment function in vertical direction only. When the patient’s eye is close to the measuring range, the head position automatically moves up/down toward the alignment target. - Page 20 [Capture mode] : Ring topo mode and slit mode are available in this instrument. [RING TOPO mode] : Similar to conventional TMS, a mode to capture images of the anterior shape of the cornea by projecting ring-shaped light onto the cornea of the patient’s eye [Slit mode] : Image of a corneal cross-section captured using the Scheimpflug principle in slit mode...
- Page 21 [Absolute scale] : Absolute scale (ABS) uses the color coding developed by Professor Stephan D. Klyce of Louisiana State University (LSU). It divides the range between 9 and 100 diopters into 26 sections, and allocates specific colors. For all eyes measured, this scale shows the same refractive power for all parts with the same color, thereby facilitating comparison with other measurement results.
- Page 22 [Picture perfect] : Manual mode with automatic correction This function of the TMS series automatically corrects errors in sight alignment generated by the physician in the left/right (X axis), up/down (Y axis), and back/forth (Z axis) directions. This function is also designed to display the most accurate map possible by capturing images in a range with the X, Y, and Z offset, using the software.
-
Page 23: Indication For Use
Indication for Use TMS-5 is an anterior segment analyzing system that is designed to capture Scheimpflug images and topographer measurements of the anterior segment of the eye to provide information including anterior/posterior corneal topography, anterior/posterior corneal elevation maps,pachymetry and anterior chamber depth. - Page 24 This page is intentionally blank 1-12...
-
Page 25: Names And Functions Of Parts And Components
2. NAMES AND FUNCTIONS OF PARTS AND COMPONENTS System 2.1.1 Overview (1) Main unit (ME device) Unit used to capture images (2) Personal computer (Optional) The personal computer that receives the data from the main unit, and displays, saves, and manages the data. -
Page 26: Connection Diagram
2.1.2 Connection diagram AC power input AC power input Isolation transformer (Optional) USB cable Personal Main unit computer (Optional) ME device Non-ME device... -
Page 27: Front Of The Instrument (Physician's Side)
Front of the instrument (physician's side) (8) (9) (11) (13) (10) (12) (15) (14) (1) Head Unit used to capture images (2) Monitor / touch panel Displays the capture screen and various setting screens. Touch the touch panel buttons shown on the LCD to make various settings and operate the instrument. (3) Joystick Tilting the joystick to the left, right, back, and forth moves the head to the left, right, forward, and backward for fine positioning. - Page 28 (5) Up/down ring Moves the head up and down. Moving the ring up and down moves the head for rough positioning. Turning the ring moves the head for fine positioning. (6) Measurement section stopper Lock to fix the main unit when moving and/or transporting it (7) Eye level mark Adjust the height of the chin rest so that the patient's eyes are aligned with this mark.
-
Page 29: Rear Of The Instrument (Patient's Side)
Rear of the instrument (patient's side) (1) Ring cone capture window Images of the patient's eye are captured in ring mode through this capture window. (2) Slit cone capture window Images of a patient's eye are captured in slit mode through this capture window. (3) Chin rest The patient places their chin on this rest. -
Page 30: Screen Of The Main Unit
Screen of the main unit 2.4.1 Ring topo mode screen (12) (12) (10) (11) (13) (15) (14) (1) Eye display [R]/[L] Displays which side (left or right eye) the head is placed, differentiated by colors. (2) Timer for capturing Displays available time left for capturing images. Counts down from 60 seconds. (3) Mode display Displays the current capture mode. - Page 31 (6) Communication status with TMS-5 core software “OK” is displayed when communication with the TMS-5 core software is normal and images can be captured. “X” is displayed when communication with the TMS-5 core software is not available. (7) “Set Up” button Displays the setting screen.
-
Page 32: Slit Mode Screen
(4) Communication status with TMS-5 core software “OK” is displayed when communication with the TMS-5 core software is normal and images can be captured. “X” is displayed when communication with the TMS-5 core software is not available. - Page 33 (5) “Setup” button Displays the setting screen. (6) “Mode” button Switches the capture mode. Ring topo mode / Slit mode (7) “Temp” button Displays the temporary setting screen. Set specific conditions for the current process only. (8) Alignment mark Align the center of the patient's eye with this position. (9) Captured data display Displays the number of images to be captured.
-
Page 34: Personal Computer Screen
Also, register new patient or modify information for an existing patient. (4)“Do Exam” button area Used for capturing images by TMS-5. Click this button to open the Capture screen. (5) “Patient ID” field Enter the patient ID. After ID is input, the “Exact search” or “Similar search” are done with “Enter.”... - Page 35 a) Menu bar Each menu consists of the following pull-down menus. 「File」 ● Export Patient List (Refer to “3.8.5 Export patient list.”) Exports a list of all patients registered in the database. ● Exit Exits the program. 「Message」 ● Patient information Displays and hides the detailed patient information.
- Page 36 ● Import (Refer to “3.8.4 Import.”) ● Export / Delete (Refer to “3.8.3 Exporting/deleting examination data.”) ● Data Tables (Refer to “3.8.2 Data Tables.”) ● Default Window Size Changes the size of the Examination List screen to the default size when starting the software.
- Page 37 (7) Data Tables Same as “Import” > “Import Exam” in the Utility menu. (Refer to “3.8.2 Data Tables ”) (8) Scrap Book Opens the Scrap Book screen. c) Patient list (1) Patient information search Enter the patient ID and name to search for a patient. (Refer to “3.8.1 Handling patient ID.”) (2) Patient list Lists the patient IDs found by the search.
- Page 38 d) Examination data display area The examination data of all patients selected in the patient list is displayed in the examination data display area. (1) Patient information Displays the information of the patient currently selected. (2) Examination data tree Displays the examination data in tree format according to the examination date. The tree for the specified date and examination data can be marked.
-
Page 39: Capture Screen
2.5.2 Capture screen a)Capture screen (10) (1) Patient information field The ID and name of the patient is shown here. (2)(Cone type 25 or 31 is shown according to the number of ring cones to be used. (3) Connected device The S/N (serial number) of the applicable TMS is shown. - Page 40 (5) Right eye image display area The captured image of the right eye and offset value is shown. When capturing is completed, the image with the smallest offset misalignment is shown at the top. The color map is overlapped on the image when analysis is completed. (6) Left eye image display area The captured image of the left eye and offset value is shown.
- Page 41 b)Exam (MERGED) screen (1) (2) (10) (1) Patient information display The ID and name of the patient is shown here. (2) Analysis date and time The date and time when the Exam (MERGED) screen was opened are displayed. (3) Inspected eye The inspected eye is displayed.
- Page 42 (8) “Mires/Slit OK” button Saves images captured in ring topo mode and slit mode, and the corresponding analysis results, and displays the Map (MERGED) screen. (9) “Cancel” button Cancels analysis and returns to the Capture screen. (10) “Manual” button Allows you to set the corneal center when it cannot be detected on the captured image. 2-18...
- Page 43 c)Pre Map screen (1) Patient information Displays the patient information. (2) Inspected eye The inspected eye is displayed. OD / OS (3) Captured image display area Displays captured images of an eye in chronological order from the upper left to the lower right.
- Page 44 d)Exam (RING) screen (1) Analysis date and time The date and time when the Exam (RING) screen was opened are displayed. (2) Cone type The type of cone used for capturing images is displayed.25 / 31 (3) Inspected eye The inspected eye is displayed. OD / OS (4) PP (picture perfect) The picture perfect status when capturing an image is displayed.
- Page 45 (8) “Manual” button Allows you to set the corneal center when it cannot be detected on the captured image. (9) “Cancel” button Returns to the Pre Map screen or Capture screen without performing analysis. 2-21...
-
Page 46: Analysis Screen
2.5.3 Analysis screen (6) (7) (11) (10) (12) (1) “File” button ● Print Preview Displays a print preview of all analysis screens of the current viewer. ● Close Closes the Analysis screen and returns to the previous screen. (2) “View” button ●Analysis screen Switches various analysis screens. - Page 47 (3) “Utility” button ● System Setup Performs various settings. (Refer to “3.9 System Setup.”) (4) “Save” button Captures the displayed Analysis screen and saves it in JPEG or BMP format. (5) “Print preview” button Displays a print preview. (6) “Print” button Prints the displayed screen.
- Page 48 (11) Patient information / Inspection date and time Displays the patient information and the inspection date and time. (12) Inspected eye The inspected eye is displayed. OD (Right) / OS (Left) 2-24...
- Page 49 a)MERGED TOPO viewer Thumbnail Image Single Map 4Maps 6Maps Fourier Map Merged Calculation Slit Calculation 2-25...
- Page 50 Ectasia Screening IOL Screening b)RING TOPO viewer Single Map Fourier Map Klyce Corneal Statistics Keratoconus Screening Ring Calculation 2-26...
-
Page 51: Operation Procedures
3. OPERATION PROCEDURES Safety precautions 3.1.1 Precautions for installing the instrument „ Install the instrument in a location free of water or chemicals. Any water or chemicals entering the instrument may cause an electric shock or failure. „ Do not install the instrument in a location where chemicals are stored or gases may occur. -
Page 52: Precautions For Connecting The Power Cord
3.1.2 Precautions for connecting the power cord „ Check the frequency, voltage, and allowable current (or power consumption) of the power source. Otherwise, fire or electric shock may occur. „ Connect the power plug to a grounded 3-pin outlet. Other wise, a shor t circuit due to failure of the instrument may result in electric shock. -
Page 53: Precautions For Laser Beam
Tomey Corporation or our local distributer. „ The laser beam is emitted through the lens behind the cone in the main unit. Never operate the instrument when this lens is damaged. -
Page 54: Preparation Before Use
Preparation before use 3.2.1 Considerations for external light interference Use the attached hood if there is any external light interference when capturing in slit mode. Follow the steps below to attach the hood. 1) Insert holder L and holder R (1) into the chin rest. (Fig. 1) Do not force the holders. -
Page 55: System Connection
3.2.2 System connection „ Turn off the power switches before connecting devices to the instrument. Otherwise, failure may occur. „ Do not switch the maintenance switch (1) from left to right. Our service personnel use this switch for maintenance. The instrument does not operate when the switch is set to the right. -
Page 56: Release Measurement Section Stopper
3.2.3 Release measurement section stopper Turn the measurement section stopper counterclockwise. The measurement section does not move even though the joystick is operated while the measurement section stopper is locked. When moving or storing the instrument, align the top section with the bottom section of the instrument, then push the stopper in and turn it clockwise to lock it. -
Page 57: Preparation For Capturing
1) Turn on the power switches of the isolation transformer and personal computer to start Windows®. 2) Double-click “TOMEY Measurement ” (1) on the personal computer. (Fig. 1) The log in screen (Fig. 2) appears. - Page 58 4) Turn on the power switch (2) of the main unit. The title screen (Fig. 5) appears and then the measurement screen (Fig. 6) appears on the display of the main unit. The message “Move the joystick backward” appears on the screen to initialize the internal motor etc.
-
Page 59: Entering Patient Information
3.3.2 Entering patient information (Fig. 1) The patient needs to be selected on the Examination List screen (Fig. 1) before capturing images. ● Recall the registered patient information. ● Register a new patient. ● Perform measurement without registering the patient. Refer to “3.8.1 Handling of patient ID”... -
Page 60: Selecting The Capture Mode
3.3.3 Selecting the capture mode The ring topo mode (for capturing a corneal shape) and slit mode (for capturing a cross-section of the anterior chamber) are available. „ When changing the capture mode of the instrument, pay attention to prevent any moving parts from hitting the patient’s eye or nose. -
Page 61: Capturing
Capturing „ Faulty fixing of the sight, eyelid drooping, trichiasis, corneal diseases, etc. may affect the measurement result. „ When the measurement image is unclear, select or measure another image. „ Be sure to touch the “New Patient” button on the Capture screen of the personal computer to delete the measurement data for the previous patient before measuring a new patient. -
Page 62: Using The Joystick
3.4.2 Using the joystick „ When using the joystick to operate the instrument, pay attention to the position of the patient's face, hands, and fingers. The patient may be injured by the movement of the head or chin rest. „ Do not allow the patient to place their hands and fingers in any clearance on the main unit. -
Page 63: Capturing In Ring Topo Mode
3.4.3 Capturing in ring topo mode „ Capturing images is normally completed within 15 seconds. The instrument is designed to complete capturing and stop emitting the laser beam when capture mode continues for 60 seconds. 1) Select the ring topo mode. (Refer to “3.3.3 Selecting the capture mode.”) 2) Check that the cone type to be used (1) is correct. - Page 64 in the upper left of the screen. The maximum emitting time is set to 60 seconds for safety. When the emitting time runs from 60 to 0, radiation of laser beam stops even if capturing is not completed. Touch the “Stop” button (6) to immediately stop radiation of the laser beam and capturing images.
- Page 65 10) The following two methods are available to capture images for the same patient in ring topo mode again. [When deleting the selected image] Right-click the image to be deleted on the Capture screen (Fig. 4) to open the Map Options Menu (Fig. (Fig.
-
Page 66: Capturing In Slit Mode
3.4.4 Capturing in slit mode „ Faulty fixing of the sight, eyelid drooping, trichiasis, corneal diseases, etc. may affect the measurement result. „ When the measurement image is unclear, select or measure another image. a) 3D scan 3D scan data is obtained by capturing images of a cross section of the anterior chamber in series, while turning the capturing position. - Page 67 6) Double-click an image after capturing is completed in both ring topo mode and slit mode, and the Exam (MERGED) screen (Fig. 4) opens. (Fig. 4) 7) When capturing is conducted in slit mode again for the same patient, click the “Cancel” button (6) on the Exam (MERGED) screen (Fig.
- Page 68 b) 2D scan The preset number of images of a cross-section of the anterior chamber are captured in series from the specified angle. 1) Press the “Temp” button (1) to open the slit mode temporary screen (Fig. 2). 2) Select “2D scan” (2) and specify the number of images to be captured (3).
-
Page 69: Checking Captured Images
3.4.5 Checking captured images (Fig. 1) 1) The program evaluates the image qualit y and automatically implements corrections if focusing is misaligned, and the rings of the captured image are scanned in the ring topography image display area (1), The analyzed ring data is plotted in green on the image of the cornea (Mires). - Page 70 2) An image captured in slit mode can be checked on the slit image display area (4). Use the track bar (5) to play captured cross-sectional images in series or to display the next or previous captured images one by one. 3) Touch the “Mire &...
-
Page 71: Settings For Main Unit
Settings for main unit 3.5.1 Initial setup (Setup) Set operation conditions on this screen. „ After changing the settings, be sure to touch the “Save” button to exit the screen. If the “Cancel” button is touched, changes to the settings are not applied and the previous setting remains effective. - Page 72 a) Common Setup Define common settings on this screen. Auto Power Off Define settings for the Auto Power Off function. ON: Enables the Auto Power Off function. OFF: Disables the Auto Power Off function. Buzzer Define settings for whether or not to activate the (Fig.
- Page 73 3D scan images Set the number of images to be scanned in 3D mode. 32: Captures 32 images. 64: Captures 64 images. d) 2D scan Setup Define settings for capturing 2D images in slit mode on this screen. 2D scan Images Set the number of images to be scanned in 2D mode.
-
Page 74: Temporary Setup (Temporary)
3.5.2 Temporary setup (Temporary) Set temporary conditions for capturing specific images. Touch the “Temp” button (1) on the touch panel to display temporary setting screens for each mode. (Fig. 1) a) Ring topo mode Selection of auxiliary functions Switch the setting between normal capture and the auxiliary function for calibration check. - Page 75 b) Slit mode Scan type setting 3D scan: Captures images of the anterior segment of the eye in 3D mode. 2D scan: Captures images of the anterior segment of the eye in 2D mode. Calibration: Calibration checks Verification Enhanced 2D scan Image level (Fig.
-
Page 76: Analysis
Analysis 3.6.1 Basic operation Click the “Mires & Slit OK” button (1) on the Exam (MERGED) screen (Fig. 1). Or, select the examination data (2) on the Examination List screen (Fig. 2) to display the Analysis screen (Fig. 3). (Fig. 2) (Fig. - Page 77 The 4Maps (Fig. 3) is shown immediately after the analysis screen appears. Click an analysis screen switch tab (3) or the View menu (4) to change the Analysis screen. ● Thumbnail ● Image ● Single Map ● 4Maps ● 6Maps ●...
- Page 78 a) Single Map (Fig. 1) (1) Patient information / Information on capture The patient’s ID, patient’s name, date of capture, and patient’s eye are shown. (2) Pupil (pupil information) The outline position and center of the pupil are shown. (3) Pupil offset Offset of the pupil center is shown.
- Page 79 (6) Map type The map type currently applied is shown. Click the blue description to display the map menu that allows you to change the map type. ● Axial Power [Keratometric] ● Axial Power [Posterior] ● Axial Power [Real] ● Refractive Power [Keratometric] ●...
- Page 80 of the analysis area and the distance between two optional points can be shown. Radius from center of analysis area When an optional point on the map is clicked, a line connecting the center of the analysis area and the selected point is shown.
- Page 81 b) 4Maps (Fig. 1) 4 types of maps can be displayed simultaneously on the multi-type map screen. The same basic functions of the Single Map are available. Click a map type (1) to change the map type c) 6Maps (Fig. 1) 6 types of maps can be displayed simultaneously on the multi-type map screen.The same basic functions of the Single Map are available.
- Page 82 d) Thumbnail (Fig. 1) Measured slit images are listed. In addition, an analyzed map and CCD image are also displayed as thumbnails. Double-clicking a thumbnail automatically jumps to “d) Image screen” and enlarges the selected thumbnail. Click a map type (1) to change the map type 3-32...
- Page 83 e) Image (Fig. 1) Measured slit images are listed. In addition, an analyzed map and CCD image are also displayed as thumbnails. Click a map type (1) to change the map type. f) Merged Calculation / Ring Calculation (10) (Fig. 1) The following information appears.
- Page 84 settings. In addition, the average diameter of each ring is shown in millimeters. ● ACCP The average AxialPower within an absolute diameter of 3 mm is displayed (2). Diopter or millimeter can be selected for the unit. Refer to the “Common settings” tab in “3.9 System Setup”...
- Page 85 g) Slit Calculation (14) (17) (11) (12) (13) (21) (20) (22) (18) (16) (10) (19) (15) (Fig. 1) Measured slit images are listed. In addition, the analyzed map and CCD image are also displayed as thumbnails. „ Values vary depending on the specified measurement point.
- Page 86 the image to display the following information. Specified items change to AR1, AR2, ACD-L in this order every time the measurement point is clicked. ● CCT (central corneal thickness) When two corners (AR1 (5) and AR2 (6)) visible on the image are clicked, a line perpendicular to the line connecting the two corners is automatically drawn from the mid-point and the distance between the intersections (7) on the perpendicular line with the...
- Page 87 ● Angle The specified angle is shown as the Angle value at the top of the slit image (8) after setting Angle1 (or Angle2). The unit is degrees (deg).Click a measurement point on the image with Angle1 selected in the item list (11).The point for Angle1 and 2 lines (20) drawn from that point appear.The end points of these 2 lines can be dragged and moved by the mouse.Both Angle1 and Angle2 can...
- Page 88 ● “Default” button Click the “Default” button (20) to change the current setting to the default (Grain = 1.0, Brightness = 0, and Contrast = 1.0). ● “Setting” button Click the “Setting 1” button or “Setting 2” button (21) to change the current value to the registered custom value.
- Page 89 h) Ectasia Screening „ When diagnosing ectasia in practice, check thinning of cornea, Fleischer ring, Vogt’s striae (Keratoconus line), etc. as per normal examination. „ Ectasia Screening is not applicable to the corneal transplanted eyes such as PKP, DALK, or DSAEK. Ectasia Screening is an application useful to detect ectasia pattern cases such as keratoconus and Pellucid marginal corneal degeneration.
- Page 90 (Fig. 2) (1) Screening results The screening result is displayed by color coding based on similarity: green when similarity is 0% - 4% (there is no pattern that seems to be Ectasia), yellow when 5% - 29% (there is a pattern that seems to be Ectasia), and red when 30% or higher (there is a pattern that may indicate Ectasia to some extent).
- Page 91 screening result obtained from the anterior data. ● AA@6mm: Percentage of the area (range) that could be analyzed within Φ6 mm on the anterior. If the value of AA@6mm is small and the reliability of the anterior data is low, “N/A” is shown for ESI in red. Lower right section (Posterior) ●...
- Page 92 (5) Pachymetry map ● Thinnest: The corneal thickness [μm] at the thinnest section and the position (X/Y coordinates) from the corneal vertex [mm] (6) Instantaneous Power [Posterior] map ● Steepest@6: The minimum value [mm] of Instantaneous Power [Posterior] within the range of Φ6 mm and the position [mm] (X/Y coordinates) from the corneal vertex i) IOL Screening...
- Page 93 (1) Axial Power [Keratometric] map Displays the Axial Power [Keratometric] map and astigmatism axis. (2) Axial Power [Posterior] map Displays the A xial Power [Poster ior] map and astigmatism axis. (3) Axial Power [Real] map Displays the Axial Power [Real] map and astigmatism axis.
- Page 94 (7) QS display area The results of reliability (Quality Statement) of corneal analysis are displayed. Click the button to switch the display of detailed data ON and OFF. In the case of “QS: NG," details are displayed automatically. <RING> <SLIT> Analyzed Area : Ratio of area of the mire ring Ratio of area of the slit image in the...
- Page 95 ● HOAs [4mm]: Displays the total higher-order aberrations within a Φ4-mm range. ● SA [6mm]: Displays any spherical aberration within a Φ6-mm range. Refer to “3.6.4 Quantitative index” for details of quantitative index. The following quantitative index will be the reference for IOL formulae and selection of IOL type.
-
Page 96: Analysis Type
3.6.2 Analysis type a) Shape map Axial Power The axial power map is a corneal curvature map that locates the curvature center on the optical axis. Paraxial calculation using the conversion refractive index is performed for conversion to refractive power. This map is a good reference for the refractive power and shape of the cornea. - Page 97 (Fig. 1) (Fig. 2) 3-47...
- Page 98 Refractive Power The refractive power on this map is the true refractive power, regarding the cornea as a lens. The true optical power is calculated not by paraxial calculation but by Snell's law. For example, when capturing an image of the spherical model eye, the refractive power of the surrounding area is larger than that of the center.
- Page 99 Instantaneous Power This is the local corneal curvature map of the corneal shape, and conversion to refractive power is performed by paraxial calculation using the conversion refractive index. Compared to the Axial Power map, changes in a specific point on the cornea can be reflected on the map more clearly.
- Page 100 (Fig. 2) The height of the cornea is shown in microns on the height map. The height is calculated by the personal c o m p u t e r, b a s e d o n t e c h n i q u e s u s i n g Z e r n i ke Polynomials.
- Page 101 Height [Anterior] The height of the cornea is shown in microns on the height map. The height is calculated by the personal c o m p u t e r, b a s e d o n t e c h n i q u e s u s i n g Z e r n i ke Polynomials.
- Page 102 [Anterior] This is the anterior elevation map. [Posterior] This is the posterior elevation map. The map is drawn in reference to the front corneal center. The reference sphere is automatically calculated by the least-squares method to fit the corneal shape, with the following settings.
- Page 103 (Fig. 2) Pachymetry Pachymetry is the corneal thickness in the direction perpendicular to the anterior of the cornea. This allows you to visually recognize a thin area of the cornea and provides useful information for refractive correction surgery.. (Fig. 1) (Fig.
- Page 104 ACD Map ACD is a distribution map that shows the depth when a line parallel to the sight axis is drawn from the endothelium surface of the cornea to the iris side of the crystalline lens. Values are listed in reference to the back side (Endothelium).
- Page 105 b) Fourier analysis map The Fourier analysis map performs Fourier analysis for refractive powers at individual measurement points obtained by analyzing Mire images within the f3 mm range (rings 1 to 9) and f6 mm range (rings 1 to 20), and visually and quantitatively displays the constant term, the first order term, the second order term, the higher order terms.
- Page 106 (4) Map type, scale/unit setting area The top bar is a color bar for the original map, and the second and lower color bars are for Fourier maps. The map type, scale, and unit can be selected independently for the original map. When the Fourier map type setting is changed, the original map type is automatically changed according to the Fourier map.
- Page 107 Klyce Corneal Statistics The “Klyce Corneal Statistics” application was developed by Stephen D. Klyce, Ph.D. of Louisiana State University especially for Tomey Corporation. (Fig. 1) The “Klyce Corneal Statistics” application shows the following information. ● Cornea image with green analysis points are plotted ●...
- Page 108 [Definition of index] ● SimK (Simulated Keratometry) SimK averages measurements at the 6th to 8th rings on each measurement meridian and identifies the meridian with the largest refractive power on the cornea. The average of the identified value and the meridian perpendicular to the identified meridian is shown similarly to the conventional keratometer.
- Page 109 and CL warpage. When the SAI value is large, glasses may not be sufficiently effective for correction. ● SRI (Surface Regularity Index) T h e S R I i s r e l ate d to t h e eye s i g ht . T h i s i s a measurement of the local fluctuation of the refractive power at the corneal center and influences the potential eyesight.
- Page 110 refractive powers measured on the cornea. When the distribution range of corneal refractive powers is large, the value becomes large. The CVP value may be large soon after corneal transplantation or in the case of severe keratoconus. ● ACP (Average Corneal Power) The ACP represents the average refractive power within the pupil diameter.
- Page 111 index). When the IAI value becomes large, sections with irregular astigmatism increase on the surface of the cornea. The IAI is high immediately after cornea transplantation. ● AA (Analyzed Area) The A A shows the area (range) analyzed by the device using percentages.
- Page 112 re-calculation is required. If the curvature at the corneal center is even, the EDP and EDD are essentially “0.” d) Keratoconus Screening „ When diagnosing keratoconus in practice, check thinning of cornea, Fleischer ring, Vogt's striae (Keratoconus line), etc. as per normal examination. The Keratoconus Screening System is an effective program for diagnosis and observation of keratoconus.
- Page 113 (Fig. 2) The Keratoconus Screening System application shows the following information. ● Cornea image with green measurement points plotted ● Corneal shape map ● The diagnosis index of keratoconus according to inspection results using the Smolek/Klyce method and Klyce/Maeda method are color-coded in green (normal), yellow (caution), and red (abnormal).
- Page 114 clinically-determined keratoconus patterns, and other patterns that in particular include the normal eye, astigmatism, Pellucid marginal corneal degeneration, CL warpage, PRK, Radial Keratotomy (RK), and penetrating keratoplasty. Reported sensitivity = 100% Particularity = 100% Accuracy = 100% (Ophthalmol. Vis. Sci., 1997, 38, 2290 - 2229) The Smolek/Klyce index shows the Keratoconus Severity Index (KSI).
- Page 115 ● SK2 The SK2 is the refractive power of the meridian at a place where a meridian of SK1 is rotated 90 degrees. ● CYL (Simulated Keratometric Cylinder) The CYL value of corneal astigmatism can be obtained from the SimK value (SK1 – SK2). When the CYL value is larger than the standard, diseases, external injuries, or surgeries may be the cause.
- Page 116 ● OSI (Opposite Sector Index) The OSI is the largest difference in the average refractive power between two opposing sections out of eight divisions of the cornea. The keratoconus eye shows a larger value. ● CSI (Center/Surround Index) The CSI is the difference between the average refractive power in an area within a diameter of 3.0 mm and that in the ring-shaped surrounding area of diameters from 3.0 mm to 6.0 mm in the analyzed...
- Page 117 ● AA (Analyzed Area) The A A shows the perc entage of the entire measurement points on an inspected eye that the TMS was able to analyze. The AA becomes small when Mire rings are not correctly projected or analyzed due to severe irregular astigmatism. In addition, the value becomes smaller than the normal value in the case of an eye after corneal transplantation, deteriorating keratoconus, and an...
-
Page 118: Map Scale
3.6.3 Map scale a) Scale of corneal curvature map The corneal cur vature map is displayed, using the following scales. ● Absolute: Absolute scale ● Normalized: Normalized scale ● Adjustable: Adjustable scale ● Klyce/Wilson: Klyce/Wilson scale ● Maguire/Waring: Maguire/Waring scale These scales show all cornel curvatures in colors ranging from blue (flat section on cornea) to red (gradient section). - Page 119 ● Absolute: Absolute scale (Fig. 2) The absolute scale uses the color coding developed by Stephan D. Klyce, Ph.D of Louisiana State University. Individual refractive powers are uniquely shown in corresponding colors in a range of 26 dioptries, so the absolute scale allows you to easily compare the data with other measurement results.
- Page 120 ● Normalized: Normalized scale (Fig. 3) The normalized scale divides the range between the maximum and minimum refractive powers of the patient’s eye currently displayed into 11 colors. This shows a more detailed refractive power distribution than the absolute scale. The normalized scale uses the 11 basic equal colors the absolute scale.
- Page 121 ● Adjustable: Adjustable scale (Fig. 4) The adjustable scale divides the range into 26 equal intervals, and the interval can be set by the user. This scale provides the characteristics of the normalized scale that shows detailed shapes, as well as that of the absolute scale that enables easy comparison.
- Page 122 ● Klyce/Wilson: Klyce/Wilson scale (Fig. 5) The Klyce/Wilson scale shows the range of 28.0 – 65.5 diopters in intervals of 1.5 diopters. ● Maguire/Waring: Maguire/Waring scale (Fig. 6) The Maguire/Waring scale shows the range of 32.0 – 57.0 diopters in intervals of 1.0 diopter. 3-72...
- Page 123 b) Scale of Posterior Map ● Abs. (mm) This scale shows a range of -3.0 – -10.5 diopters in -0.3 diopter intervals. ● Abs. (D) This scale shows a range of -11.0 – 1.5 diopters in 0.5 diopter intervals. c) Scale of Height Map ●...
- Page 124 e) Scale of pachymetry map Corneal thickness is shown in colors ranging from blue (thick section) to red (thin section). Absolute scale or convention scale can be selected, and each scale visually shows the distribution of the corneal thickness on the color map. ●...
- Page 125 ● Convention: Convention scale The convention scale uses a color-coding method similar to the scale generally used. The range from 340 μm to 840 μm is shown in intervals of 20 μm. (Fig. 2) f) Scale of ACD map ● 0.25 mm The scale on the “ACD Map”...
-
Page 126: Quantitative Index
3.6.4 Quantitative index a) Standard format (Fig. 1) Click the Single Map , 4 Maps, or 6 Maps tab to show the quantitative index of the corresponding corneal shape. [Keratometric] [Posterior] [Real] The index is calculated based on the axial power data. ●... - Page 127 [RING TOPO Viewer] ● Ks/Kf/MinK/AveK ● Es/Em ● CYL/SRI/PVA/SAI 3-77...
- Page 128 b) Application formatp Fourier Map The index is calculated by conducting Fourier analysis for the axial power data. (Fig. 1) ● Spherical (Spherical eq.): Spherical component of corneal refractive power Equivalent to the constant term in Fourier analysis: Unit [D] ●...
- Page 129 ● Asymmetry axis: A xis angle of asymmetr y component of corneal refractive power. Unit [°] ● Higher order (Higher order irregularity): Higher order irregular astigmatism component of corneal refractive power Calculated by forming a composite of the third and higher order terms in Fourier analysis: Unit [D] 3-79...
-
Page 130: Optional Function Of Map
3.6.5 Optional function of map Right-click an optional point on the map image to open the Map Options Menu. The Map Options Menu allows you to set how to display the map. a) Map format Sets the display method for captured images of the cornea. - Page 131 - Numeric (0, 3, 5, 7) - Numeric (0, 3, 6, 9) - Numeric (0, 4, 6, 8) - Numeric (0, 2, 4, 6, 8, 10) Numeric values are displayed at each specified diameter position.For “Numeric (0, 3, 5, 7),” numeric data will be displayed at diameter positions f0 (center), f3, f5, and f7.
- Page 132 b) Video format Sets the display method for captured images of the cornea. Click “Video Format” (1) in the Map Options Menu and select an option from the list. - Video OFF - Video Alone - Verify Mires - Background ●...
- Page 133 ● Verify Mires Displays a Mire plot that indicates Mire rings detected by ring-scanning using green dots. (Fig. 4) ● Background Displays a map over the captured image. (Fig. 5) 3-83...
- Page 134 c) Grid Option Displays the scale on the map. Click “Grid Option” (1) in the Map Options Menu and select an option from the list. - Off - Axis - Rectangular - Polar - Fourier 3/6 ● Off (Fig. 1) Scale is not displayed.
- Page 135 ● Pola Shows circles of 3-, 5-, 7-, 9-, 11-, and 13-mm diameter. (Fig. 4) ● Fourier 3/6 Shows circles of φ3 mm and φ6 mm that are analysis ranges of Fourier index. (Fig. 5) 3-85...
- Page 136 d) Astigmatism axis options Sets the display for the astigmatism axis. Click “Astigmatism” (1) in the Map Options Menu and select an option from the list. ● Off (Fig. 1) Astigmatism axes are not displayed.. ● Orthogonal Displays SimK values on a major meridian (red) and a minor meridian (blue).
- Page 137 ● Instantaneous Displays the steep axis and flat axis in more detail than Orthogonal. This clearly shows that the astigmatism axes do not necessarily intersect radially or at right angles. It will not be displayed if astigmatism is less than 0.5 D. (Fig.
- Page 138 e) Other displays The following check boxes are available in the Map Options Menu. - Pupil - Offset - Invert Map - Statistics - Name Off (Fig. 1) ● Pupil Check the “Pupil” check box (1) to set whether to display or hide the pupil outline and calculated center.
- Page 139 ● Offset Check the “Offsets” check box (2) to set whether to display or hide the alignment offset. The offset (8) is displayed/hidden in the lower right of the map. (Fig. 3) ● Invert Mapt Check the “Invert Map” check box (3) to set whether to turn the map upside down.
- Page 140 ● Statistics Check the “Statistics” check box (4) to set whether to display or hide the index value. The index value (11) is displayed/hidden. (11) (Fig. 5) ● Name Off Check the “Name Off” check box (5) to set whether to display or hide the patient name and ID.
-
Page 141: Other Map Display Modes And Applications
3.6.6 Other map display modes and applications There are more map display modes and application functions in addition to those on the Analysis screen (Fig. (Fig. 1) (1) “Dual Map” button The Dual Map window (Fig. 2) appears when the “Dual Map”... - Page 142 (3) “Map Preview” button The Map Review window appears when the “Map Review” button is clicked.Operations on this window are the same as for the “Dual Map” button (1).Click the “OK” button. The Map Review screen appears.. (4) “Differential Map” button The Dif ferential Map window appears when the “Differential Map”...
- Page 143 a) Dual Map Dual Map displays two maps side by side on the same screen. The scale is common to both maps, but the measurement data and display options are shown for each map separately. (Fig. 1) Click the map type (1), scale name (2), and unit (3) displayed in light blue to change properties.
- Page 144 c) Map Review Up to six “Axial Power (Keratometric)” maps at absolute scale can be displayed at the same time on the Map Review screen. (Fig. 1) d) Differential Map The difference between two maps is displayed on the Differential Map screen. (10) (Fig.
- Page 145 The difference between two maps is displayed on the Differential Map screen. Two maps to be compared are displayed in A (1) and B (2). Select the map type (3) to change the type of map to be displayed. Click the scale (4) and unit (5) to change properties of maps A and B.
- Page 146 measurement points compared on the two maps. A value with a light blue “4” indicates that the “Mean difference” within a diameter of 4 mm is displayed. “4” changes to “F” when clicked and the “Mean difference” for the entire map appears. “Mean difference”...
-
Page 147: Output Of Results
Output of results 3.7.1 Printing The analysis screen can be printed from an external printer connected to the personal computer. a) Printing on Examination List screen Click the custom print button (1) on the Examination List screen (Fig. 1) to display the Custom Print screen (Fig. 2).The custom print function allows you to print the two preset analysis screens on one sheet of paper. -
Page 148: Saving Files
b) Printing on analysis screenn Click the print button (1) on each analysis screen to print (2) (1) (3) the screen currently displayed. The Custom Print screen (Fig. 2) appears when the custom print button (3) is clicked. The basic operation is the same as for the custom print button described in “(a) Printing on Examination List screen”... -
Page 149: Utilities
Utilities 3.8.1 Handling of patient ID a) Searching for patient A patient can be searched for by ID or name. 1) Enter the patient ID or patient name and click the “Search” button (1). Patient names that include the entered characters are listed. 2) Select the desired patient from the list to display the measurement data of the selected patient. - Page 150 The patient can also be searched for by information other than ID and name. 1) Click “More” (2) on the Patient field to open the Search Option screen (Fig. 2). (Fig. 2) 2) Enter parameters for the patient information (3), examination date (4), and examination type (5), and search for the corresponding patient ID.
- Page 151 Available setting items are as follows. ● DOB (Date Of Birth) Specify the date of birth or current age range. Specify either, and the other is automatically calculated and displayed.(The date of birth can be entered from the keyboard or by clicking the calendar.) ●...
- Page 152 b) Registering or modifying patient data „ When entering the patient ID to register the patient information, carefully check that the data entered is correct. If there is a mistake in the data entered, the wrong patient data may used later. A new patient can be registered on the Examination List screen.
- Page 153 c) Deleting patient data „ Carefully check the data before deleting it. The patient ID and all examination data saved will be deleted. 1) Select the patient ID to be deleted, right-click on the ID, and select “Delete” from the menu. (Fig.
-
Page 154: Data Tables
3.8.2 Data Tables T h e D a t a Ta b l e s p r o g r a m c o n v e r t s a n d s a v e s measurements to a data file. 1) Select “Data Tables”... - Page 155 The data table file type and index file output can be selected on the output data selection screen (Fig. 3).All items with boxes checked on the output data selection screen (Fig. 3) are output. The data table consists of the data at intersections between a straight line from the map center (corneal vertex) to the map edge and 25 rings, and 256 data sets obtained by dividing the circumference of the map into 256 sections (25...
- Page 156 The following requirements apply to each item. Merged : Merged data Ring : Ring data ANTE : Cornea anterior data : Cornea posterior data REAL : Cornea anterior/posterior data Data for each item is at the radius (or ring) position.For example, a graph showing changes in values from the center to the periphery at a specific angle can be created by assigning a radius to the X axis and object data to...
- Page 157 The structure of the file name is “common setting + unit- specific setting.csv.” The common setting can be changed here. (10) (11) (Fig. 6) 11) Click the selection box (▼ button) at the top of the component name selection menu (8) to open the pull- down menu.
- Page 158 12) Select the second, third, and following components in the file name as desired. 13) If punctuation is to be inserted between the selected components in the file name, click the selection box (▼ button) of the punctuation selection menu (9) and select the desired punctuation from the pull-down menu.
-
Page 159: Exporting/Deleting Examination Data
3.8.3 Exporting/deleting examination data „ In order to prevent data loss due to hardware failure, it is recommended to backup data to external media on a regular basis. The Export/Deletion program is used for managing files saved on the database. Files can be moved from the default directory to another directory on the hard disk or external media. - Page 160 3) Register the examination data or cancel registration of the examination data for which the Export/Delete program is to be executed in the bucket as follows. ● Drag and drop the examination data. Select the examination data, and drag and drop it onto the bucket.
- Page 161 7) When the “Delete” button (8) is clicked, a confirmation screen appears.(Fig. 4) 8) Click the “OK” button (10) to delete the data. The deleted data is removed from the database and (10) (Fig. 4) moved to “C:\TOMEY_FILE_STORE_TOP\Recycled” folder. Reference: Simply exporting/deleting examination data without using bucket When only one examination data needs to be exported or deleted, a simple operation is available without using...
-
Page 162: Importing Examination Data
3.8.4 Importing examination data The Import program adds measurement data not linked to the database of this software to the patient list and examination data list. 1) Click the “Utility” menu on the menu bar and select “Import” and “Import Exam” (1) to select and import only one examination data.(Fig. - Page 163 4) The Import Patient Data screen (Fig. 5) appears. 5) Click the “OK” button (6) to start importing all patients displayed in the list and the examination data selected on the selection screen (Fig. 3) (or all examination data in the folder). (Fig.
- Page 164 ● “Patient ID” and other items are gray Patients already registered on the database ● Only “Patient ID” is yellow Patients not yet registered. Import the data as new patient. ● “Patient ID” and other items are yellow Inconsistent items are displayed in yellow if the patient information other than the ID (patient name, etc.) is different although the patient ID is already registered on the database.
-
Page 165: Export Patient List
3.8.5 Export patient list The patient list is a list of all patients displayed on the Examination List screen. 1) Click “File” (1) in the menu bar and select “Patient List.” (Fig. 1) 2) Select the directory for saving the list. (Fig. -
Page 166: Tms Data Import
3.8.6 TMS Data Import The old TMS data (.tms file) can be saved in the database. 1) Select “TMS Data Import” from the Utility menu (1) in the menu bar. (Fig. 1) 2) The Tms Data Import screen (Fig. 2) appears. (Fig. -
Page 167: System Setup
System Setup The System Setup function allows you to set the clinic information and map display methods. Click the “Save” button to save changes to settings. Click the “Cancel” button to clear all changes to settings. Click the “Default” button to return settings to the defaults. Setting items are divided into the following tabs according to the setting properties. - Page 168 ● Unit Select the standard unit for displayed data: D (diopter) or mm (millimeter). ● Correction Mires No data is displayed on the RING map if mires cannot be detected on the cornea. However, when this option is set to ON, the instrument places corrected mires as blue dots in the area not shown on the map.
- Page 169 Select the display settings applied to the following maps. Single Map(Marged) Single Map(Ring) 4Maps 6Maps Fourier Map Image ● Map Format Select how to display the map: TopoGraphic, Numeric (0, 3, 5, 7), Numeric (0, 3, 6, 9), Numeric (0, 4, 6, 8) or Numeric (0, 2, 4, 6…).
- Page 170 ● Scale Select the standard map scale. Scales added by “Custom Scale” are listed in “Custom” for selection. ● Power [Keratometric] Absolute, Normalized, Adjustable, Klyce/Wilson, Maguire/Waring ● Power [Posterior] Abs.(mm), Abs.(D) ● Power [Real] Absolute, Normalized, Klyce/ Wilson, Maguire/ Waring ●...
- Page 171 3) Enter values to be set in the Start and Step fields (values can also be set by clicking the up/down arrow buttons). 4) Click the pull-down button in the “Color” field to select the Color style.“TMS Style” or “ANSI Style” can be selected.
- Page 172 ● Color Tone Correction Set the custom values for color tone correction on the Slit Calculation screen.Numeric values can be set for [Setting 1] and [Setting 2].Select the setting to be used immediately after the analysis screen opens in [Initial].Default, Setting 1, or Setting 2 can be selected.Click the “Clear”...
- Page 173 Set the threshold of the coloring of the following quantitative index of IOL Screening screen.Single ● AvgK: AvgK / Real AvgK threshold settings Threshold1: Sets the lower threshold of AvgK value. When the AvgK value is less than the set value, it is displayed in red.
-
Page 174: Analyzing In Ring Topo Mode Only
3.10 Analyzing in ring topo mode only 1) Press the “PreMap” button (1) on the Capture screen after capturing images in ring topo mode to display the PreMap screen (Fig. 3) and view all captured images of the inspected eye. (Fig. - Page 175 4) Click the “Mires OK” button (2) if the center of the Mire rings (plotted green dot) is aligned with the center of the ring on the captured image (this means that focusing is aligned correctly) and each ring is aligned with the green plot.
-
Page 176: Closing The System
3.11 Closing the system „ TTo restart the system, turn the power off, wait for about ten seconds, and turn it on again. 1) Hold down the PACKING button (1) on the membrane button panel of the main unit for 3 seconds to return the measuring head to the lower dead center. -
Page 177: Okulix
3.12 OKULIX 3.12.1 Precautions when using OKULIX „ OKULIX is software that calculates IOL power using the ray tracing method. OKULIX was developed and is manufactured by Professor Preussner. We sell this software as an import agent. However, please understand the calculation result obtained by OKULIX is still under evaluation and be extremely careful when using it. -
Page 178: Data Output To Okulix
The axial length data is also required for calculation by OKULIX in addition to the TMS data. TMS-5 is designed to impor t the axial length data measured by the OA-1000 via connection of USB- communication. - Page 179 „ Refer to the OA-1000 Instruction Manual for details of how to send and measure the axial length data using the OA-1000. When the axial length data is sent from the OA-1000 via USB communication, the axial length data is displayed in the information related to OKULIX.
- Page 180 When calculating IOL power using OKULIX by clicking the “Start OKULIX” button (1), the data for OKULIX (data that integrates the TMS data and OA-1000 axial length data used for calculating IOL power) is automatically saved in the database (Fig. 5). (Fig.
-
Page 181: Technical Information
4. TECHNICAL INFORMATION Corneal refractive index used to calculate refractive power distribution Although the corneal refractive index is originally n = 1.376, this instrument uses a corneal conversion refractive index of n = 1.3375, which is used in many corneal topography and keratometers. -
Page 182: Refractive Power Correction By Analysis Of Capturing In Slit Mode
Refractive power correction by analysis of capturing in slit mode Images captured in slit mode are affected by distortion due to the optical system for capturing and optical characteristics of the inspected eye. This influence needs to be considered during analysis in order to calculate the dimensions of the anterior chamber. -
Page 183: Direction Of External Light Interference That Affects Capturing In Slit Mode
Direction of external light interference that affects capturing in slit mode One of the features of this instrument is to allow you to capture images in slit mode, even when not in a darkroom; however, unnecessary light may enter the captured image depending on the positions of the instrument and any strong light from a fluorescent lamp, other lamps, or windows. -
Page 184: Fourier Analysis
Fourier analysis The Fourier analysis expresses a specific cyclic pattern using the sum of multiple trigonometric functions. The cyclic pattern in TMS is the distribution of the corneal refractive powers of each Mire image. Order components obtained when developing this pattern in the sum of trigonometric functions can be separated and quantified as the spherical component of the cornea, asymmetry component, regular astigmatism component, and higher... - Page 185 ● Spherical equ. The constant term (spherical component) in Fourier analysis. The constant term (base line) represents the average corneal refractive power over 360°, namely the spherical degree. ● Regular Astigmatism T h e s e c o n d o r d e r t e r m (r e g u l a r a s t i g m a t i s m component) in Fourier analysis.
- Page 186 This page is intentionally blank...
-
Page 187: Inspection And Maintenance
This warranty also shall NOT apply if the product has not been installed, operated or maintained in accordance with the INSTRUCTION MANUAL of Tomey Corporation (here in after called “Tomey” ). Neither seller nor Tomey shall be liable for any damages caused by purchaser's failure to follow instruction for proper installation, use and maintenance of product. -
Page 188: Operation Life
Inspection „ When there is a problem, measurement may not be performed correctly. Contact Tomey or our local distributor immediately for repair. „ When measuring the model eyes, check that there is no dust or stain on them. -
Page 189: Calibration Verification (Ring Topo Mode)
Verified: OK” appears. If the error message “Calibration Verified: No Good” appears, check that the model eye is not dirty or damaged, and capture an image again. (Fig. 2) If the error message “No Good” still appears, contact Tomey Corporation or our local distributor. (Fig. 3) -
Page 190: Calibration Verification (Slit Mode)
Verified: OK” appears. If the error message “Calibration Verified: No Good” appears, check that the model eye is not dirty or damaged, and capture an image again. If the error message “No Good” still appears, contact (Fig. 2) Tomey Corporation or our local distributor. -
Page 191: Routine Maintenance
Routine maintenance „ Hold the plug when disconnecting the power cord from the outlet to avoid applying excessive force on the cord. Pulling the cord may damage the inner core wires, resulting in electric shock or fire. „ Do not use organic solvents such as thinner, benzene, or acetone to clean the instrument and accessories. -
Page 192: Replacing Consumables
Replacing consumables 5.5.1 Fuses „ Disconnect the power cord from the outlet when replacing fuses. Otherwise, you may get an electric shock, resulting in death or serious injuries. „ Use the fuse (250 VAC, T2.5AL) specified on the label on the side of the fuse holder. Always replace two fuses together. -
Page 193: Storing
Storing „ Store the instrument in a location free of water or chemicals. Any water or chemicals entering the instrument may cause an electric shock or failure. „ Do not store the instrument in a location where chemicals are stored or gases may occur. Spilt chemicals or vapor may enter the instrument and result in fire. -
Page 194: Disposal
Disposal „ Keep the box and packing materials for use when moving or transporting the instrument. „ Keep the packing materials and the box together. „ When disposing of the packing materials, sort them by type and dispose of them as directed by relevant laws and local rules and regulations. -
Page 195: Troubleshooting
6. TROUBLESHOOTING Check the following first when you find any problem with the instrument. If the problem is not solved even after checking the applicable item listed below, contact our local distributor to request inspection and/or repair. „ Do not remove the cover of the instrument. Otherwise, you may be directly exposed to high voltage sections. - Page 196 Blown fuse Check that fuses are not blown. If blown, replace the fuse (refer to “5.5.1 Fuses”). If the new fuse is blown again, the instrument may be faulty. Contact our local distributor to request inspection and/or repair. ● The ring cone lamp or fixation lamp does not light in ring topo mode.
- Page 197 ● The measurement data of the model eye is not correct. The surface of the model eye is dirty. Check that the surface of the model eye is clean. If dirty, clean the surface using an applicable cleanser and per form measurement again.
-
Page 198: Actions For Error Messages
Actions for error messages 6.2.1 Message on the main unit Message Not ready to measure Contents This message appears when attempting to start measurement although communication between the main unit and personal computer is not ready. Solution (1) Check that the software in the personal computer is ready. (2) Check that the USB cable connecting the main unit and personal computer is not disconnected. - Page 199 Message Slit Camera Error Contents The camera that captures cross sections for slit mode is not operating. Solution Turn off the main unit, then turn it on again and check the condition. This error may be solved by turning power off and then on again. If the same message appears again, the instrument may be faulty.
-
Page 200: Message On The Personal Computer
Message TMS-5 cannot be prepared. PC cannot be operated Contents This message appears when the measurement part of TMS-5 is processing and it is not possible to operate it. Solution Please follow the instruction displayed in the monitor of the device. -
Page 201: Consumables
7. CONSUMABLES The following consumable parts are available from our local distributor. Contact our local distributor to order them. ● Chin rest paper (100 sheets/set) ● Fuse (2) (250 VAC, T2.5 AL) Specify the part type as “TMS-5 fuse.”... - Page 202 This page is intentionally blank...
-
Page 203: Specifications
8. SPECIFICATIONS 8.1 Specifications 8.1.1 Main unit Ring topographer ●Measurement type Light cone ●Measurement time 0.5 sec. / image (4 images maximum / each eye) ●Ring numbers 25 or 31 ●Measurement range [mm] 5.5 - 10.0 (Spherical) ●Measurement accuracy [mm] ±0.02 (Spherical) ●Minimum / Maximum ring diameter [mm] φ0.35 - 10.7 (25 rings) φ0.45 - 11.7 (31 rings) ●Minimum / Maximum ring diameter (43D) [mm] φ0.46 - 8.8 (25 rings) φ0.57 - 10.9 (31 rings) ●Measurement points 6,400 maximum (25 rings) 7,300 maximum (31 rings) ●Measurement points on a ring ●Alignment Manual with auto-correction ●Image capturing Auto / Manual Slit scan image (Scheimpflug) ●Measurement type Scheimpflug ●Scan speed 64 flames / 1.0 sec. 32 flames / 0.5 sec. ●Observation width [mm] 13.6 mm ●Capture points 40,960 maximum (640 points × 64 flames) ●Image capturing... -
Page 204: Required Specification Of The Personal Computer
8.1.2 Required specification of the personal computer ● OS WindowsWindows® XP Professional WindowsWindows® 7 Professional WindowsWindows® 10 Professional ● CPU Intel® Core2 Duo processor or higher ● Memory 4G Bytes ● Video Resolution: 1024x768 or higher 8.1.3 Required specification of the isolation transformer ● Power Supply Voltage 100 VAC ● Frequency 50/60 Hz ● Output 500 VA... -
Page 205: Noise
8.2 Noise The instrument generates machine noise when: ■ Turning power on ■ Changing capture mode ■ Moving the chin rest ■ Capturing 8.3 Operating environment Operate the instrument under the following environmental conditions. ■ Installation: Indoors, not in direct sunlight ■ Temperature: +10 – +40°C ■ Humidity: 30 – 75% ■ Atmospheric pressure: 700 - 1060 hPa ■ Power fluctuation: Less than ±10% of nominal voltage Store and transport this instrument in the instrument's box under the following environmental conditions. ■ Temperature: -20 – +60°C ■ Humidity: 10 – 95% ■ Atmospheric pressure: 700 - 1060 hPa 8.4 Classification Protection against electrical shock : Class I ME equipment Applied parts : B applied parts (Forehead pad, Chin rest) IP Code : IP20 (Main unit) IP10 (Capture window) Mode of Operation : Continuous operation... -
Page 206: Declaration Of Conformity To Emc
Caution: Portable or mobile RF communication equipment may effect medical equipment. Guidance and manufacturer’s declaration - electromagnetic emissions The TMS-5 is intended for use in the electromagnetic environment specified below. The customer or the user of the TMS-5 should assure that it is used in such an environment. Emission test Compliance Electromagnetic environment - guidance RF emission Group 1 The TMS-5 uses RF energy only for its internal CISPR 11 function. Therefore, its RF emissions are very low and are not likely to cause any interference in nearby electronic equipment. RF emission Class B The TMS-5 is suitable for use in all establishments, CISPR 11 including domestic establishments and those... - Page 207 Guidance and manufacturer's declaration - electromagnetic immunity Table 202 The TMS-5 is intended for use in the electromagnetic environment specified below. The customer or the user of the TMS-5 should assure that it is used in such an environment. Immunity test IEC 60601 test Compliance level Electromagnetic environment - level guidance Electrostatic ±6 kV contact ±6 kV contact Floors should be wood, concrete discharge (ESD) ±8 kV air ±8 kV air or ceramic tile. If f loors are IEC 61000-4-2 covered with synthetic material, the relative humidity should be at least 30%. Electrical fast ±2 kV for power ±2 kV for power...
- Page 208 Guidance and manufacturer's declaration - electromagnetic immunity Table 204 The TMS-5 is intended for use in the electromagnetic environment specified below. The customer or the user of the TMS-5 should assure that it is used in such an environment. Immunity test IEC 60601 test Compliance Electromagnetic environment - guidance level level Por table and mobile RF communication equipment should be used no closer to any part of the TMS-5, including cables, than the recommended separation distance calculated from the equation applicable to the frequency of the transmitter. Recommended separation distance d = 1.2 d = 1.2 80 MHz to 800 MHz 3 V rms Conducted RF 150 kHz to d = 2.3 800 MHz to 2.5 GHz 3 V rms IEC 61000-4-6...
- Page 209 Recommended separation distance between portable and mobile RF communication equipment and TMS-5 Table The TMS-5 is intended for use in an electromagnetic environment in which radiated RF disturbances are controlled. The customer or the user of the TMS-5 can help prevent electromagnetic interference by maintaining a minimum distance between portable and mobile RF communications equipment (transmitters) and the TMS-5 as recommended below, according to the maximum output power of the communications equipment.
-
Page 210: Classification By Iso15004-2 Group 2 Instrument
8.6 Classification by ISO15004-2 Group 2 instrument In retina photochemical hazard, because the slit light (LED of λc=505nm) for the front eye section taking a picture is group 2, the spectrum characteristic is described. CAUTIONARY STATEMENT: “CAUTION – The light emitted from this instrument is potentially hazardous. The greater the number of pulses, the greater the risk of ocular damage. Exposure to light from this instrument when operated at maximum intensity will exceed the safety guideline after 32 image acquisition continuousness 800 times.” - In a usual measurement, the guideline value of group 2 is not exceeded. (Fig.1) Spectrum characteristic of slit light for front eye section taking a picture... -
Page 211: Index
9. INDEX 2D scan ............ 3-18 Default AS (default Auto Shot)....3-22 2D scan Image .........3-23 DSI ............3-65 3D scan ............ 3-16 3D scan images ........3-23 EDD ............3-61 EDP ............3-61 AA (Alignment Assist) ........ 1-7 Elevation [Anterior] ......3-29, 3-51 AA (Analyzed Area) ...... - Page 212 MERGED TOPO viewe ......2-25 MinK ............3-58 Temporary setup ........3-24 Mires ring image .........1-8 Thumbnail ..... 2-23, 2-25, 3-27, 3-32 MS .............. 1-7 Touch panel ..........1-10 Multiple Map ......2-23, 2-25, 3-31 Image ..........2-23, 2-25 Normalized scale ...1-9, 3-68, 3-70, 3-76, 3-78 Verification ..........3-24 OKULIX ............
- Page 213 • Microsoft, Windows are registered trademarks of Microsoft Corporation in the United States and other countries. • A proper name of Windows is Microsoft Windows Operating System. • Intel, Pentium are registered trademarks of Intel Corporation in the United States and other countries. •...
- Page 215 Fax: +81 52-561-4735 EC-Representative Tomey GmbH Am Weichselgarten 19a 91058 Erlangen GERMANY Tel: +49 9131-77710 Fax: +49 9131-777120 AUTHORIZED TOMEY SERVICE CENTERS Headquarters, Pacific Rim Tomey Corporation 2-11-33 Noritakeshinmachi Nishi-ku, Nagoya 451-0051 JAPAN Tel: +81 52-581-5327 Fax: +81 52-561-4735 Europe...
Need help?
Do you have a question about the TMS-5 and is the answer not in the manual?
Questions and answers