
Related Manuals for Rohde & Schwarz FSW Series


Summary of Contents for Rohde & Schwarz FSW Series
- Page 1 ® R&S Signal and Spectrum Analyzer Getting Started (=VY22) 1338410202 Version 08...
- Page 2 ® This manual applies to the following R&S FSW models with firmware version 4.70 and later: ● R&S ® FSW8 (1331.5003K08 / 1312.8000K08) ● R&S ® FSW13 (1331.5003K13 / 1312.8000K13) ● R&S ® FSW26 (1331.5003K26 / 1312.8000K26) ● R&S ® FSW43 (1331.5003K43 / 1312.8000K43) ●...
-
Page 3: Table Of Contents
® Contents R&S Contents 1 Safety and Regulatory Information........7 1.1 Safety Instructions................7 1.2 Warning Messages in the Documentation........10 1.3 Korea Certification Class B..............11 2 Documentation Overview............12 2.1 Getting Started Manual...............12 2.2 User Manuals and Help..............12 2.3 Service Manual..................13 2.4 Instrument Security Procedures............ - Page 4 ® Contents R&S 4.10 Windows Operating System...............25 4.11 Logging On..................27 4.12 Checking the Supplied Options............30 4.13 Performing a Self-Alignment............. 30 4.14 Considerations for Test Setup............31 4.15 Protecting Data Using the Secure User Mode........32 5 Instrument Tour..............35 5.1 Front Panel View................. 35 5.2 Rear Panel View..................
- Page 5 ® Contents R&S 7.6 Displaying Results................108 7.7 Getting Help..................116 8 Contacting Customer Support..........118 Index..................119 Getting Started 1338.4102.02 ─ 08...
- Page 6 ® Contents R&S Getting Started 1338.4102.02 ─ 08...
-
Page 7: Safety And Regulatory Information
® Safety and Regulatory Information R&S Safety Instructions Safety and Regulatory Information The product documentation helps you use the product safely and efficiently. Fol- low the instructions provided here and in the Chapter 1.1, "Safety Instructions", on page 7. Intended use The product is intended for the development, production and verification of elec- tronic components and devices in industrial, administrative, and laboratory envi- ronments. - Page 8 ® Safety and Regulatory Information R&S Safety Instructions If any part of the product is damaged or broken, stop using the product. Never open the casing of the product. Only service personnel authorized by Rohde & Schwarz are allowed to repair the product. Contact Rohde & Schwarz customer service at http://www.customersupport.rohde-schwarz.com.
- Page 9 ® Safety and Regulatory Information R&S Safety Instructions If you mount products in a rack, ensure that the rack has sufficient load capacity and stability. Observe the specifications of the rack manufacturer. Always install the products from the bottom shelf to the top shelf so that the rack stands securely.
-
Page 10: Warning Messages In The Documentation
® Safety and Regulatory Information R&S Warning Messages in the Documentation Cleaning the product Use a dry, lint-free cloth to clean the product. When cleaning, keep in mind that the casing is not waterproof. Do not use liquid cleaning agents. Meaning of safety labels Safety labels on the product warn against potential hazards. -
Page 11: Korea Certification Class B
® Safety and Regulatory Information R&S Korea Certification Class B CAUTION Potentially hazardous situation Could result in minor or moderate injury if not avoided. NOTICE Potential risks of damage Could result in damage to the supported product or to other property. Korea Certification Class B 이... -
Page 12: Documentation Overview
® Documentation Overview R&S User Manuals and Help Documentation Overview This section provides an overview of the R&S FSW user documentation. Unless specified otherwise, you find the documents on the R&S FSW product page at: www.rohde-schwarz.com/manual/FSW Getting Started Manual Introduces the R&S FSW and describes how to set up and start working with the product. -
Page 13: Service Manual
® Documentation Overview R&S Data Sheets and Brochures All user manuals are also available for download or for immediate display on the Internet. Service Manual Describes the performance test for checking the rated specifications, module replacement and repair, firmware update, troubleshooting and fault elimination, and contains mechanical drawings and spare part lists. -
Page 14: Release Notes And Open-Source Acknowledgment (Osa)
® Documentation Overview R&S Application Notes, Application Cards, White Papers, etc. Release Notes and Open-Source Acknowledg- ment (OSA) The release notes list new features, improvements and known issues of the cur- rent firmware version, and describe the firmware installation. The open-source acknowledgment document provides verbatim license texts of the used open source software. -
Page 15: Key Features
® Key Features R&S Key Features The R&S FSW Signal and Spectrum Analyzer sets standards in RF performance and usability. The R&S FSW provides the following outstanding key features: ● Unmatched phase noise ● Excellent dynamic range ● Up to 8.3 GHz analysis bandwidth ●... -
Page 16: Preparing For Use
® Preparing for Use R&S Unpacking and Checking Preparing for Use This chapter describes the basic steps to be taken when setting up the product for the first time. ● Lifting and Carrying..................16 ● Unpacking and Checking................16 ● Choosing the Operating Site................ -
Page 17: Choosing The Operating Site
® Preparing for Use R&S Setting Up the Product 4. Check the equipment for damage. If the delivery is incomplete or equipment is damaged, contact Rohde & Schwarz. Choosing the Operating Site Specific operating conditions ensure accurate measurements and avoid damage to the product and connected devices. - Page 18 ® Preparing for Use R&S Setting Up the Product 4.4.1 Placing the Product on a Bench Top To place the product on a bench top 1. Place the product on a stable, flat and level surface. Ensure that the surface can support the weight of the product.
-
Page 19: Connecting The Ac Power
® Preparing for Use R&S Connecting the AC Power Design and implement an efficient ventilation concept for the rack. To mount the R&S FSW in a rack 1. Use an adapter kit to prepare the R&S FSW for rack mounting. a) Order the rack adapter kit designed for the R&S FSW. -
Page 20: Switching The Instrument On And Off
® Preparing for Use R&S Switching the Instrument On and Off To connect the AC power 1. Plug the AC power cable into the AC power connector on the rear panel of the instrument. Only use the AC power cable delivered with the R&S FSW. 2. -
Page 21: Connecting To Lan
® Preparing for Use R&S Connecting to LAN The R&S FSW boots. After booting, the instrument is ready for operation. Warm-up time for OCXO When the instrument is switched on, the OCXO requires an extended warm- up time (see data sheet). To shut down the product The product is in the ready state. -
Page 22: Connecting A Keyboard
® Preparing for Use R&S Connecting a Keyboard Provided the network administrator has assigned you the appropriate rights and adapted the Windows firewall configuration, you can use the interface, for exam- ple: ● To transfer data between a controlling device and the test device, e.g. to run a remote control program ●... -
Page 23: Connecting An External Monitor
® Preparing for Use R&S Connecting an External Monitor However, you can also connect foreign language keyboards; currently the follow- ing languages are supported for the R&S FSW: ● German ● Swiss ● French ● Russian To configure the keyboard language 1. - Page 24 ® Preparing for Use R&S Connecting an External Monitor Screen resolution and format The touchscreen of the R&S FSW is calibrated for a 16:10 format. If you connect a monitor or projector using a different format (e.g. 4:3), the calibra- tion is not correct and the screen does not react to your touch actions prop- erly.
-
Page 25: Windows Operating System
® Preparing for Use R&S Windows Operating System 5. Select the instrument for display: ● "Display 1" : internal monitor only ● "Display 2" : external monitor only ● "Duplicate" : both internal and external monitor 6. Tap "Apply" to try out the settings before they are accepted permanently, then you can easily return to the previous settings, if necessary. - Page 26 ® Preparing for Use R&S Windows Operating System Tested software The drivers and programs used on the instrument under Windows 10 are adapted to the instrument. Only install update software released by Rohde & Schwarz to modify existing instrument software. You can install additional software on the instrument;...
-
Page 27: Logging On
® Preparing for Use R&S Logging On For details and recommendations, see the following Rohde & Schwarz white paper: ● 1EF96: Malware Protection Windows 10 To access the "Start" menu The Windows "Start" menu provides access to the Windows 10 functionality and installed programs. - Page 28 ® Preparing for Use R&S Logging On Some administrative tasks require administrator rights (e.g. the configuration of a LAN network). Refer to the description of the basic instrument Setup ([Setup] menu) to find out which functions are affected. Secure user mode If the secure user mode option (R&S FSW-K33) is installed, an additional account is provided: the "SecureUser".
- Page 29 ® Preparing for Use R&S Logging On Adapting the auto-login function to a new password If you change the password that is used during auto-login, this function no longer works. Adapt the settings for the auto-login function first. 1. Open the C:\R_S\INSTR\USER\user\AUTOLOGIN.REG file in any text edi- tor (e.g.
-
Page 30: Checking The Supplied Options
® Preparing for Use R&S Performing a Self-Alignment 4.12 Checking the Supplied Options The instrument can be equipped with both hardware and firmware options. To check whether the installed options correspond to the options indicated on the delivery note, proceed as follows. 1. -
Page 31: Considerations For Test Setup
® Preparing for Use R&S Considerations for Test Setup 3. Select the "Start Self Alignment" button in the "Alignment" dialog box. Once the system correction values have been calculated successfully, a mes- sage is displayed. To display the alignment results again later ●... -
Page 32: Protecting Data Using The Secure User Mode
® Preparing for Use R&S Protecting Data Using the Secure User Mode 4.15 Protecting Data Using the Secure User Mode During normal operation, the R&S FSW uses a solid-state drive to store its oper- ating system, instrument firmware, instrument self-alignment data, and any user data created during operation. - Page 33 ® Preparing for Use R&S Protecting Data Using the Secure User Mode Storing required data permanently Any data that is to be available for subsequent sessions with the R&S FSW must be stored on the instrument permanently, before activating the secure user mode. This includes predefined instrument settings, transducer factors and self-align- ment data.
- Page 34 ® Preparing for Use R&S Protecting Data Using the Secure User Mode Secure Passwords By default, the initial password for both the administrator account and the "SecureUser" account is "894129". When the secure user mode is activated the first time after installation, you are prompted to change the passwords for all user accounts to improve system security.
-
Page 35: Instrument Tour
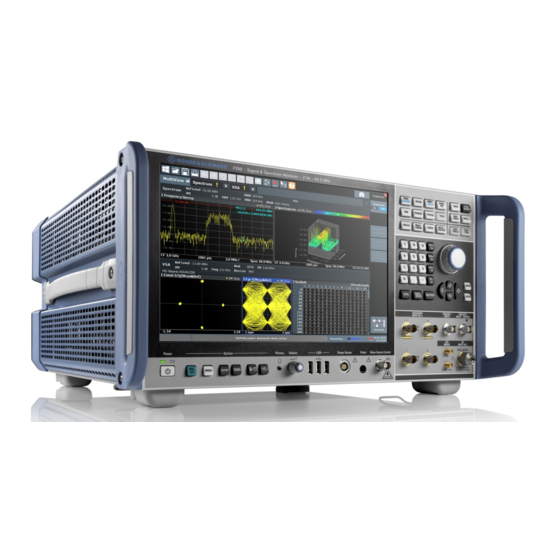
® Instrument Tour R&S Front Panel View Instrument Tour Front Panel View This chapter describes the front panel, including all function keys and connectors. (Note: the graphic shows a 26 GHz model of the R&S FSW. Some connectors on the 85 GHz model differ slightly; differences are indicated for the individual con- nectors.) Figure 5-1: Front panel view of FSW26 1 = POWER key... - Page 36 ® Instrument Tour R&S Front Panel View 10 = (Analog) Baseband Input 50Ω connectors for inverse part of differential I/Q signal (optional, not for R&S FSW85) 11 = NOISE SOURCE CONTROL 12 = PROBE connector 13 = POWER SENSOR connector 14 = USB connectors 15 = Headphones connector and volume control 16 = SYSTEM keys...
- Page 37 ® Instrument Tour R&S Front Panel View Figure 5-2: Touchscreen elements 1 = Toolbar with standard application functions, e.g. print, save/open file etc. 2 = Tabs for individual measurement channels 3 = Channel bar for firmware and measurement settings 4 = Measurement results area 5 = Softkeys for function access 6 = Instrument status bar with error messages, progress bar and date/time display 7 = Diagram footer with diagram-specific information, depending on application...
- Page 38 ® Instrument Tour R&S Front Panel View ● Moving a marker ● Zooming into a diagram ● Selecting a new evaluation method ● Scrolling through a result list or table ● Saving or printing results and settings To imitate a right-click by mouse using the touchscreen, for example to open a context-sensitive menu for a specific item, press the screen for about 1 second.
- Page 39 ® Instrument Tour R&S Front Panel View Function key Assigned functions [TRIG] Sets the trigger mode, the trigger threshold, the trigger delay, and the gate configuration in the case of gated sweep. Marker functions [MKR] Sets and positions the absolute and relative measurement mark- ers (markers and delta markers).
- Page 40 ® Instrument Tour R&S Front Panel View Function key Assigned functions [LINES] Configures display lines and limit lines. [INPUT/OUTPUT] Displays softkeys for input/output functions. Measurement start functions [RUN SINGLE] Starts a single new measurement (Single Sweep Mode). [RUN CONT] Starts a continuous measurement (Continuous Sweep Mode). Function execution (in navigation controls area) [UNDO] Reverts last operation...
- Page 41 ® Instrument Tour R&S Front Panel View 5.1.4.2 Navigation Keys The navigation keys can be used alternatively to the rotary knob to navigate through dialog boxes, diagrams or tables. Arrow Up/Arrow Down Keys The <arrow up> or <arrow down> keys do the following: ●...
- Page 42 ® Instrument Tour R&S Front Panel View 5.1.5 Keypad The keypad is used to enter alphanumeric parameters, including the correspond- ing units (see also Chapter 7.4.2, "Entering Alphanumeric Parameters", on page 103). It contains the following keys: Table 5-2: Keys on the keypad Type of key Description Alphanumeric keys...
- Page 43 ® Instrument Tour R&S Front Panel View ible (0 V / 5 V). You control the connector usage in the "Trigger" settings ([TRIG] key). The trigger output also controls signals by the frequency mask trigger available in Real-Time mode. The rear panel provides a third TRIGGER INPUT / OUTPUT connector, see Chapter 5.2.12, "TRIGGER 3 INPUT/ OUTPUT", on page 54.
- Page 44 ® Instrument Tour R&S Front Panel View Risk of instrument damage Do not fasten the 1.00 mm RF Input connector with a torque larger than ® 0.23 Nm. Rohde & Schwarz offers an appropriate torque wrench (R&S ZTW Torque 0.23 Nm; delivered with the instrument). The RF input can be coupled to the DUT by alternating current (AC) or direct cur- rent (DC).
- Page 45 ® Instrument Tour R&S Front Panel View The upper BNC connectors BASEBAND INPUT I and BASEBAND INPUT Q are used to input: ● Single-ended signals ● The positive signal input for differential signals ● Input from active Rohde & Schwarz probes (see data sheet) The lower BNC connectors Ī...
- Page 46 ® Instrument Tour R&S Front Panel View 5.1.10 NOISE SOURCE CONTROL The noise source control female connector is used to provide the supply voltage for an external noise source. For example, use it to measure the noise figure and gain of amplifiers and frequency converting devices. Conventional noise sources require a voltage of +28 V to be switched on and 0 V to be switched off.
- Page 47 ® Instrument Tour R&S Front Panel View 5.1.14 PHONES and VOLUME You can use headphones to monitor demodulated audio frequencies in time domain measurements acoustically. Connect headphones equipped with a miniature jack plug to the PHONES female connector. Set the output voltage using the "Volume" control to the right of the female connector.
-
Page 48: Rear Panel View
® Instrument Tour R&S Rear Panel View SYSTEM key Assigned functions Switches between maximized and split display of focus area. Moves focus area from one active window to the next. Rear Panel View This figure shows the rear panel view of the R&S FSW. The individual elements are described in more detail in the subsequent sections. - Page 49 ® Instrument Tour R&S Rear Panel View Figure 5-4: Rear panel view - extract 1 1 = Removable system hard drive 2 = AC Power Supply Connection and Main Power Switch 3 = USB (DEVICE) connectors 4 = LAN connector 5 = DVI connector for external display 6 = DISPLAY PORT for external display Figure 5-5: Rear panel view - extract 2...
- Page 50 ® Instrument Tour R&S Rear Panel View Figure 5-6: Rear panel view - extract 3 1 = Analog baseband interface (option B71) 2 = External generator control (option B10) 3 = Alignment Signal Source (option B2000) Figure 5-7: Rear panel view - extract 4 1 = REF INPUT/OUTPUT connectors 2 = OCXO external reference (option B4) 5.2.1...
- Page 51 ® Instrument Tour R&S Rear Panel View 5.2.3 The rear panel provides four additional female USB (USB-A) connectors to con- nect devices like a keyboard, a mouse or a memory stick (see also Chap- ter 5.1.13, "USB", on page 46). Furthermore, a male USB DEVICE connector (USB-B) is provided, for example to connect the R&S FSW to a PC for remote control.
- Page 52 ® Instrument Tour R&S Rear Panel View ● 512 MHz (with option B512/U512) ● 1200 MHz (with option B1200/U1200) ● 2001 MHz (with option B2001/U2001) ● 4001 MHz (with option B4001/U4001) ● 6001 MHz (with option B6001/U6001) ● 8001 MHz (with option B8001/U8001) While the extension can be activated or deactivated manually in the R&S FSW base unit (I/Q Analyzer application), it is activated automatically in some applica- tions that also support I/Q data analysis.
- Page 53 ® Instrument Tour R&S Rear Panel View The output connector provides I/Q data streams with a sample rate of up to 600 MHz, if the R&S FSW-B517 option is installed and active. Output is activated in the software ([INPUT/OUTPUT] key). See the R&S FSW I/Q Analyzer and I/Q Input User Manual for details.
- Page 54 ® Instrument Tour R&S Rear Panel View 5.2.11 DIGITAL BASEBAND INPUT / OUTPUT (R&S FSW-B17) The optional DIGITAL BASEBAND connectors allow you to provide digital I/Q data for measurements with the R&S FSW. Using the output connector you can provide RF input from the R&S FSW to a connected device as digital I/Q data. The digital input and output connectors cannot be used simultaneously.
- Page 55 ® Instrument Tour R&S Rear Panel View The upper BNC connectors BASEBAND INPUT I and BASEBAND INPUT Q are used to input: ● Single-ended signals ● The positive signal input for differential signals ● Input from active Rohde & Schwarz probes (see data sheet) The lower BNC connectors Ī...
- Page 56 ® Instrument Tour R&S Rear Panel View 5.2.15 External Generator Control Option (R&S FSW-B10) The external generator control option provides an additional GPIB and an "AUX control" connector. The GPIB connector can be used to connect the external generator to the R&S FSW.
- Page 57 ® Instrument Tour R&S Rear Panel View Connector Reference signal Usage REF INPUT 1...50 MHz To provide an external reference signal on the R&S FSW. 0...10 dBm REF OUTPUT 1...50 MHz To provide the same external reference signal received by the REF INPUT 1...50 MHz connector to 0...10 dBm another device, when available.
- Page 58 ® Instrument Tour R&S Rear Panel View 5.2.19 IF OUT 2 GHz / 5 GHz Connector The female SMA connector is only available for instrument models R&S FSW26/43/50/67/85. It can be used to provide intermediate frequency (IF) output of approximately 2 GHz at a frequency of 2 GHz. Output is activated in the software ([INPUT/OUTPUT] key).
- Page 59 ® Instrument Tour R&S Rear Panel View The serial number is used to define the default instrument name, which is: <Type><variant>-<serial_number> For example, FSW8-123456. The instrument name is required to establish a connection to the instrument in a LAN. Getting Started 1338.4102.02 ─ 08...
-
Page 60: Trying Out The Instrument
® Trying Out the Instrument R&S Measuring a Basic Signal Trying Out the Instrument This chapter introduces the most important functions and settings of the R&S FSW step by step. The complete description of the functionality and its usage is given in the R&S FSW User Manual. Basic instrument operation is described in Chapter 7, "Operating the Instrument",... - Page 61 ® Trying Out the Instrument R&S Measuring a Basic Signal 5. Tap the "Calibration Frequency RF" option. Leave the frequency at the default 64 MHz, with a narrowband spectrum. The calibration signal is now sent to the RF input of the R&S FSW. By default, a continuous frequency sweep is performed, so that the spectrum of the cali- bration signal is now displayed in the standard level versus frequency dia- gram.
-
Page 62: Displaying A Spectrogram
® Trying Out the Instrument R&S Displaying a Spectrogram b) Tap the "Frequency" button. c) In the "Center" field, enter 64 on the number pad on the front panel. d) Press the "MHz" key next to the number pad. 2. Reduce the span to 20 MHz: a) In the "Span"... - Page 63 ® Trying Out the Instrument R&S Displaying a Spectrogram shows the frequency, the y-axis shows the time. A third dimension, the power level, is indicated by different colors. Thus you can see how the strength of the signal varies over time for different frequencies. 1.
-
Page 64: Activating Additional Measurement Channels
® Trying Out the Instrument R&S Activating Additional Measurement Channels You see the spectrogram compared to the standard spectrum display. Since the calibration signal does not change over time, the color of the frequency levels does not change over time, i.e. vertically. The legend at the top of the spectrogram window describes the power levels the colors represent. - Page 65 ® Trying Out the Instrument R&S Activating Additional Measurement Channels 2. On the "New Channel" tab of the "Signal + Spectrum Mode" dialog box, tap the "Spectrum" button. Figure 6-5: Adding a new measurement channel 3. Change the frequency range for this spectrum display: In the "Frequency"...
- Page 66 ® Trying Out the Instrument R&S Activating Additional Measurement Channels Figure 6-6: Frequency spectrum of the calibration signal with a larger span 4. Repeat the previous steps to activate a third Spectrum window. Change the frequency range for this spectrum display: In the "Frequency"...
- Page 67 ® Trying Out the Instrument R&S Activating Additional Measurement Channels Figure 6-7: Time domain display of the calibration signal 5. Create a new channel for I/Q analysis: a) Press the [Mode] key. b) Tap the "IQ Analyzer" button to activate a channel for the I/Q Analyzer application.
- Page 68 ® Trying Out the Instrument R&S Activating Additional Measurement Channels d) Drag the "Real/Imag (I/Q)" icon from the evaluation bar to the SmartGrid. Figure 6-8: Inserting a Real/Imag diagram for I/Q analysis e) Close the SmartGrid mode. The "IQ Analyzer" channel displays the real and imaginary signal parts in sep- arate windows.
-
Page 69: Performing Sequential Measurements
® Trying Out the Instrument R&S Performing Sequential Measurements Figure 6-9: The "MultiView" tab Performing Sequential Measurements Although only one measurement can be performed at any one time, the measure- ments configured in the active channels can be performed sequentially, that means: one after the other, automatically, either once or continuously. -
Page 70: Setting And Moving A Marker
® Trying Out the Instrument R&S Setting and Moving a Marker Figure 6-10: "MultiView" tab with active Sequencer Figure 6-10, the "Spectrum 2" measurement is currently active (indicated by the "channel active" icon in the tab label). 3. Stop the Sequencer by tapping the "Sequencer" softkey again. Setting and Moving a Marker Markers are useful to determine the position of particular effects in the trace. - Page 71 ® Trying Out the Instrument R&S Setting and Moving a Marker 3. Press the "Split/Maximize" key on the front panel to maximize the spectrum window, as we currently do not need the spectrogram display. 4. Press the "RUN SINGLE" key on the front panel to perform a single sweep so we have a fixed trace to set a marker on.
-
Page 72: Displaying A Marker Peak List
® Trying Out the Instrument R&S Displaying a Marker Peak List Displaying a Marker Peak List The marker peak list determines the frequencies and levels of peaks in the spec- trum automatically. We will display a marker peak list for the Spectrum 2 channel. 1. -
Page 73: Zooming Into The Display
® Trying Out the Instrument R&S Zooming into the Display b) Tap the "Marker Config" softkey in the "Marker" menu. c) Tap the "Search" tab in the "Marker" dialog box. d) In the "Threshold" field, enter -68 dBm. e) Tap the "State" box for "Threshold" to activate its use. Only peaks that are larger than -68 dBm will be included in the peak list. - Page 74 ® Trying Out the Instrument R&S Zooming into the Display 2. Tap the diagram near the first peak and drag your finger to the opposite corner of the zoom area. A white rectangle is displayed from the point where you tap- ped to the current position.
- Page 75 ® Trying Out the Instrument R&S Zooming into the Display Figure 6-14: Zoomed peak with increased number of sweep points Note that the trace becomes much more precise. 4. Tap the "Multiple Zoom" icon in the toolbar again and define a zoom area around markers M4, M5 and M6.
- Page 76 ® Trying Out the Instrument R&S Zooming into the Display 5. Tap the "Multiple Zoom" icon in the toolbar again and define a zoom area around marker M8. 6. To increase the size of the third zoom window, drag the "splitter" between the windows to the left or right or up or down.
-
Page 77: Zooming Into The Display Permanently
® Trying Out the Instrument R&S Zooming into the Display Permanently Zooming into the Display Permanently The zoomed results from Chapter 6.7, "Zooming into the Display", on page 73 were only graphical changes to the display. Now we would like to change the measurement settings such that the zoomed result is maintained permanently. - Page 78 ® Trying Out the Instrument R&S Zooming into the Display Permanently The area around the marker is enlarged in the result display. 5. When the area has the size you require, remove your fingers from the display. The displayed span and the number of displayed sweep points is smaller than before, all other measurement settings remain unchanged.
-
Page 79: Saving Settings
® Trying Out the Instrument R&S Saving Settings 7. Select "Adapt Hardware to Zoom (selected diagram)". The span of the measurement is changed, and due to the automatic coupling of the span to the sweep time, RBW and VBW, those values are also changed. - Page 80 ® Trying Out the Instrument R&S Saving Settings 2. Press the keyboard key on the front panel to display the on-screen keyboard, as you will have to enter text in the next step. 3. In the "Save" dialog box, tap the "File Name" field and enter MyMultiView- Setup using the external or onscreen keyboard.
-
Page 81: Printing And Saving Results
® Trying Out the Instrument R&S Printing and Saving Results To load stored instrument settings You can restore the settings to the instrument at any time using the settings file. 1. Press the [PRESET] button to restore the default instrument settings so you can check that the stored user settings are actually restored afterwards. - Page 82 ® Trying Out the Instrument R&S Printing and Saving Results To create a screenshot of the display 1. Tap the "Print immediately" icon in the toolbar. A screenshot of the current display is created. Note that the colors on the screen are inverted in the screenshot to improve printout results.
-
Page 83: Operating The Instrument
® Operating the Instrument R&S Understanding the Display Information Operating the Instrument This chapter provides an overview on how to work with the R&S FSW. Remote control In addition to working with the R&S FSW interactively, located directly at the instrument, it is also possible to operate and control it from a remote PC. - Page 84 ® Operating the Instrument R&S Understanding the Display Information 1 = Channel bar for firmware and measurement settings 2 = Window title bar with diagram-specific (trace) information 3 = Diagram area with marker information 4 = Instrument status bar with error messages, progress bar and date/time display 5 = Diagram footer with diagram-specific information, depending on measurement application Hiding elements in the display You can hide some of the elements in the display, for example the status bar...
- Page 85 ® Operating the Instrument R&S Understanding the Display Information ● Frequency and Span Information in Diagram Footer........92 ● Instrument and Status Information..............92 ● Error Information..................... 93 7.1.1 Channel Bar Using the R&S FSW you can handle several different measurement tasks (chan- nels) at the same time, although they can only be performed asynchronously.
- Page 86 ® Operating the Instrument R&S Understanding the Display Information Icons in the channel bar yellow star icon on the tab label (sometimes referred to as a "dirty flag") indicates that invalid or inconsistent data is displayed, that is: the trace no longer matches the displayed instrument settings.
- Page 87 ® Operating the Instrument R&S Understanding the Display Information Sweep time that has been set. If the sweep time does not correspond to the value for automatic coupling, a bullet is displayed in front of the field. The color of the bullet turns red if the sweep time is set below the value for auto- matic coupling.
- Page 88 ® Operating the Instrument R&S Understanding the Display Information The following types of information are displayed, if applicable. Table 7-2: Common settings displayed in the channel bar "SGL" The sweep is set to single sweep mode. "Sweep The current signal count for measurement tasks that involve a specific number Count"...
- Page 89 ® Operating the Instrument R&S Understanding the Display Information "Ext. Gen" The R&S FSW is controlling an external generator (requires option R&S FSW- B10). <"NOR" | "APX"> NOR: the measurements are normalized with the results of the external gener- ator calibration APX (approximation): the measurements are normalized with the results of the external generator calibration;...
- Page 90 ® Operating the Instrument R&S Understanding the Display Information Double-tap the window title bar to enlarge the window temporarily. Double- tap it again to restore the original size. See also Chapter 7.6.4, "Switching Between a Split and Maximized Window Display", on page 115.
- Page 91 ® Operating the Instrument R&S Understanding the Display Information 7.1.3 Marker Information Marker information is provided either in the diagram grid or in a separate marker table, depending on the configuration. Marker information in diagram grid Within the diagram grid, the x-axis and y-axis positions of the last two markers or delta markers that were set are displayed, if available, as well as their index.
- Page 92 ® Operating the Instrument R&S Understanding the Display Information MDepth AM modulation depth Third order intercept measurement 7.1.4 Frequency and Span Information in Diagram Footer The information in the diagram footer (beneath the diagram) depends on the cur- rent application, measurement, and result display. For a default measurement in the Spectrum mode, the Diagram result display contains the following information, for example: Label...
- Page 93 ® Operating the Instrument R&S Understanding the Display Information The optional Digital Baseband Interface (R&S FSW-B17) is being used to provide digital output. For details on the Digital Baseband Interface (R&S FSW-B17), see the R&S FSW I/Q Analyzer User Manual. The optional Digital I/Q 40G Streaming Output Connector (R&S FSW-B517) IQ 40G is being used to provide digital output.
-
Page 94: Accessing The Functionality
® Operating the Instrument R&S Accessing the Functionality Table 7-3: Status bar information - color coding Color Type Description Error An error occurred at the start or during a measurement, e.g. due to missing data or wrong settings, so that the measurement cannot be started or completed correctly. - Page 95 ® Operating the Instrument R&S Accessing the Functionality ● Icons on the tool bar in the touchscreen ● Displayed setting on the touchscreen 7.2.1 Toolbar Standard functions can be performed via the icons in the toolbar at thetop of the screen.
- Page 96 ® Operating the Instrument R&S Accessing the Functionality Icon Description Selection mode: the cursor can be used to select (and move) markers in a zoomed display (This function is only available and required for older instruments that do not support multi-touch gestures.) Measurement zoom: applies to the next display you select;...
- Page 97 ® Operating the Instrument R&S Accessing the Functionality Icon Description SmartGrid: activates "SmartGrid" mode to configure the screen layout Sequencer: opens the "Sequencer" menu to perform consecutive measurements SCPI Recorder: opens a dialog to record SCPI commands during operation Event based actions manager: opens a dialog to configure actions based on specific events For details see General Instrument Setup in the R&S FSW base unit user manual.
- Page 98 ® Operating the Instrument R&S Accessing the Functionality A list of softkeys for a certain function key is also called a menu. Softkeys can either perform a specific function or open a dialog box. The "More" softkey indicates that the menu contains more softkeys than can be displayed at once on the screen.
- Page 99 ® Operating the Instrument R&S Accessing the Functionality Figure 7-1: Context menu for a result display with SCPI Recorder functions If SCPI Recorder functions are not available, for example for channel bar settings or in some applications, the context menu contains functions for the selected item.
-
Page 100: Changing The Focus
® Operating the Instrument R&S Changing the Focus The on-screen keyboard display can be switched on and off as desired using the "On-Screen Keyboard" function key beneath the screen. When you press this key, the display switches between the following options: ●... -
Page 101: Entering Data
® Operating the Instrument R&S Entering Data Entering Data You can enter data in dialog boxes using any of the following methods: ● Using the touchscreen, via the on-screen keyboard ● Using other elements provided by the front panel, e.g. the keypad, rotary knob, or navigation keys The rotary knob acts like the [ENTER] key when it is pressed. - Page 102 ® Operating the Instrument R&S Entering Data 3. If the parameter does not require a unit, confirm the entered value by pressing the [ENTER] key or any of the unit keys. The editing line is highlighted to confirm the entry. Digit-based data entry By default, when you enter a numeric value in an input field, you overwrite the existing value.
- Page 103 ® Operating the Instrument R&S Entering Data 7.4.2 Entering Alphanumeric Parameters If a field requires alphanumeric input, you can use the on-screen keyboard to enter numbers and (special) characters (see Chapter 7.2.4, "On-screen Key- board", on page 99). Alternatively, you can use the keypad. Every alphanumeric key represents sev- eral characters and one number.
-
Page 104: Touchscreen Gestures
® Operating the Instrument R&S Touchscreen Gestures 2. Press the [BACKSPACE] key. The entry to the left of the cursor is deleted. 3. Enter your correction. To complete the entry ► Press the [ENTER] key or the rotary knob. To abort the entry ►... - Page 105 ® Operating the Instrument R&S Touchscreen Gestures Tapping Touch the screen quickly, usually on a specific element. You can tap most elements on the screen; in particular, any elements you can also click on with a mouse pointer. Figure 7-3: Tapping Double-tapping Tap the screen twice, in quick succession.
- Page 106 ® Operating the Instrument R&S Touchscreen Gestures When you pinch two fingers in the display, you decrease the size of the currently displayed area, showing the surrounding areas previously out of view. When you spread two fingers in the display, you increase the size of the currently displayed area, showing more details.
- Page 107 ® Operating the Instrument R&S Touchscreen Gestures ● Dragging vertically in a power vs frequency (spectrum) or power vs. time dis- play changes the reference level (for absolute scaling) or the min and max power values (for relative scaling). ● Dragging horizontally in a time domain display changes the trigger offset value (if available, not in free run).
-
Page 108: Displaying Results
® Operating the Instrument R&S Displaying Results Mouse operation Touch operation Drag-&-drop (= click and hold, then drag and Touch, then drag and release release) n.a. (Change hardware settings) Spread and pinch two fingers Mouse wheel to scroll up or down Swipe Dragging scrollbars to scroll up or down, left or Swipe... - Page 109 ® Operating the Instrument R&S Displaying Results measurement settings are restored. Each channel is displayed in a separate tab on the screen. An additional tab ("MultiView") provides an overview of all currently active chan- nels at once. Only one measurement can be performed at any time, namely the one in the cur- rently active channel.
- Page 110 ® Operating the Instrument R&S Displaying Results 3. In the "Mode" dialog box, select the new application to be displayed on the "Replace Current Channel" tab. The selected application is displayed in the current channel. To close a measurement channel ►...
-
Page 111: Background Information: The Smartgrid Principle
® Operating the Instrument R&S Displaying Results ● All display configuration actions are only possible in SmartGrid mode. When SmartGrid mode is activated, the evaluation bar replaces the current softkey menu display. When the SmartGrid mode is deactivated again, the previous softkey menu display is restored. - Page 112 ® Operating the Instrument R&S Displaying Results of the window as it would be if the icon were dropped at the current position. The frames indicate the possible destinations of the new window with respect to the existing windows: above/below, right/left or replacement (as illustrated in Fig- 7-8).
-
Page 113: How To Activate Smartgrid Mode
® Operating the Instrument R&S Displaying Results 7.6.2.2 How to Activate SmartGrid Mode All display configuration actions are only possible in SmartGrid mode. In Smart- Grid mode the evaluation bar replaces the current softkey menu display. When the SmartGrid mode is deactivated again, the previous softkey menu display is restored. -
Page 114: How To Close A Result Window
® Operating the Instrument R&S Displaying Results 7.6.2.4 How to Close a Result Window ► To close a window, activate SmartGrid mode and select the "Delete" icon for the window. 7.6.2.5 How to Arrange the Result Windows 1. Select an icon from the evaluation bar or the "Move" icon for an existing eval- uation window. - Page 115 ® Operating the Instrument R&S Displaying Results The splitters are not available in SmartGrid mode. ► To change the size of two neighboring windows, drag the splitter between the windows in either direction. 7.6.4 Switching Between a Split and Maximized Window Dis- play To get an overview of the results, displaying several windows at the same time may be helpful.
-
Page 116: Getting Help
® Operating the Instrument R&S Getting Help Alternatively, double-tap the title bar of a window to maximize it. 7.6.5 Changing the Display The display can be optimized for your individual needs. The following display functions are available and are described in detail in the User Manual. ●... - Page 117 ® Operating the Instrument R&S Getting Help The "Help" dialog box "View" tab is displayed. A topic containing information about the focused screen element is displayed. If no context-specific help topic is available, a more general topic or the "Con- tent"...
-
Page 118: Contacting Customer Support
® Contacting Customer Support R&S Contacting Customer Support Technical support – where and when you need it For quick, expert help with any Rohde & Schwarz product, contact our customer support center. A team of highly qualified engineers provides support and works with you to find a solution to your query on any aspect of the operation, program- ming or applications of Rohde &... -
Page 119: Index
® Index R&S Index Symbols CNT (marker functions) ......91 Compatible mode (channel setting) ..87 75 Ω (channel bar) ........88 Connector AC power supply .........50 Aux. Port ..........53 AC (channel bar) ........88 BASEBAND INPUT ...... 44, 54 Alignment Signal Source Digital I/Q 40G Streaming Out .... - Page 120 ® Index R&S Display Changing - see User Manual .... 116 GAT (channel bar) ........88 Deactivating - see User Manual ..116 Getting started ......... 12 Evaluation bar ........113 GPIB interface Information .......... 83 Configuring - see user manual ....53 SmartGrid ..........110 Connector ...........
- Page 121 ® Index R&S Numeric parameters ......101 Configuration - see user Manual ..16 OCXO Connector ........... 51 Connector ........... 57 Loading Offset (channel setting) ......86 Trying out ..........81 On-screen keyboard ......99, 103 Login Online help Secure user mode ......28 Working with ........116 LVL (channel bar) ........
- Page 122 ® Index R&S Service manual ........13 Sgl (channel bar) ........88 QP (trace information) ......90 SmartGrid Activating .......... 113 Arranging windows ......114 RBW (channel setting) ......87 Display ..........110 Rear panel Evaluation bar ........113 Overview ..........48 Features ..........
- Page 123 ® Index R&S Touchscreen Zooming Overview ..........36 see User Manual ....... 116 Trace information ........90 Trying out ..........73 Detector type ........90 Trace number ........90 Window title bar ........90 TRG (channel bar) ........88 TRIGGER Connector ........... 54 TRIGGER INPUT / OUTPUT Connectors .........
Need help?
Do you have a question about the FSW Series and is the answer not in the manual?
Questions and answers