Table of Contents
Advertisement
Advertisement
Table of Contents

Related Manuals for Rohde & Schwarz FSW Series


Summary of Contents for Rohde & Schwarz FSW Series
- Page 1 ® R&S Signal and Spectrum Analyzer Getting Started (=<ìD2) 1312.9420.02 ─ 15...
- Page 2 ® This manual applies to the following R&S FSW models with firmware version 2.00 and higher: ● R&S ® FSW8 (1312.8000K08) ● R&S ® FSW13 (1312.8000K13) ● R&S ® FSW26 (1312.8000K26) ● R&S ® FSW43 (1312.8000K43) ● R&S ® FSW50 (1312.8000K50) ●...
-
Page 3: Table Of Contents
® Contents R&S Contents 1 Preface..................5 1.1 Key Features..................5 1.2 Documentation Overview..............6 1.3 Conventions Used in the Documentation...........8 2 Preparing for Use..............9 2.1 Putting into Operation................9 2.2 Windows Operating System.............. 18 2.3 Connecting USB Devices..............21 2.4 Connecting an External Monitor............23 2.5 Setting Up a Network (LAN) Connection.......... - Page 4 ® Contents R&S 4.9 Printing and Saving Results.............. 77 5 Operating the Instrument............78 5.1 Understanding the Display Information..........78 5.2 Accessing the Functionality.............. 89 5.3 Changing the Focus................89 5.4 Entering Data..................90 5.5 Displaying Results................92 5.6 Getting Help..................101 5.7 Remote Control................. 104 6 Obtaining Technical Support..........106 Index...................
-
Page 5: Preface
® Preface R&S Key Features Preface Key Features The R&S FSW Signal and Spectrum Analyzer sets standards in RF performance and usability. Outstanding key features are: ● Unmatched phase noise ● Excellent dynamic range ● Up to 160 MHz analysis bandwidth ●... -
Page 6: Documentation Overview
® Preface R&S Documentation Overview Documentation Overview The user documentation for the R&S FSW consists of the following parts: ● Printed Getting Started manual ● Online Help system on the instrument ● Documentation CD-ROM with: – Getting Started – User Manuals for base unit and firmware applications –... - Page 7 ® Preface R&S Documentation Overview User Manuals User manuals are provided for the base unit and each additional (firmware) appli- cation. The user manuals are available in PDF format - in printable form - on the Docu- mentation CD-ROM delivered with the instrument. In the user manuals, all instru- ment functions are described in detail.
-
Page 8: Conventions Used In The Documentation
® Preface R&S Conventions Used in the Documentation Conventions Used in the Documentation 1.3.1 Typographical Conventions The following text markers are used throughout this documentation: Convention Description "Graphical user interface All names of graphical user interface elements on the screen, elements"... -
Page 9: Preparing For Use
® Preparing for Use R&S Putting into Operation Preparing for Use ● Putting into Operation..................9 ● Windows Operating System................18 ● Connecting USB Devices................21 ● Connecting an External Monitor..............23 ● Setting Up a Network (LAN) Connection............25 ● Configuring the Initial Instrument Settings............ - Page 10 ® Preparing for Use R&S Putting into Operation Risk of electrostatic discharge (ESD) Electrostatic discharge (ESD) can cause damage to the electronic compo- nents of the instrument and the device under test (DUT). ESD is most likely to occur when you connect or disconnect a DUT or test fixture to the instru- ment's test ports.
- Page 11 ® Preparing for Use R&S Putting into Operation ● Unpacking and Checking the Instrument............11 ● Accessory List....................12 ● Placing or Mounting the Instrument..............12 ● Connecting the AC Power................15 ● Switching the Instrument On and Off.............. 15 ● Performing a Self-Alignment and a Selftest............
- Page 12 ® Preparing for Use R&S Putting into Operation Risk of damage during transportation and shipment Insufficient protection against mechanical and electrostatic effects during transportation and shipment can damage the instrument. ● Always make sure that sufficient mechanical and electrostatic protection is provided.
- Page 13 ® Preparing for Use R&S Putting into Operation Risk of injury if feet are folded out The feet may fold in if they are not folded out completely or if the instrument is shifted. This may cause damage or injury. ●...
- Page 14 ® Preparing for Use R&S Putting into Operation Risk of injury and instrument damage if stacking instruments A stack of instruments may tilt over and cause injury. Furthermore, the instruments at the bottom of the stack may be damaged due to the load imposed by the instruments on top.
- Page 15 ® Preparing for Use R&S Putting into Operation 2.1.4 Connecting the AC Power In the standard version, the R&S FSW is equipped with an AC power supply con- nector. The R&S FSW can be used with different AC power voltages and adapts itself automatically to it.
- Page 16 ® Preparing for Use R&S Putting into Operation The R&S FSW switches to standby mode. 2. Set the AC power switch on the rear panel to position "O", or disconnect the instrument from the AC power supply. The R&S FSW changes into off mode. Risk of losing data If you switch off the running instrument using the rear panel switch or by disconnecting the power cord, the instrument loses its current settings.
- Page 17 ® Preparing for Use R&S Putting into Operation 3. Select the "Start Self-Alignment" button in the "Alignment" dialog box. Once the system correction values have been calculated successfully, a mes- sage is displayed. To display the alignment results again later ●...
-
Page 18: Windows Operating System
® Preparing for Use R&S Windows Operating System Windows Operating System The instrument contains the Windows 7 operating system which has been config- ured according to the instrument's features and needs. Changes in the system setup are only required when peripherals like keyboard or a printer are installed or if the network configuration does not comply with the default settings. - Page 19 ® Preparing for Use R&S Windows Operating System access" mode) on Windows-based instruments, due to potentially degrading instrument performance, it does recommend running it during non-critical hours. For details and recommendations, see the Rohde & Schwarz White Paper "Mal- ware Protection" available at http://www.rohde-schwarz.com/appnote/1EF73. 2.2.2 Service Packs and Updates Microsoft regularly creates security updates and other patches to protect Win-...
- Page 20 ® Preparing for Use R&S Windows Operating System in the background when the R&S FSW is started, without having to enter a pass- word. Some administrative tasks require administrator rights (e.g. the configuration of a LAN network). Refer to the description of the basic instrument setup (SETUP menu) to find out which functions are affected.
-
Page 21: Connecting Usb Devices
® Preparing for Use R&S Connecting USB Devices Switching users when using the automatic login function Which user account is used is defined during login. However, you can also switch the user account to be used when the automatic login function is active. ►... - Page 22 ® Preparing for Use R&S Connecting USB Devices increased as necessary by using USB hubs. Due to the large number of available USB devices, there is almost no limit to the expansions that are possible with the R&S FSW. The following list shows various USB devices that can be useful: ●...
-
Page 23: Connecting An External Monitor
® Preparing for Use R&S Connecting an External Monitor ● French ● Russian Select "Start > Control Panel > Clock, Language, and Region > Change key- boards or other input methods" to configure the keyboard properties. To access the Windows operating system, press the Windows key on the external keyboard. Connecting a mouse The mouse is detected automatically when it is connected. - Page 24 ® Preparing for Use R&S Connecting an External Monitor Screen resolution and format The touchscreen of the R&S FSW is calibrated for a 16:10 format. If you connect a monitor or projector using a different format (e.g. 4:3), the calibra- tion will not be correct and the screen will not react to your touch actions properly.
-
Page 25: Setting Up A Network (Lan) Connection
® Preparing for Use R&S Setting Up a Network (LAN) Connection 6. Select the instrument to be used for display: ● "Display 1": internal monitor only ● "Display 2": external monitor only ● "Duplicate": both internal and external monitor 7. Tap "Apply" to try out the settings before they are accepted permanently, then you can easily return to the previous settings, if necessary. - Page 26 ® Preparing for Use R&S Setting Up a Network (LAN) Connection 2.5.1 Connecting the Instrument to the Network There are two methods to establish a LAN connection to the instrument: ● A non-dedicated network (Ethernet) connection from the instrument to an existing network made with an ordinary RJ-45 network cable.
- Page 27 ® Preparing for Use R&S Setting Up a Network (LAN) Connection 2.5.2 Assigning the IP Address Depending on the network capacities, the TCP/IP address information for the instrument can be obtained in different ways. ● If the network supports dynamic TCP/IP configuration using the Dynamic Host Configuration Protocol (DHCP), all address information can be assigned auto- matically.
- Page 28 ® Preparing for Use R&S Setting Up a Network (LAN) Connection you use the permanent computer name, which determines the address via the DNS server (see "Using a DNS server to determine the IP address" on page 28 and chapter 2.5.3, "Using computer names", on page 29).
- Page 29 ® Preparing for Use R&S Setting Up a Network (LAN) Connection 7. Select the "Properties" button. 8. On the "General" tab, select "Use the following DNS server addresses" and enter your own DNS addresses. For more information refer to the Windows operating system Help. 2.5.3 Using computer names In a LAN that uses a DNS server (Domain Name System server), each PC or...
-
Page 30: Configuring The Initial Instrument Settings
® Preparing for Use R&S Configuring the Initial Instrument Settings 2. Enter the new computer name and close the dialog box. 2.5.4 Changing the Windows Firewall Settings A firewall protects an instrument by preventing unauthorized users from gaining access to it through a network. Rohde & Schwarz highly recommends the use of the firewall on your instrument. -
Page 31: Protecting Data Using The Secure User Mode
® Preparing for Use R&S Protecting Data Using the Secure User Mode 5. If necessary, toggle the "Date and Time Format" between German (DE) and After you have made a change and closed the dialog box, the new date and time is also adopted by the instrument. - Page 32 ® Preparing for Use R&S Protecting Data Using the Secure User Mode Limited storage space The volatile memory used to store data in secure user mode is restricted to 256 MB. Thus, a "Memory full" error may occur although the hard disk indi- cates that storage space is still available.
- Page 33 ® Preparing for Use R&S Protecting Data Using the Secure User Mode Secure Passwords By default, the initial password for both the administrator account ("Instru- ment") and the "SecureUser" account is "894129". When the secure user mode is activated the first time after installation, you are prompted to change the passwords for all user accounts in order to improve system security.
-
Page 34: Instrument Tour
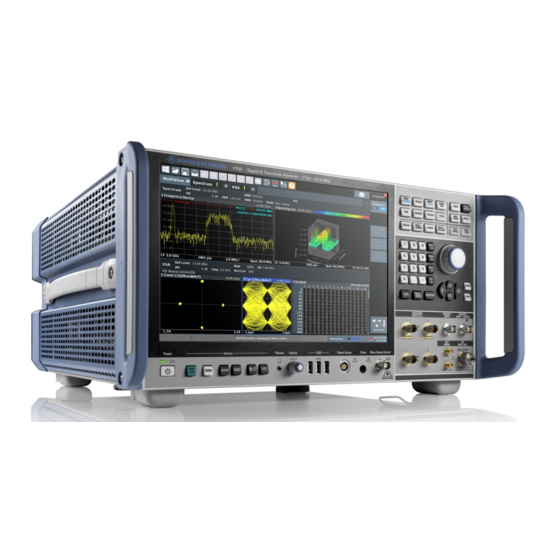
® Instrument Tour R&S Front Panel View Instrument Tour Front Panel View This chapter describes the front panel, including all function keys and connectors. Fig. 3-1: Front panel view 1 = Touchscreen 2 = POWER key 3 = SYSTEM keys 4 = Headphones connector and volume control 5 = USB connectors 6 = POWER SENSOR connector... - Page 35 ® Instrument Tour R&S Front Panel View Instrument damage caused by cleaning agents Cleaning agents contain substances that may damage the instrument, for example cleaning agents that contain a solvent may damage the front panel labeling, plastic parts, or the display. Never use cleaning agents such as solvents (thinners, acetone, etc), acids, bases, or other substances.
- Page 36 ® Instrument Tour R&S Front Panel View Fig. 3-2: Touchscreen elements 1 = Toolbar with standard application functions, e.g. print, save/open file etc. 2 = Tabs for individual measurement channels 3 = Channel bar for firmware and measurement settings 4 = Input field for measurement setting 5 = Softkeys for function access 6 = Window title bar with diagram-specific (trace) information 7 = Measurement results area...
- Page 37 ® Instrument Tour R&S Front Panel View ● Moving a marker ● Zooming into a diagram ● Selecting a new evaluation method ● Scrolling through a result list ● Saving or printing results and settings To imitate a right-click by mouse using the touchscreen, for example to open a context-sensitive menu for a specific item, press the screen for about 1 second.
- Page 38 ® Instrument Tour R&S Front Panel View Icon Description Zoom mode: displays a dotted rectangle in the diagram that can be expanded to define the zoom area Multiple zoom mode: multiple zoom areas can be defined for the same diagram Zoom off: displays the diagram in its original size SmartGrid: activates "SmartGrid"...
- Page 39 ® Instrument Tour R&S Front Panel View Recognizing the softkey status by color Color Meaning orange associated dialog box is open blue associated function is active; for toggle keys: currently active state gray instrument function is temporarily not available due to a specific setting or missing option You can hide the softkey display, e.g.
- Page 40 ® Instrument Tour R&S Front Panel View 3.1.1.4 On-screen Keyboard The on-screen keyboard is an additional means of interacting with the instrument without having to connect an external keyboard. The on-screen keyboard display can be switched on and off as desired using the "On-Screen Keyboard"...
- Page 41 ® Instrument Tour R&S Front Panel View A detailed description of the corresponding functions is provided in the User Man- ual. Table 3-2: SYSTEM keys SYSTEM key Assigned functions PRESET Resets the instrument to the default state. MODE Provides the selection between applications SETUP Provides basic instrument configuration functions, e.g.: ●...
- Page 42 ® Instrument Tour R&S Front Panel View Risk of hearing damage To protect your hearing, make sure that the volume setting is not too high before putting on the headphones. 3.1.5 The front panel provides three female USB connectors (USB-A) to connect devi- ces like a keyboard (recommended: R&S PSL-Z2, order number 1157.6870.03) or a mouse (recommended: R&S PSL-Z10, order number 1157.7060.03).
- Page 43 ® Instrument Tour R&S Front Panel View Conventional noise sources require a voltage of +28 V in order to be switched on and 0 V to be switched off. The output supports a maximum load of 100 mA. 3.1.9 Function Keys Function keys provide access to the most common measurement settings and functions.
- Page 44 ® Instrument Tour R&S Front Panel View Function key Assigned functions MKR FUNC Provides additional analysis functions of the measurement mark- ers: Frequency counter (Sig Count) Fixed reference point for relative measurement markers (Ref Fixed) Noise marker (Noise Meas) Phase noise (Phase Noise) n dB down function AM/FM audio demodulation Peak list...
- Page 45 ® Instrument Tour R&S Front Panel View Function key Assigned functions UNDO Reverts last operation REDO Repeats previously reverted operation. 3.1.10 Keypad The keypad is used to enter alphanumeric parameters, including the correspond- ing units (see also chapter 5.4, "Entering Data", on page 90).
- Page 46 ® Instrument Tour R&S Front Panel View 3.1.11 Navigation Controls The navigation controls include a rotary knob, navigation keys, and UNDO / REDO keys. They allow you to navigate within the display or within dialog boxes. 3.1.11.1 Rotary Knob The rotary knob has several functions: ●...
- Page 47 ® Instrument Tour R&S Front Panel View Arrow Left/Arrow Right Keys The <arrow left> or <arrow right> keys do the following: ● In an alphanumeric edit dialog box, move the cursor. ● In a list, scroll forward and backward through the list entries. ●...
- Page 48 ® Instrument Tour R&S Front Panel View The upper BNC connectors BASEBAND INPUT I and BASEBAND INPUT Q are used to input single-ended signals, the positive signal input for differential signals, as well as input from active Rohde & Schwarz probes (R&S RT-ZSxx and differ- ential probes RT-ZDxx).
- Page 49 ® Instrument Tour R&S Front Panel View 3.1.14 TRIGGER INPUT / OUTPUT The female TRIGGER INPUT connector for external trigger or gate input is used to control the measurement by means of an external signal. The voltage levels can range from 0.5 to 3.5 V. The default value is 1.4 V. The typical input impe- dance is 10 kΩ.
-
Page 50: Rear Panel View
® Instrument Tour R&S Rear Panel View Rear Panel View This figure shows the rear panel view of the R&S FSW. The individual elements are described in more detail in the subsequent sections. Fig. 3-3: Rear panel view 1 = Removable system hard drive 2 = AC Power Supply Connection and Main Power Switch 3 = DISPLAY PORT for external display 4 = DVI connector for external display... - Page 51 ® Instrument Tour R&S Rear Panel View 3.2.1 Removable System Hard Drive The removable system hard drive contains all measurement data from the R&S FSW, allowing you to store the data securely in an external location. 3.2.2 AC Power Supply Connection and Main Power Switch An AC power supply connector and main power switch are located in a unit on the rear panel of the instrument.
- Page 52 ® Instrument Tour R&S Rear Panel View 3.2.5 The rear panel provides four additional female USB (USB-A) connectors to con- nect devices like a keyboard, a mouse or a memory stick (see also chapter 3.1.5, "USB", on page 42). Furthermore, a male USB DEVICE connector (USB-B) is provided, for example for a printer.
- Page 53 ® Instrument Tour R&S Rear Panel View 3.2.7 IF/VIDEO/DEMOD OUTPUT The female BNC connector can be used for various outputs: ● Intermediate frequency (IF) output of approximately 20 MHz ● Video output (1V) Which output is provided is defined in the software (INPUT/OUTPUT key). For details see the User Manual.
- Page 54 ® Instrument Tour R&S Rear Panel View For more information on the Digital Baseband Interface (R&S FSW-B17) and typi- cal applications see the R&S FSW I/Q Analyzer User Manual. 3.2.10 TRIGGER 3 INPUT/ OUTPUT The additional female BNC TRIGGER INPUT / OUTPUT connector can be used to receive a third external signal or to provide a signal to another device.
- Page 55 ® Instrument Tour R&S Rear Panel View Short-circuit hazard Always observe the designated pin assignment. A short-circuit may damage the instrument. 3.2.13 GPIB Interface The GPIB interface is in compliance with IEEE488 and SCPI. A computer for remote control can be connected via this interface. To set up the connection, a shielded cable is recommended.
- Page 56 ® Instrument Tour R&S Rear Panel View ence. It can also be used to synchronize other connected devices via the REF OUTPUT 10 MHz connector. Warm-up time for OCXO When the instrument is switched on, the OCXO requires an extended warm-up time (see data sheet).
- Page 57 ® Instrument Tour R&S Rear Panel View SYNC TRIGGER The SYNC TRIGGER connector can also be used to synchronize the refer- ence frequency on several devices (see chapter 3.2.11, "SYNC TRIGGER OUTPUT/INPUT", on page 54). Getting Started 1312.9420.02 ─ 15...
-
Page 58: Trying Out The Instrument
® Trying Out the Instrument R&S Measuring a Basic Signal Trying Out the Instrument This chapter introduces the most important functions and settings of the R&S FSW step by step. The complete description of the functionality and its usage is given in the R&S FSW User Manual. Basic instrument operation is described in chapter 5, "Operating the Instrument",... - Page 59 ® Trying Out the Instrument R&S Measuring a Basic Signal 5. Tap the "Calibration Frequency RF" option. Leave the frequency at the default 64 MHz, with a narrowband spectrum. The calibration signal is now sent to the RF input of the R&S FSW. By default, a continuous frequency sweep is performed, so that the spectrum of the cali- bration signal is now displayed in the standard level versus frequency dia- gram.
- Page 60 ® Trying Out the Instrument R&S Measuring a Basic Signal a) Tap the "Overview" softkey to display the configuration "Overview". b) Tap the "Frequency" button. c) In the "Center" field, enter 64 on the number pad on the front panel. d) Press the "MHz"...
-
Page 61: Displaying A Spectrogram
® Trying Out the Instrument R&S Displaying a Spectrogram Displaying a Spectrogram In addition to the standard "level versus frequency" spectrum display, the R&S FSW also provides a spectrogram display of the measured data. A spectro- gram shows how the spectral density of a signal varies over time. The x-axis shows the frequency, the y-axis shows the time. -
Page 62: Activating Additional Measurement Channels
® Trying Out the Instrument R&S Activating Additional Measurement Channels 4. Close the SmartGrid mode by tapping the "Close" icon at the top right corner of the toolbar. You see the spectrogram compared to the standard spectrum display. Since the calibration signal does not change over time, the color of the frequency levels does not change over time, i.e. - Page 63 ® Trying Out the Instrument R&S Activating Additional Measurement Channels To activate additional measurement channels 1. Press the MODE key on the front panel. 2. On the "New Channel" tab of the "Signal + Spectrum Mode" dialog box, tap the "Spectrum" button. Fig.
- Page 64 ® Trying Out the Instrument R&S Activating Additional Measurement Channels Fig. 4-6: Frequency spectrum of the calibration signal with a larger span 4. Repeat the previous steps to activate a third Spectrum window. Change the frequency range for this spectrum display: In the "Frequency"...
- Page 65 ® Trying Out the Instrument R&S Activating Additional Measurement Channels Fig. 4-7: Time domain display of the calibration signal 5. Create a new channel for I/Q analysis: a) Press the MODE key. b) Tap the "IQ Analyzer" button to activate a channel for the I/Q Analyzer application.
- Page 66 ® Trying Out the Instrument R&S Activating Additional Measurement Channels d) Drag the "Real/Imag (I/Q)" icon from the evaluation bar to the SmartGrid. Fig. 4-8: Inserting a Real/Imag diagram for I/Q analysis e) Close the SmartGrid mode. The "IQ Analyzer" channel displays the real and imaginary signal parts in sep- arate windows.
-
Page 67: Performing Sequential Measurements
® Trying Out the Instrument R&S Performing Sequential Measurements Fig. 4-9: The "MultiView" tab Performing Sequential Measurements Although only one measurement can be performed at any one time, the measure- ments configured in the active channels can be performed sequentially, that means: one after the other, automatically, either once or continuously. -
Page 68: Setting And Moving A Marker
® Trying Out the Instrument R&S Setting and Moving a Marker Fig. 4-10: "MultiView" tab with active Sequencer figure 4-10, the "Spectrum 2" measurement is currently active (indicated by the "channel active" icon in the tab label). 3. Stop the Sequencer by tapping the "Sequencer" softkey again. Setting and Moving a Marker Markers are useful to determine the position of particular effects in the trace. - Page 69 ® Trying Out the Instrument R&S Setting and Moving a Marker Press the "Split/Maximize" key on the front panel to maximize the spectrum window, as we currently do not need the spectrogram display. 4. Press the "RUN SINGLE" key on the front panel to perform a single sweep so we have a fixed trace to set a marker on.
-
Page 70: Displaying A Marker Peak List
® Trying Out the Instrument R&S Displaying a Marker Peak List Displaying a Marker Peak List The marker peak list determines the frequencies and levels of peaks in the spec- trum automatically. We will display a marker peak list for the Spectrum 2 channel. 1. -
Page 71: Zooming Into The Display
® Trying Out the Instrument R&S Zooming into the Display b) Tap the "Marker Config" softkey in the "Marker" menu. c) Tap the "Search" tab in the "Marker" dialog box. d) In the "Threshold" field, enter -68 dBm. e) Tap the "State" box for "Threshold" to activate its use. Only peaks that are larger than -68 dBm will be included in the peak list. - Page 72 ® Trying Out the Instrument R&S Zooming into the Display 2. Tap the diagram near the first peak and drag your finger to the opposite cor- ner of the zoom area. A white rectangle is displayed from the point where you tapped to the current position.
- Page 73 ® Trying Out the Instrument R&S Zooming into the Display 3. In figure 4-13 the enlarged peak is represented by a very thick trace. This is due to the insufficient number of sweep points. The missing sweep points for the zoomed display are interpolated, which provides poor results. To optimize the results, we will increase the number of sweep points from the default 1001 to 32001.
- Page 74 ® Trying Out the Instrument R&S Zooming into the Display Fig. 4-15: Multiple zoom windows 5. Tap the "Multiple Zoom" icon in the toolbar again and define a zoom area around marker M8. 6. To increase the size of the third zoom window, drag the "splitter" between the windows to the left or right or up or down.
-
Page 75: Saving Settings
® Trying Out the Instrument R&S Saving Settings Fig. 4-16: Enlarged zoom window Saving Settings In order to restore the results of our measurements at a later time, we will store the instrument settings to a file. To save the instrument settings to a file Tap the "Save"... - Page 76 ® Trying Out the Instrument R&S Saving Settings Keep the default "File Type" setting "Instrument with all Channels" to store the configuration of all channels. Fig. 4-17: Saving the instrument settings to a file 4. Tap the "Save" button. The file MyMultiViewSetup.dfl is stored in the default directory C:/R_S/ instr/user.
-
Page 77: Printing And Saving Results
® Trying Out the Instrument R&S Printing and Saving Results 4. Tap the "Load" button. All instrument settings are restored and the display should resemble fig- 4-16, which shows the instrument display right before the settings were stored. Printing and Saving Results Finally, after a successful measurement, we will document our results. -
Page 78: Operating The Instrument
® Operating the Instrument R&S Understanding the Display Information Operating the Instrument This chapter provides an overview on how to work with the R&S FSW. It describes what kind of information is displayed in the diagram area, how to oper- ate the R&S FSW via the front panel keys and other interaction methods, and how to use the Online Help. - Page 79 ® Operating the Instrument R&S Understanding the Display Information = Channel bar for firmware and measurement settings 2+3 = Window title bar with diagram-specific (trace) information = Diagram area with marker information = Diagram footer with diagram-specific information, depending on measurement application = Instrument status bar with error messages, progress bar and date/time display Hiding elements in the display You can hide some of the elements in the display, for example the status...
- Page 80 ® Operating the Instrument R&S Understanding the Display Information 5.1.1 Channel Bar Using the R&S FSW you can handle several different measurement tasks (chan- nels) at the same time (although they can only be performed asynchronously). For each channel, a separate tab is displayed on the screen. In order to switch from one channel display to another, simply select the corresponding tab.
- Page 81 ® Operating the Instrument R&S Understanding the Display Information Icons in the channel bar icon on the tab label indicates that the displayed trace no longer matches the current instrument settings. This may be the case, for example, if a trace is frozen and the instrument settings are changed.
- Page 82 ® Operating the Instrument R&S Understanding the Display Information Compatible Compatible device mode (FSP, FSU, default; default not dis- played) Mode Indicates which sweep mode type is selected: ● "Auto FFT": automatically selected FFT sweep mode ● "Auto sweep": automatically selected swept sweep mode ●...
- Page 83 ® Operating the Instrument R&S Understanding the Display Information Trigger source (for details see "Trigger settings" in the User Manual) ● BBP: Baseband power (with Digital Baseband Interface R&S FSW-B17 only) ● EXT: External ● GP_0: General purpose bit (with Digital Baseband Interface R&S FSW-B17 only) ●...
- Page 84 ® Operating the Instrument R&S Understanding the Display Information 5.1.2 Window Title Bar Each channel in the R&S FSW display may contain several windows. Each win- dow can display either a graph or a table as a result of the channel measurement. Which type of result evaluation is displayed in which window is defined in the dis- play configuration (see chapter 5.5, "Displaying...
- Page 85 ® Operating the Instrument R&S Understanding the Display Information 5.1.3 Marker Information Marker information is provided either in the diagram grid or in a separate marker table, depending on the configuration. Marker information in diagram grid Within the diagram grid, the x-axis and y-axis positions of the last 2 markers or delta markers that were set are displayed, if available, as well as their index.
- Page 86 ® Operating the Instrument R&S Understanding the Display Information 5.1.4 Frequency and Span Information in Diagram Footer The information in the diagram footer (beneath the diagram) depends on the cur- rent application. For Spectrum mode, it contains the following information: Label Information Center frequency...
- Page 87 ® Operating the Instrument R&S Understanding the Display Information In the MultiView tab, the progress bar indicates the status of the currently selected measurement, not the measurement currently being performed by a Sequencer, for example. Date and time The date and time settings of the instrument are displayed in the status bar. 5.1.6 Error Information If errors or irregularities are detected, a keyword and an error message, if availa-...
- Page 88 ® Operating the Instrument R&S Understanding the Display Information If any error information is available for a measurement channel, the icon is displayed next to the channel name. This is particularly useful when the MultiView tab is displayed, as the status bar in the MultiView tab always dis- plays the information for the currently selected measurement only.
-
Page 89: Accessing The Functionality
® Operating the Instrument R&S Accessing the Functionality UNCAL One of the following conditions applies: ● Correction data has been switched off. ● No correction values are available, for example after a firmware update. ● Record the correction data by performing a self alignment (For details refer to chapter 2.1.6, "Performing a Self-Alignment and a Selftest",... -
Page 90: Entering Data
® Operating the Instrument R&S Entering Data ment on the touchscreen. Alternatively, use the "Tab" key on the on-screen key- board or the rotary knob to move the focus from one element to the next on the display. To move the focus between any displayed diagrams or tables in a window, press the "Change focus"... - Page 91 ® Operating the Instrument R&S Entering Data 3. If the parameter does not require a unit, confirm the entered value by pressing the ENTER key or any of the unit keys. The editing line is highlighted in order to confirm the entry. 5.4.2 Entering Alphanumeric Parameters If a field requires alphanumeric input, you can use the on-screen keyboard to...
-
Page 92: Displaying Results
® Operating the Instrument R&S Displaying Results The entry to the left of the cursor is deleted. 3. Enter your correction. Completing the entry ► Press the ENTER key or the rotary knob. Aborting the entry ► Press the ESC key. The dialog box is closed without changing the settings. - Page 93 ® Operating the Instrument R&S Displaying Results The results of a measurement channel can be evaluated in many different ways, both graphically and numerically. For each evaluation method the results are dis- played in a separate window in the tab. The R&S FSW allows you to configure the display to suit your specific require- ments and optimize analysis.
- Page 94 ® Operating the Instrument R&S Displaying Results To start a new channel 1. Select the MODE key. 2. In the "Mode" dialog box, select the required application on the "New Chan- nel" tab. A new tab is displayed for the new channel. To change the application in an active channel 1.
- Page 95 ® Operating the Instrument R&S Displaying Results ● Windows are moved simply by dragging them to a new position on the screen, possibly changing the layout of the other windows, as well. ● All evaluation methods available for the currently selected measurement are displayed as icons in the evaluation bar.
- Page 96 ® Operating the Instrument R&S Displaying Results Fig. 5-1: Moving a window in SmartGrid mode The brown area indicates the possible "drop area" for the window, i.e. the area in which the window can be placed. A blue area indicates the (approximate) layout of the window as it would be if the icon were dropped at the current position.
- Page 97 ® Operating the Instrument R&S Displaying Results Fig. 5-2: SmartGrid window positions 1 = Insert row above or below the existing row 2 = Create a new column in the existing row 3 = Replace a window in the existing row SmartGrid functions Once the evaluation icon has been dropped, icons in each window provide delete and move functions.
- Page 98 ® Operating the Instrument R&S Displaying Results To close the SmartGrid mode and restore the previous softkey menu select the "Close" icon in the right-hand corner of the tool- bar, or press any key on the front panel. 5.5.2.3 How to Add a New Result Window Each type of evaluation is displayed in a separate window.
- Page 99 ® Operating the Instrument R&S Displaying Results 2. Drag the evaluation over the SmartGrid. A blue area shows where the window will be placed. 3. Move the window until a suitable area is indicated in blue. 4. Drop the window in the target area. The windows are rearranged to the selected layout, and "Delete"...
- Page 100 ® Operating the Instrument R&S Displaying Results The splitters are not available in SmartGrid mode. ► To change the size of two neighboring windows, drag the splitter between the windows in either direction. 5.5.4 Switching Between a Split and Maximized Window Dis- play To get an overview of the results, displaying several windows at the same time may be helpful.
-
Page 101: Getting Help
® Operating the Instrument R&S Getting Help 5.5.5 Changing the Display The display can be optimized for your individual needs. The following display functions are available and are described in detail in the User Manual. ● Displaying a simulation of the entire front panel of the instrument on the screen ("Front Panel") ●... - Page 102 ® Operating the Instrument R&S Getting Help The "Help" dialog box "View" tab is displayed. A topic containing information about the focused screen element is displayed. If no context-specific help topic is available, a more general topic or the "Con- tents"...
- Page 103 ® Operating the Instrument R&S Getting Help To search for a topic in the index The index is sorted alphabetically. You can browse the list, or search for entries in the list. 1. Switch to the "Index" tab. 2. Select the "Keyboard" icon besides the entry field. 3.
-
Page 104: Remote Control
® Operating the Instrument R&S Remote Control Remote Control In addition to working with the R&S FSW interactively, located directly at the instrument, it is also possible to operate and control it from a remote PC. Various methods for remote control are supported: ●... - Page 105 ® Operating the Instrument R&S Remote Control files, and network resources of the instrument. Thus, remote operation of the instrument is possible. With Windows 7, Remote Desktop Client is part of the operating system. For other versions of Windows, Microsoft offers the Remote Desktop Client as an add-on.
-
Page 106: Obtaining Technical Support
® Obtaining Technical Support R&S Obtaining Technical Support If problems occur, the instrument generates error messages which in most cases will be sufficient for you to detect the cause of an error and find a remedy. Error messages are described in the "Troubleshooting" section of the user man- uals. - Page 107 ® Obtaining Technical Support R&S Packing and transporting the instrument If the instrument needs to be transported or shipped, e.g. due to damage during delivery, observe the notes described in chapter 2.1.1, "Unpacking and Checking the Instrument", on page 11. Getting Started 1312.9420.02 ─...
-
Page 108: Index
® Index R&S Index Symbols Connector AC power supply .........51 75 Ω (channel bar) ........83 AUX PORT ......... 54 Baseband Input ........47 Display Port ........51 AC (channel bar) ........83 DVI ............51 Alphanumeric parameters ....... 91 External mixer ........49 Analog Baseband Interface (B71) GPIB interface ........ - Page 109 ® Index R&S Display Port Focus area Connector ........... 51 Switching between windows ....41 Display theme Frequency Reference Signal Selecting - see User Manual .....101 see User Manual .........30 DNS server Front Panel LAN configuration ....... 29 Displaying - see User Manual ... 101 Frq (channel bar) ........
- Page 110 ® Index R&S IP address Measurement channels Changing ..........27 Activating ..........93 Closing ..........94 Menus Context-sensitive ........ 39 MI (trace information) ......84 DOWN ..........46 MINH (trace information) ......84 LEFT ........... 47 Mini Front Panel POWER ..........40 Displaying - see User Manual ...
- Page 111 ® Index R&S Parameters Remote Desktop Entering ........90, 91 see User Manual .......104 Passwords Removable hard drive ......51 Secure user mode ......33 Restricted operation Peak list Secure user mode ......32 Trying out ..........70 Restrictions PHN (marker functions) ......85 Storage space ........32 PHONES Results...
- Page 112 ® Index R&S Mode ........... 97 TRIGGER Trying out ..........61 Connector ........... 54 Softkeys TRIGGER INPUT / OUTPUT Status ..........38 Connectors ......... 49 Spectrograms TRK (marker functions) ......85 Trying out ..........61 Troubleshooting Split see User Manual .........87 Window ..........
- Page 113 ® Index R&S Zooming see User Manual .......101 Trying out ..........71 Getting Started 1312.9420.02 ─ 15...
Need help?
Do you have a question about the FSW Series and is the answer not in the manual?
Questions and answers