Table of Contents
Advertisement
Quick Links
Advertisement
Table of Contents

Subscribe to Our Youtube Channel
Related Manuals for VeEX UX400


Summary of Contents for VeEX UX400
-
Page 2: Table Of Contents
Table of Contents 1.0 About This User Manual 2.0 Safety Information 3.0 Introduction 3.1 Platform Overview 3.2 Front Panel 3.2.1 LEDs 3.2.2 Key Pad 3.2.3 Touch Screen 3.3 Battery 3.4 Hardware Configurations 3.4.1 Inserting/Removing Test Modules 3.4.2 Utility Ports 4.0 Getting Started 4.1 Platform Home Screen 4.1.1 Platform Buttons 4.2 Test Modules... - Page 3 5.1.6 Date & Time 5.2 High Precision Clock Sources 5.3 System Firmware/Software Updates 5.3.1 Obtaining the latest software (firmware) versions 5.3.2 Updating the UX400 software 5.3.3 Test Profiles and Test Results Backup Procedure 6.0 File Manager 6.1 Saving Test Results 6.2 Access and navigate saved files...
- Page 4 7.4 Advanced Tools 7.4.1 Fiber Scope 7.4.2 Optical Power Meter 7.4.3 WiFi Spectrum Analyzer 7.4.4 Data Card 7.4.5 WiFi inSSIDer 7.5 VFL 8.0 Warranty and Software 9.0 Certification and Declarations 10.0 About VeEX Go back to TOP UX400_Platform_Manual_RevB00 Page 4 of 83...
-
Page 5: About This User Manual
Copyright © 2019 VeEX Inc. All rights reserved. VeEX, VePAL are registered trademarks of VeEX Inc. and/or its affiliates in the USA and certain other countries. All trademarks or registered trademarks are the property of their respective companies. No part of this document may be reproduced or transmitted electronically or otherwise without written permission from VeEX Inc. -
Page 6: Safety Information
Do not operate the instrument in the presence of flammable gases or fumes or any other combustible environment. VeEX Inc. assumes no liability for the customer's failure to comply with safety precautions and requirements. - Page 7 Do not charge or use the battery pack if any mechanical damage is suspected (shock, impact, puncture, crack, etc). Do not continue charging the battery if it does not recharge within the expected charging time Storage: For long term storage, the battery pack should be stored at 20°C/68°F (room temperature), charged to about 30 to 50% of its capacity.
-
Page 8: Platform Overview
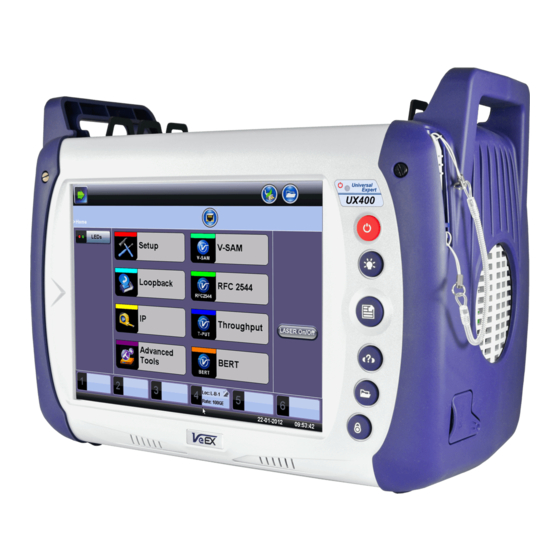
3.0 Introduction to VePAL® UX400 The UX400 is the smallest multi-service transport test solution to offer test capabilities ranging from DS1/E1 all the way up to 600G traffic generation, supporting the latest 100G/40G optical pluggable form factors (CFP4, CFP2, CFP, QSFP28, QSFP+). Its modular architecture allows for up to six independent test modules and up to twelve concurrent tests or combinations of tests, including legacy PDH/DSn, SDH/SONET, OTN, Ethernet, Fibre Channel, CPRI/OBSAI, C/DWDM spectrum analysis and more. -
Page 9: Key Pad
Make sure that the key is aligned while plugging in the AC adapter to the unit. If it is not aligned, the plug will not connect to the unit and using force will damage the connector. Battery Charging time The total charging time depends on the remaining battery capacity percentage and the actual current load in the UX400. An idle UX400_Platform_Manual_RevB00 Page 9 of 83... - Page 10 UX400 (no test modules selected or tests running) would recharge faster than an active one. Attention! For safety reasons, the battery charging time is always limited to a maximum of three hours If the UX400 is being used while charging and a full charge (100% capacity) cannot be achieved within three hours, the charging will automatically stop.
-
Page 11: Hardware Configurations
Go back to top Go back to TOC 3.4 Hardware Configurations The following are examples of some test modules available for the UX400 platform. Please refer to their individual datasheets and manuals for furtherdetails. For an up-to-date list of modules available, please visit www.veexinc.com/UX400... - Page 12 Path trace and pointer generation and analysis Overhead monitoring and byte decoding Tandem Connection Monitoring SDH/SONET mapping down to VC12/VT2 and VC11/VT1.5 Transmit frequency offset SDH/SONET Payload through and monitoring modes 10G Test Module Single-slot test module Dual XFP optical ports Up to two independent tests per module SCPI-based remote control and scripting commands 2.5G Test Module...
- Page 13 BER testing at Layer 2, Layer 3 and Layer 4, with or without VLAN and MPLS tags Multiple stream traffic generation and analysis for end-to-end QoS verification of multiple services Intelligent device discovery mode; discover other VeEX Ethernet testers or loopback devices on the network for quick and easy loopback control configuration...
-
Page 14: Inserting/Removing Test Modules
3.4.1 Inserting-Removing Test Modules Turn the UX400 Platform OFF. Disconnect the DC power cord and ALL other cables and attachments (Fiber patch cords, Ethernet cables, BNC cables, Loopbacks, USB memory sticks, Wi-Fi or Bluetooth® transceivers, Fiber inspection scope, etc.) before inserting or removing test modules into and from the test platform chassis. - Page 15 C bay slots first to keep the modules better cooled. Up to six UX400-100G CFP2, CFP4 or QSFP28 modules can be installed in any of the available slots. Step 5: Gently push the module down to guarantee full contact Step 6: Hand tighten the four captive screws to avoid with the backplane connector.
-
Page 16: Utility Ports
System Firmware/Software Updates.) Step 8: Power on the UX400. The newly installed test module is displayed in the panel view and ready to use. To remove a test module from the chassis 1. By hand, loosen (do not remove) the the four captive screws. -
Page 17: Getting Started
4.0 Getting Started 4.1 Platform Home Screen When powered on, the UX400 unit shows an image of all test modules installed on the unit. Up to six tests can be assigned at any given time to be run on the unit. -
Page 18: Test Modules
This procedure may be started at any time from any screen or menu. UX400 can run up to six tests simultaneously using the user interface on the screen (up to 12 tests using SCPI scripting). When assigning a test module, that module appears in one of the six Test Application tabs at the bottom of the unit's screen. Some tests may require two ports. -
Page 19: Test Module Home Screen
2. Tap the Release button To switch between test application screens Tap the desired test tab at the bottom of the screen and the GUI will update immediately. Go back to top Go back to TOC 4.2.2 Test Module home screen Each test module may have multiple home screens, depending on the test application and test mode selected. -
Page 20: Initial Settings
4.3 Initial Settings 4.3.1 Change language and user interface style Before using the platform, set the language and user interface style as needed. By default, the user interface style is set to USA if the unit is shipped to North America and to International if the unit is shipped to outside North America. International user interface style USA Interface style To change the GUI language and user interface style... -
Page 21: Change Other Settings
4.3.3 Change other settings For more information on changing other global settings, such as units of measurement, profile and results save preferences, password, etc., see Utilities. 4.3.4 Launching Test Applications A. Background Test Application Tap this button to bring its GUI forward Or press the App rubber button to toggle B. - Page 22 Most of these buttons offer immediate action. A few open a configuration menu. Go back to top Go back to TOC UX400_Platform_Manual_RevB00 Page 22 of 83...
-
Page 23: Utilities
5.0 Utilities , on the top left corner of the screen, to access the Utilities submenu. Use the platform Use the System Utilities button sidebar to access settings for the test platform. 5.1 Settings Utilities Settings 5.1.1 About The About option displays: The version of software on the unit. - Page 24 Utility Settings - About - Software Option Utility Settings - About - Software Option UX400_Platform_Manual_RevB00 Page 24 of 83...
-
Page 25: Backlight
To return to the Settings options Click the red exit button Go back to top Go back to TOC 5.1.2 Backlight This section provides backlight control of the unit. Power: There are two settings -- one for Battery power and another for AC power. The user has the option to select a timer to turn off the backlight if the unit is not in use. - Page 26 Backlight - AC Power Brightness: The user can select the brightness level for Battery and AC operation modes. Backlight - Brightness UX400_Platform_Manual_RevB00 Page 26 of 83...
-
Page 27: Remote Access
Go back to top Go back to TOC 5.1.3 Remote Access Use the Remote Access menu to enable or disable the different ways the test set can be accessed remotely and assign customized passwords. The test platform offers different ways to be accessed remotely, including providing access to the information stored in it (e.g. images, test results), or to control it (entirely) or one of its test applications. - Page 28 Profile: Select or create (save) a profile for the remote access configuration. CLI Service: Enable or disable command line interface. CLI Admin Password: Master password to be used to log on to the test platform. It applies to CLI/SCPI and as web remote access administrator credentials.
- Page 29 The web remote control option mirrors the test platform screen, mouse inputs, and keypad buttons. In addition to controlling the test platform by mirroring it, test set data can be accessed via the Web Remote Access landing page. The UX400 multi-user functionality allows each remote user to view different screens simultaneously via the Remote Test Sessions option.
- Page 30 Manual: Access soft copies of the UX400 platform and modules manuals for quick reference. Results: View, download, delete, filter, and convert saved Test Results to PDF. Screen Shots: View, download (PNG format), copy, delete and convert to PDF any screens captured using the UX400 Lock button.
- Page 31 Enter a Remote Test Session by selecting Remote Test Sessions on the Web Remote Access left sidebar menu, and then entering the user account and password at the prompt. Web Browser - Remote Test Sessions The level of user access (view only or view/operate) is configured in the User Management option. Web Browser - Remote Test Sessions (View Only) Web Browser - Remote Test Sessions (Full Access) UX400_Platform_Manual_RevB00...
-
Page 32: Global
To log out of the Remote Test Sessions option, click Logout at the top, above the tabs. Go back to top Go back to TOC 5.1.4 Global Use the Global option to configure common functions of the test platform. Global General Settings UX400_Platform_Manual_RevB00 Page 32 of 83... - Page 33 Language: Select the language to display on the unit. Not all languages may be available for certain test modules. Unit: Select the unit of measurement to display on the unit. (Test module dependent) Audible Alarm: Select On or Off to turn on or off the alarm sound. (Test module dependent) Show Password: Select to choose whether to show passwords upon entry.
- Page 34 File Name Prefix: Enter a prefix to be added to all filenames when saved. This can be used to identify a site, user, case, shelf, card, etc. when multiple tests are being run and stored, so they are easy to identify, sort or group. Profile Deleting: Select option to delete profiles manually or automatically.
-
Page 35: Power
Before charging the test unit's battery pack, it must be recalibrated. To calibrate the battery pack Only when instructed by VeEX support personnel, click the Batt.Cal. button on the Power screen. The unit detects the battery pack and recalibrates it automatically, if needed. - Page 36 Date: Enter current date and tap Apply to set the system time of day (ToD) clock. Time: Enter current time and tap Apply to set the system time of day (ToD) clock. NTP Server: Check the box to allow the test platform to automatically set the ToD correctly by contacting an Internet time server of your choosing.
- Page 37 applies. Select the time zone and tap OK. Automatic daylight savings time (DST) may be available for some of the countries or regions. Offset: Shows the time correction associated with the selected time zone. UTC (Coordinated Universal Time) is the standard time.
-
Page 38: High Precision Clock Sources
5.2 High Precision Clock Sources Precision Clock References GPS Receiver (HW Option) The optional high-sensitivity GPS module (built-in) provides accurate Phase alignment and Coordinated Universal Time (UTC) synchronization to the test set, in the form of internal pulse-per-second (1PPS) clock synchronized to the standard second and time stamps. - Page 39 Atomic Clock Phase Monitoring Certain VeEX test sets equipped with GPS receiver and Chip Scale Atomic Clock options may include a relative phase monitoring tool that can be used for the Relative Phase Measurements that provide a bit more visibility into the disciplining process.
- Page 40 Relative phase measurements are more useful when monitored at the beginning of the disciplining process, to track the phase alignment between the oscillator's output (Atomic 1PPS) and its input (GPS 1PPS). Since the oscillator filters the raw 1PPS noise and fine tunes its frequency to align its own 1PPS to true time, the input vs output differential graph can become a very useful tool to monitor and verify that the convergence process is going as expected.
- Page 41 Example of proper (converged and stable) phase alignment Not so good phase alignment The chip scale atomic clock oscillator uses its 10 MHz frequency source for the disciplining process. Its 1PPS phase is initially aligned to the 10 MHz phase, so it should be within ±100 ns (one 10 MHz cycle). Then the CSAC would start steering its frequency to finely align its 1PPS output within a few nanoseconds to the "average"...
- Page 42 Phase Alignment and Holdover Knowing whether the oscillator is still steering (changing) its frequency to correct the 1PPS output's phase has a big impact in deciding when to force the test set into holdover for indoors testing. The Phase Graph can help in identifying when the disciplining process has stabilized.
- Page 43 variations in ambient temperatures and it can take up to five minutes to warm up and should not be used until its status shows "Locked". The atomic clock temperature and status can be monitored at >Utilities>Settings>High Precision Clock Source>Atomic Clock. The chip-scale atomic clock is oven-controlled and temperature-compensated to minimize the effects of ambient temperature variations.
-
Page 44: System Firmware/Software Updates
Using a (PC) web browser, go to http://veexinc.com/en-us/Products/UX400, open the Software download window and click on the links to get the latest UX400 Rootfs and Common SW upgrade package for the Platform (no need to login). Then select the applicable modules’ pages and download the individual Module’s software. Unzip and copy all the resulting ux400-xxx.tar.gz files to the root of a FAT32 USB memory stick. -
Page 45: Test Profiles And Test Results Backup Procedure
UX400 must be connected to AC/DC charger at all times during the whole upgrade process. DO NOT turn it off at any time; the upgrade process may take several minutes and the UX400 will turn itself off at the end. -
Page 46: Access And Navigate Saved Files
6.0 File Management Use the Files submenu in >Utilities>Files>Saved to view test results and screen captures saved on the unit's internal storage. Results are stored until manually deleted, the unit's software is upgraded or it's internal memory is reformatted. 6.1 Save Test Results Test results can be saved at any time while a test is running or after completed. - Page 47 The following file information is displayed on the Saved files screen: Name: Name of file (If not specified at time of saving, a default name appears.) Module: Test module used to perform the test Mode: Test mode in which the test was conducted Test: Type of test conducted Port: Port on which the test was performed Date: Date file was saved...
-
Page 48: Renaming A File
stick is connected to the unit and a file is selected). From USB: Transfer files from a USB memory drive to the unit's saved files (only enabled when a USB memory stick is connected to the unit). To USB: Transfer files to a USB memory drive (only enabled when a USB memory stick is connected to the unit). Show All: Reset the screen and remove filters. -
Page 49: Viewing File Storage Information (Memory Capacity)
indicates the file is unlocked. After locking a file, it cannot be deleted or renamed. Go back to top Go back to TOC 6.2.5 Viewing file storage information (memory capacity) To view memory capacity information Tap the Files icon at the top. The Storage Information screen displays the current file capacity and current memory utilization percentage. -
Page 50: View Screen Capture Files
Use the bottom toolbar to perform the following actions: Reload: Refreshes the USB stick information. Delete: Erases the selected files or folders. Up: Exits the current folder and moves up to a higher folder in the file tree hierarchy. The current folder structure is shown in the top bar. -
Page 51: Exporting Files To Usb Stick
The files can also be converted to PDF and saved to a USB stick. 6.5.1 Exporting files to USB stick Test results can be transferred to a USB stick in either HTML format or as a PDF file. To transfer results and profiles to a USB stick 1. - Page 52 To save test results to your PC, select the checkbox next to the file(s) and click Download. A pdf file of the test results can also be generated and downloaded by selecting the file(s) and clicking PDF. Go back to top Go back to TOC UX400_Platform_Manual_RevB00 Page 52 of 83...
-
Page 53: Tools
7.0 Tools 7.1 IP Tools ThThe RJ45, 10/100/1000BaseT management port is located on the top the unit. Use this port to connect to the unit for management purposes (results retrieval, remote connectivity). By default, the network configuration is set to use DHCP. When an Ethernet cable is physically connected to the unit, it attempts to connect to the network automatically. -
Page 54: Ip Connection Status
Static Setup 7.1.2 IP Connection Status Ensure the Status is PASS before continuing with any IP tests. If the connection fails, go back to the setup screen to verify that the parameters are entered correctly. Verify that the Ethernet cable is properly connected on the management port. DHCP: PASS indicates that an IP address has successfully been assigned. - Page 55 Destination: Enter the destination IP address or URL to ping. Number of Pings: Press the field and use the alphanumeric keypad to enter the number of ping attempts that will be performed to reach the network device. If Continuous Ping is selected, the user is not required to enter the number of pings. The test set will continuously ping the target host until the user presses Stop.
-
Page 56: Trace Route
7.1.4 Trace Route Trace Route is a common method used to find the route to the destination IP address or URL. It is often used to identify routing problems and unreachable destinations. All the remote IP addresses and their response times are displayed indicating possible network congestion points. - Page 57 Go back to TOC UX400_Platform_Manual_RevB00 Page 57 of 83...
-
Page 58: Net Wiz
7.2 Net Wiz Net Wiz verifies the status of each IP address in the user selected range, by using ARP (Address Resolution Protocol) and ICMP test. 7.2.1 Net Wiz Setup Profile: Drop-down selections are Default, Delete, Save, Save As... Begin IP: Set the start address for the desired IP range using the numeric keypad End IP: Set the end address for the desired IP range using the numeric keypad Select the test by placing a check mark in the corresponding box of any of the following: ARP, Ping Net Wiz Setup... - Page 59 Global reports: Total number of devices found Number of devices (Routers, Servers, Hosts) Net Wiz Results - Devices - Global Detail displays the Attribute, MAC and IP Addresses, and Ping test results of each device discovered. Net Wiz Results - Devices - Detail Go back to TOC UX400_Platform_Manual_RevB00 Page 59 of 83...
-
Page 60: Wifi Wiz
Plug the WiFi adaptor into the USB port. Allow at least 30-45 seconds for the unit to detect the wireless adaptor and for the software driver to load. Products support USB wireless adaptors supplied by VeEX only and have the necessary software driver built into the test set. - Page 61 AP List The following information is displayed for each AP: SSID name of the AP BSSID (MAC address) of the AP 802.11 protocol version supported by the AP Max data rate supported by the AP AP's radio channel number Lock symbol indicates if security is set on the AP (WEP, WPA or WPA2). When the AP is unsecured, no lock symbol is displayed Signal strength of the AP Select one of the Access Points (AP) to start a connection.
- Page 62 WiFi Wiz Connection Setup Status The Status Tab displays the following information on the connection: Connection Status ESSiD: Name connected to BSSiD: MAC address of wireless router/device connected to Channel: WiFi Channel # connected to Encryption: Encryption type Mode Signal: Radio signal level (dBm) Link quality score Max data rate...
- Page 63 WiFi Wiz Connect IP Go back to top Go back to TOC UX400_Platform_Manual_RevB00 Page 63 of 83...
-
Page 64: Advanced Tools
Cracks are not permitted in neither core nor cladding Equipped with 400x magnification, the VeEX Fiber Scope Inspector is well suited for general installation and maintenance checks on both single mode and multi mode fiber types. Contamination or damage that cannot be viewed at this magnification is unlikely to impact practical connector performance;... - Page 65 Instead of adding the extra complexity, fragility, cost, size and weight of other electromechanical focusing systems currently available in the market, VeEX’s auto focus detection technology still relies on the incredible fast response and finesse of human hands, but leave the focus assessment, image capturing and analysis to the test set.
- Page 66 example Fiber0239- Starting #: Every time a result is saved, this suffix number will automatically increment. Users can manually enter the initial value here. Auto Freeze: This is amount of time the optional Auto Focus Detection feature will look for a stable in-focus image before automatically freezing the image and starting an analysis.
- Page 67 MMF/SMF: Selects the type of connector/fiber to be analyzed and loads the correct Pass/Fail mask. Please note that the label in the button DOES NOT indicate the current mask type. It indicates that the mask would be changed to if activated. Shake ON/OFF: Turning the Shake ON may help in situations when the image is not very stable, such as inspecting a female connector or bulkhead.
- Page 68 Analyze: This soft button opens a more detailed analysis and report generation. Use the check boxes to select the images to be analyzed Image File: Shows the name of the picture currently being displayed. Use the Open button to navigate, select and load any other file.
- Page 69 Results Table: Shows the defects and scratches count by sizes and position, used for the evaluation of the Pass/Fail criteria, according to the IEC 61300-3-35 standard. UX400_Platform_Manual_RevB00 Page 69 of 83...
-
Page 70: Optical Power Meter
7.4.2 Optical Power Meter (OPM) This function works in conjunction with Optical Power Meter dongles (USB), such the optional UPM-100. Insert the OPM dongle to on of the test set’s USB port before launching this application. Optical Power and Loss Measurements Wavelength: This pull-down menu provides a list of calibrated wavelengths to match the signal being measured. -
Page 71: Wifi Spectrum Analyzer
Loss Limits: Similar to power limits, user can set Minimum and Maximum amounts of optical power loss that are acceptable for the application or specified for the cable or installation. User can simply specify the total amount of attenuation in dB. Alternatively, user can select the dB/km or dB/mi if the results are being compared against cable specifications. - Page 72 WiFi SA Display Summary WiFi Analyzer USB dongle Display Summary Planar view: Reports current, average, and maximum signal amplitude for each wireless frequency Topographic view: Emphasizes which frequencies are the busiest across the entire spectrum Spectral view: Historical view of wireless spectrum use at a point in time WiFi SA - Planar View Planar View Traditional Spectrum Analyzer view with Max, Average, and Current results...
- Page 73 WiFi SA - Topographic View Topographic View Similar to a density map - plots frequency versus amplitude Uses a special color scheme to assign colors to frequency amplitude points and to identify how often a particular coordinate is recorded Great resource for identifying devices with very low duty cycles Leaving it running will give a good indication of the typical local network conditions WiFi SA - Spectral View Spectral View...
- Page 74 WiFi SA - Signatures Signatures The Signatures button presets are available to identify unknown sources of RF activity (e.g., microwave oven) Select a device in the sidebar and click the pattern in the Topographic view to identify a device WiFi SA - Inspector Inspector The Inspector button setup allows the user to measure the frequency of the RF activity or interference of interest When selected, a prompt and result box appears...
-
Page 75: Data Card
To establish an IP connection using a data card, please make sure that the data card is connected on the USB port. Note that only datacards provided by VeEX are supported and have the driver necessary for connection. The Data Card icon, as shown below, will appear at the bottom of the screen. - Page 76 Data Card - Setup 1. Press the Dial Up key 2. In the IP Tools Setup menu, the Port will be displayed as "Datacard Port." The D for Data icon in the bar on the lower end of the screen will have a red cross to show that datacard is not connected - Select the configuration parameters, then press Connect.
-
Page 77: Wifi Inssider
When the AP is unsecured, no lock symbol is displayed Signal strength of the AP Access Points in the 5.0GHZ spectrum can only be displayed if the VeEX USB Wifi adapter supports 802.11a/n or 802.11 a/n/ac. Refer to the USB Wifi adapter specifications. - Page 78 5GH bands and the strength of the strongest AP's signal for each channel. 2.4GHZ Channel 5GHZ Channel 4. Tap the Graph tab of the respective Channel to view the results in a graphical presentation. Graph Use the Right/Left/Up/Down function keys or the arrow keys on the unit's keypad to navigate the graph and get additional information for the access points.
- Page 79 AP's radio Channel number Signal strength (dBm) Number of co-channel: Number of APs using the same radio channel Number of Overlapping APs: Number of APs using channels whose frequency band overlaps with the AP. Go back to top Go back to TOC UX400_Platform_Manual_RevB00 Page 79 of 83...
-
Page 80: Vfl
7.5 VFL Use the Visual Fault Locator (VFL) tool to check end-to-end continuity. Use this visible red light to trace the fiber to instantly identify fiber strands, connectors, breaks, bends and other potential problems or anomalies on events. Continuous Option To turn on the VFL continually to check for faults, select On. -
Page 81: Warranty And Software
Replace hardware which proves to be defective provided that the products that the customer elects to replace is returned to VeEX Inc. by the customer along with proof of purchase within thirty (30) days of the request by the customer, freight prepaid. -
Page 82: Certification And Declarations
All applicable products imported into the EU market after July 1, 2006 must pass RoHS compliance. For more information about RoHS as it relates to VeEX Inc, go to the VeEX web site at www.veexinc.com/RoHS. -
Page 83: About Veex
With a blend of advanced technologies and vast technical expertise, VeEX’s products diligently address all stages of network deployment, maintenance, field service turn-up, and integrate service verification features across DSL, Fiber Optics, CATV/DOCSIS, Mobile backhaul and fronthaul (CPRI/OBSAI), next generation Transport Network, Fibre Channel, Carrier &...
Need help?
Do you have a question about the UX400 and is the answer not in the manual?
Questions and answers