Table of Contents
Advertisement
Quick Links
Advertisement
Table of Contents

Related Manuals for VeEX RXT-6200


Summary of Contents for VeEX RXT-6200
-
Page 2: Table Of Contents
Table of Contents 1.0 About This User Manual 2.0 Safety Information 3.0 Introduction to RXT-6200 4.0 Basic Operations 5.0 Utilities 6.0 Setup: SDH/SONET/OTN 6.1 Signal Overview 6.2 Setup: SDH 6.2.1 Transmitter Setup 6.2.2 Receiver Setup 6.3 Setup: SONET 6.3.1 Transmitter Setup 6.3.2 Receiver Setup... - Page 3 7.1.1 Summary 7.1.2 Errors and Alarms 7.1.3 Event Log 7.1.4 Signal 7.1.5 Histogram 7.1.6 Graph 7.1.7 Performance Analysis 7.2 Results: SONET 7.2.1 Summary 7.2.2 Errors and Alarms 7.2.3 Event Log 7.2.4 Signal 7.2.5 Histogram 7.2.6 Graph 7.2.7 Performance Analysis 7.3 Results: OTN 7.3.1 Summary 7.3.2 Errors and Alarms 8.0 SDH/PDH Alarms...
- Page 4 9.2.1 OTN Frame Analysis 9.2.2 Optical Transport Unit (OTU) Analysis 9.2.3 Optical Data Unit (ODU) Analysis 9.2.4 Optical Payload Unit (OPU) Analysis 9.3 Payload Label 9.4 Trace Identifier 9.5 TCM Tasks 10.0 SDH/SONET Tools 10.1 SDH/SONET Tools 10.1.1 Shortcuts 10.1.2 Overhead Analyzer 10.1.3 Overhead Generator 10.1.4 Pointer Tasks 10.1.4.1 Pointer Analysis...
- Page 5 10.2.2 Overhead Analyzer 10.2.3 Overhead Generator 10.2.4 Pointer Tasks 10.2.4.1 Pointer Analysis 10.2.4.2 Point Generator 10.2.4.3 Pointer Sequences 10.2.5 Trace Identifier 10.2.5.1 Transmitted Traces (TX) 10.2.5.2 Received Traces (RX) 10.2.6 Payload Labels 10.2.7 APS Tasks 10.2.7.1 APS Timing 10.2.7.2 APS Sequence 10.2.8 Tandem Connection Monitoring (TCM) 10.2.9 Tributary Scan 10.2.10 Round Trip Delay...
- Page 6 12.3.1 Signal Setup 12.3.1.1 Hierarchy 12.3.1.2 Interface 12.3.1.3 Pattern 12.3.2 Measurements 12.3.3 General 12.4 OTN Results 12.4.1 Summary 12.4.2 Errors/Alarms 12.4.3 Event Log 12.4.4 Signal 12.5 OTU-Xe Ethernet Applications 12.5.1 OTU-Xe with 10GE BERT 12.5.2 OTN/10GE RFC 2544 Conformance Testing 12.5.3 OTN/10GE Throughput Testing (Multiple Streams) 13.0 Ethernet 13.1 Ethernet Setup...
- Page 7 13.2.2.3 Events 13.2.2.4 Traffic 13.2.2.5 Rates 13.2.2.6 Delay 13.2.2.7 Alarms 13.2.2.8 Signal 13.3 RFC 2544 Conformance Testing 13.3.1 Setup - Standard Mode 13.3.1.1 Header Settings 13.3.1.2 Frame Settings 13.3.1.3 Threshold Settings 13.3.1.4 Peer-to-Peer Asymmetric Testing 13.3.1.5 Throughput, Latency, Frame Loss, and Burst Settings 13.3.1.6 Starting/Stopping a RFC 2544 Measurement 13.3.2 Results - Standard Mode...
- Page 8 13.5.1.4Traffic Settings (Per Stream Configuration) 13.5.1.5 Error Injection Settings per Stream 13.5.1.6 Alarm Injection Settings 13.5.1.7 Summary 13.5.1.8 Starting/Stopping a Throughput (Multiple Streams) Test 13.5.2 Throughput Results 13.5.2.1 Viewing Throughput (Multiple Streams) Test Results 13.5.2.2 Global/Aggregate Results 13.5.2.3 Per Stream Results 13.5.2.4 Saving Throughput (Multiple Streams) Results 13.6 Ethernet OAM Testing 13.6.1 OAM Setup...
- Page 9 16.3.4 SDT 16.3.5 Control Words 17.0 eCPRI 17.1 eCPRI Testing Overview 17.2 Interface Specifications 17.2.1 Protocol Stack 17.2.2 eCPRI Key Features 17.2.3 eCPRI Data Framing 17.2.4 eCPRI One Way Latency Measurement 17.3 eCPRI Setup 17.3.1 Test Port Selection 17.3.2 Port Setup 17.3.3 Measurement Settings 17.3.4 eCPRI Tests 17.4 Throughput Testing...
- Page 10 17.5.1 Packet Capure Setup 17.5.2 Packet Capure Results 18.0 Profiles 19.0 Common Functions 20.0 Warranty and Software 21.0 Product Specifications 22.0 Certifications and Declarations 23.0 About VeEX Go back to top RXT-6200_RXT6000e_Module_Manual Page 10 of 387...
-
Page 11: About This User Manual
VeEX Inc. The software is protected by copyright and contains trade secrets of VeEX Inc. or VeEX's licensors. The purchaser of this device agrees that it has received a license solely to use the software as embedded in the device, and the purchaser is prohibited from copying, reverse engineering, decompiling, or disassembling the software. -
Page 12: Safety Information
Do not operate the instrument in the presence of flammable gases or fumes or any other combustible environment. VeEX Inc. assumes no liability for the customer's failure to comply with safety precautions and requirements. - Page 13 Always charge the unit's battery pack inside the test platform battery bay using the AC/DC adapter supplied by VeEX. Do not charge or use the battery pack if any mechanical damage is suspected (shock, impact, puncture, crack, etc). Do not continue charging the battery if it does not recharge within the expected charging time Storage: For long term storage, the battery pack should be stored at 20°C/68°F (room temperature), charged to...
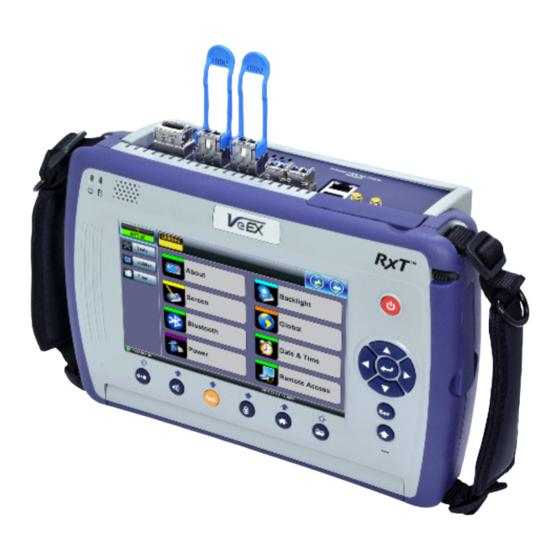
- Page 14 3.0 Introduction The RXT-6200 and RXT-6000e test module is equipped with most common transceiver form-factor ports and optional legacy test interfaces. It offers up to two simultaneous 100GE tests. Installation, commissioning, monitoring, and maintenance tasks are simplified thanks to a combination intuitive features and powerful test functions.
- Page 15 3.1 Connector Panels & Test Ports RXT-1200 with RXT-6200 blade RXT-1200 with RXT-6000e blade Go back to top Go back to TOC RXT-6200_RXT6000e_Module_Manual Page 15 of 387...
-
Page 16: Basic Operations
4.0 Basic Operations For information on Basic Operations, Home menu, Launching Test Applications, and other features specific to the RXT-6200 and RXT-6000e Host Chassis, refer to the RXT-1200 Platform Manual. Go back to top Go back to TOC RXT-6200_RXT6000e_Module_Manual Page 16 of 387... -
Page 17: Utilities
5.0 Utilities Refer to the RXT Platform Manual for information about all Utilities and Tools available. Go back to top Go back to TOC RXT-6200_RXT6000e_Module_Manual Page 17 of 387... -
Page 18: Setup: Sdh/Sonet/Otn
6.0 Setup: SDH/SONET/OTN Accessing Setup: Please see the RXT-1200 Platform manual Getting Started section to launch Test Applications. SONET Home Menu The Setup page has tabs for setting the OTN, and SDH/SONET. Go back to top Go back to TOC 6.1 Signal Overview Tap on the Signal tab to set up the Transmitter and Receiver interfaces and associated test parameters prior to running a test. - Page 19 window displaying additional input and specific selection settings. The Transmitter transmits as soon as a valid configuration is entered. The Receiver will check for a valid signal on its input so the measurement function is synchronized. When a test is not running, the LEDs will still indicate errors and alarms, but any other results displayed will be the results of a previous test.
- Page 20 associated framing. Pattern: Applies to SDH/SONET signals and allows the user to configure the test pattern to be used. Use the pattern drop-down box to select the test pattern which will be inserted into the transmitted signal. Pseudo Random Bit Sequences (PRBS) defined by ITU-T 0.150 and 0.151 standards, fixed words and 24-bit or 32 bit user defined patterns are available.
-
Page 21: Setup: Sdh
6.2 Setup: SDH Selecting SDH from the General tab To display SDH options for the TX and RX block configuration, tap on the General tab from the Setup screen and select SDH from the SDH/SONET drop-down menu. Go back to top Go back to TOC 6.2.1 Transmitter Setup This section of the manual describes the SDH configuration capabilities. - Page 22 9.953G respectively). Go back to top Go back to TOC Tx Hierarchy - Normal Operating Mode Operating Mode: Normal, Payload, or Transparent Normal Mode: Unit working as normal SDH mode. Payload Through Mode: Overhead overwrite Editing Thru mode allows for some intrusive error and alarm injection through overhead manipulation.
- Page 23 Test Port: Optical Optical interface is available for STM-0, STM-1, STM-4, STM-16 and STM-64 signals. Clock Source: Can be configured as follows: Internal clock: The clock for the transmitter is derived from the internal clock. The internal clock has an accuracy of +/- 3.5ppm conforming to G.812 recommendations.
- Page 24 Tx Structure Setup - Graphical Mode AU4 Mapping: VC4-64C, VC4-16C, VC4-4C, VC4, VC3, and VC12 are available. AU3 Mapping: VC3,VC12, and TU11/VC11 are available. Bulk: Tap the check box to enable the setting. In bulk mode, the entire VT container is filled with a test pattern per ITU-T 0.181 recommendations.
- Page 25 TUG: A Tributary Unit Group is the structure generated by combining several lower level tributaries into the next higher level tributary TU-12: Each TU-12 frame consists of 36 bytes, structured as 4 columns of 9 bytes At a frame rate of 8000Hz, these bytes provide a transport capacity of 2.304Mbps and accommodate the mapping of a 2.048Mbps signal 63 x TU-12s may be multiplexed into a STM-1 VC-4 The tributary numbering used above is per ITU-T G.707 standard.
- Page 26 1.544M: Configures the transmitter for full rate testing at 1.544Mbps Fractional DS1 (Nx64 or Nx56): Configures the transmitter for fractional testing using N or M 64kbps timeslots (contiguous or non-contiguous timeslots) In VC3 mapping mode/Tributary set to DS3, the Low Rate options are 45M, 1.544M Mux (DS3/DS1 Mux), or Fractional DS1 (Nx64 or Nx56) Mux where: 45M: Configures the transmitter for full rate testing at 45Mbps 1.544M Mux mode: Configures the transmitter for full rate testing at 45Mbps signal with DS1 payloads (1 to 28...
-
Page 27: Receiver Setup
Tx Pattern Setup PRBS Pattern: Use the pattern drop-down box to select the test pattern which will be inserted into the transmitted signal. Pseudo Random Bit Sequences (PRBS) defined by ITU-T 0.150 and 0.151 standards, fixed words and 24-bit or 32 bit user defined patterns are available. - Page 28 Interface Tapping the Interface setup box opens the Rx Interface screen. The Interface setup options for the Rx are the same as for the Tx described previously, except for clock offset, which is only available in Tx. Remember to use an optical attenuator to prevent receiver overload or damage – refer to the SFP chart below to determine safe levels.
- Page 29 Rx Payload Setup Go back to top Go back to TOC Pattern Tapping the Pattern box opens the Rx Pattern setup screen. The pattern setup options for the Rx are the same as for the Tx described previously, except for the Out of Service selection, which should be selected if the incoming signal is expected to contain a known test pattern.
-
Page 30: Setup: Sonet
6.3 Setup: SONET Selecting SONET from the General tab To display SONET options for the TX and RX block configuration, tap on the General tab from the Setup screen and select SONET from the SDH/SONET drop-down menu. Go back to top Go back to TOC 6.3.1 Transmitter Setup This section of the manual describes the SONET configuration capabilities. - Page 31 respectively). Go back to top Go back to TOC Hierarchy > Through Mode Tapping the Hierarchy box opens the Tx Hierarchy Setup screen. Tx Hierarchy Setup - Through Mode Through Mode: Normal Mode: Unit working as normal SONET mode. Payload Through Mode: Overhead overwrite Editing Thru mode allows for some intrusive error and alarm injection through overhead manipulation.
- Page 32 Tx Interface Setup Test Port: Optical Optical interface is available for OC-1, OC-3, OC-12, OC-48 and OC-192 signals. Clock Source: Can be configured as follows. Internal clock: The clock for the transmitter is derived from the internal clock. The internal clock has an accuracy of +/- 3.5ppm conforming to G.812 recommendations.
- Page 33 Tx Structure Setup - Text Mode Mapping: STS-192C, STS-48C, STS-12C, STS-3C, STS-1 and VT1.5 is available. VT-2 is optional. STS mappings per Bellcore GR-253 and ANSI T1.105 recommendations are supported. The multiplexing structure is shown below. Tx Structure Setup - Graphical Mode RXT-6200_RXT6000e_Module_Manual Page 33 of 387...
- Page 34 Channel Selection: The Tx channel is selected by entering the STS-N, VT-GRP, and VT-1.5 SPE channel. Bulk: Tap the check box to enable the setting. In Bulk mode, the entire VT container is filled with a test pattern per ITU-T 0.181 recommendations. Tributary: Preset to DS1, E1, DS3, and E3 depending upon the options and mapping.
- Page 35 Payload Tapping the Tx Payload box opens the Tx Payload Setup screen. Tx Payload Setup Rate: Depends on mapping selected: In VT-1.5 mapping mode, The Low Rate options are 1.544M or Fractional DS1 (Nx64 or Nx56) where: 1.544M: Configures the transmitter for full rate testing at 1.544Mbps Fractional DS1 (Nx64 or Nx56): Configures the transmitter for fractional testing using N or M 64kbps timeslots (contiguous or non-contiguous timeslots) In STS-1 mapping mode/Tributary set to DS3, the Low Rate option are 45M or 1.544M Mux (DS3/DS1 Mux) or...
-
Page 36: Receiver Setup
In DS1 mode, the options are unframed, D4 (SF) and ANSI T1.107 (ESF). In DS3 mode, the options are unframed, M13 and C-Parity. In E1 mode, the options are unframed, PCM31, PCM31C, PCM30, and PCM30C. Framing conforms to G.704 and G.706 recommendations and are briefly described below. - Page 37 Go back to top Go back to TOC Interface Tapping the Interface setup box opens the Rx Interface screen. The Interface setup options for the Rx are the same as for the Tx described previously, except for clock offset, which is not possible. Interface Rx Setup Remember to use an optical attenuator to prevent receiver overload or damage –...
- Page 38 Structure Tapping the Structure setup box opens the Rx Structure screen. The Structure setup options for the Rx are the same as for the Tx described previously. Rx Structure Setup - Graphical Mode Go back to top Go back to TOC Payload Tapping the Payload setup box opens the Rx Payload screen.
- Page 39 Rx Pattern Setup Go back to top Go back to TOC RXT-6200_RXT6000e_Module_Manual Page 39 of 387...
-
Page 40: Setup: Otn/Sdh
6.4 Setup: OTN/SDH Selecting SDH from the General tab To verify that the Tx and Rx block diagrams are OTN/SDH, verify that SDH is selected from the SDH/SONET drop- down menu under the General tab. Go back to top Go back to TOC 6.4.1 OTN Transmitter Setup This section of the manual describes the OTN configuration capabilities. -
Page 41: Transmitter Setup
OTN Mapping: SYNC, ASYNC, and PRBS pattern ITU-T G.709 and both AU-4 and AU-3 signal mappings per G.707 recommendations are supported. The multiplexing structure is shown below. Scrambler: ON/OFF FEC: FEC encoder can be ON/OFF (activated / deactivated) Go back to top Go back to TOC Interface, Structure, Payload, and Pattern Interface, Structure, Payload, and Pattern TX block configurations are identical to configurations in Transmitter Setup... - Page 42 Tx Interface Setup Tx Structure Setup - Graphical Mode Tx Payload Setup RXT-6200_RXT6000e_Module_Manual Page 42 of 387...
-
Page 43: Receiver Setup
Tx Pattern Setup Go back to top Go back to TOC 6.4.2 Receiver Setup Hierarchy Tapping the Hierarchy setup box opens the Rx Hierarchy screen. The Hierarchy setup options for the Rx are the same as for the Tx described previously. Rx Hierarchy Setup Go back to top Go back to TOC Interface... - Page 44 Rx Interface Go back to top Go back to TOC Structure and Payload OTN/SDH Rx Structure and Payload configurations are the same as for OTN/SDH Tx setup described previously. Rx Structure RXT-6200_RXT6000e_Module_Manual Page 44 of 387...
- Page 45 Rx Payload Go back to top Go back to TOC Pattern Tapping the Pattern box opens the Rx Pattern setup screen. The Pattern setup options for the Rx are the same as for the Tx described previously, except for the Out of Service selection, which should be selected if the incoming signal is expected to contain a known test pattern.
-
Page 46: Setup: Otn/Sonet
6.5 Setup: OTN/SONET Selecting SONET from the General tab To verify that the Tx and Rx block diagrams are OTN/SONET, verify that SONET is selected from the SDH/SONET drop-down menu under the General tab. Go back to top Go back to TOC 6.5.1 Transmitter Setup This section of the manual describes the OTN configuration capabilities. - Page 47 Network Type: In the OTN mode, only optical interface options are available Test Rate: Options are OTU-1 and OTU-2 (referring to 2.66G and 10.709G respectively) OTN Mapping: SYNC, ASYNC, and PRBS pattern ITU-T G.709 and STS mappings per Bellcore GR-253 and ANSI T1.105 recommendations are supported. The multiplexing structure is shown below.
- Page 48 Tx Interface Setup Tx Structure Setup - Text Mode RXT-6200_RXT6000e_Module_Manual Page 48 of 387...
- Page 49 Tx Structure Setup - Graphical Mode Tx Payload Setup Tx Pattern Setup RXT-6200_RXT6000e_Module_Manual Page 49 of 387...
-
Page 50: Receiver Setup
Go back to top Go back to TOC 6.5.2 Receiver Setup Hierarchy Tapping the Hierarchy setup box opens the Rx Hierarchy screen. The Hierarchy setup options for the Rx are the same as for the Tx described previously. Rx Hierarchy Setup Go back to top Go back to TOC Interface Tapping the Interface setup box opens the Rx Interface screen. - Page 51 Rx Interface Go back to top Go back to TOC Structure and Payload OTN/SONET Rx Structure and Payload configurations are the same as for OTN/SONET Tx setup described previously. Rx Structure RXT-6200_RXT6000e_Module_Manual Page 51 of 387...
- Page 52 Rx Payload Go back to top Go back to TOC Pattern Tapping the Pattern box opens the Rx Pattern setup screen. The Pattern setup options for the Rx are the same as for the Tx described previously, except for the Out of Service selection, which should be selected if the incoming signal is expected to contain a known test pattern.
-
Page 53: Measurement Configuration
6.6 Measurement Configuration Tapping the Measurements tab opens the setup screen for the Timer, Performance Analysis, and General configurations. Measurements tab Go back to top Go back to TOC 6.6.1 Timer Setup Configure a test to run for a fixed duration or a delayed start. Mode: Manual, Timed, and Auto selections are available Manual: This is linked to the Start/Stop function on the drop-down menu Timed: The test duration can be set by the user. - Page 54 Analysis The recommendations are briefly defined as follows: G.821: Error performance of an international digital connection operating at a bit rate below the primary rate and forming part of an Integrated Service Digital Network (ISDN) Long term error performance conducted Out of Service (OOS) Based on measuring bit errors Evaluation period of 30 days Since there is no overhead structure at these bit rates, in-service measurements are extremely difficult...
-
Page 55: General
First step is a continuity test for 15 minutes Only one performance analysis can be performed at a time. To view or enable the M.2100 and M.2101 analyses, the measurement timer has to be set to a determined period. The table below describes the anomalies evaluated for the performance analysis selected. -
Page 56: Auto-Config
available when Rx is optical and Tx is in PDH mode, (i.e. a Mux). Go back to top Go back to TOC 6.6.4 Auto-Config The Auto-Configuration function is described below. Auto-config tab The Auto-Config function automatically sets the receiver of the test set. A search for SDH and PDH signals at both the electrical or optical inputs is performed to determine the signal structure. - Page 57 7.0 Results Accessing Results To access measurements for SDH, SONET, and OTN, tap on Start, which starts testing, or Results. Results and Start Buttons Go back to top Go back to TOC RXT-6200_RXT6000e_Module_Manual Page 57 of 387...
-
Page 58: Results: Sdh
7.1 Results: SDH 7.1.1 Summary The Summary tab displays a summary of test results and parameters. At a glance, the user is able to see if there are any alarms, errors, or signal failure pertaining to the SDH signal and its payload. Summary (Page 1) SDH mapping information is displayed on page 2 and 3. - Page 59 Summary (Page 3) Go back to top Go back to TOC 7.1.2 Errors and Alarms The Errors/Alarms tab brings up several pages showing the errors and alarms status. Page 1 provides an overview of all the Errors and Alarms applicable to the signal or network under test. The color of the page tab is normally blue;...
- Page 60 The LED headers are described in the table below: SDH Error and Alarm defection criteria per ITU-T G.707 and O.150 recommendations: SDH Error and Alarm defection criteria per ITU-T G.707 and O.150 recommendations: RXT-6200_RXT6000e_Module_Manual Page 60 of 387...
- Page 61 RXT-6200_RXT6000e_Module_Manual Page 61 of 387...
- Page 62 Go back to top Go back to TOC Errors/Alarms (Page 2) Page 2 lists the SDH Errors in logical order that are associated with the signal under test. All errors are evaluated and stored. The Elapsed Time [ET] is shown in the right hand corner of the header. Error conditions are displayed in red including count and rate.
-
Page 63: Errors And Alarms
Errors/Alarms (Page 3) Page 3 lists the Section and Line Overhead Alarms in logical order associated with the signal under test. All alarms are evaluated and stored. The Elapsed Time [ET] since the start of the test is shown in the upper right hand corner. The alarms associated with the Section and Line are displayed separately for ease of interpretation. - Page 64 Errors/Alarms (Page 5) Go back to top Go back to TOC Errors/Alarms (Page 6) Page 6 lists the PDH Alarms in logical order that are associated with the signal and payload under test. All alarms are evaluated and stored. Errors/Alarms (Page 6) Go back to top Go back to TOC Errors/Alarms (Page 7) Page 7 lists the PDH Errors in logical order that are associated with the signal and payload under test.
-
Page 65: Event Log
Errors/Alarms (Page 7) Errors/Alarms (Page 8) Page 8 lists the BERT Errors in logical order that are associated with the signal and payload under test. All errors are evaluated and stored. Errors/Alarms (Page 8) Go back to top Go back to TOC 7.1.3 Event Log The Event Log tab brings up the screen listing the Error and Alarm events recorded during a test. -
Page 66: Signal
Event Log Go back to top Go back to TOC 7.1.4 Signal The signal tab displays the Level and Frequency screen. Page 1 displays the level measurement in electrical units (volts) for STM-1, STM-4, STM-16 and STM-64 signals. Loss of Signal (LOS) and the Saturation level for optical signals is shown graphically including the level measurement in dBm. - Page 67 Signal - Frequency (Page 2) Frequency: The received signal frequency and offset is measured and displayed. SDH Current: Indicates the frequency of the input signal. Offset: Indicates the difference between the standard rate and the rate of the input signal. Min (ppm): Indicates the difference between the standard rate and the minimum deviation detected in the input signal.
-
Page 68: Histogram
Signal - Optical (Page 3) Signal > Optical Information (Page 4) Page 4 displays the Optical module Power Measurement Graph. Signal - Optical (Page 4) Go back to top Go back to TOC 7.1.5 Histogram The Histogram tab displays the screen showing a historical record of the Alarms and Errors recorded during the measurement interval. - Page 69 Histogram - SOH Alarms (Page 1) The alarms and errors presented depend on the signal type and structure selected. A graphical timeline on the horizontal axis indicates when the event occurred. The upper left and right arrows allow the user to scroll through the measurement period while the + and –...
- Page 70 Histogram - AU Alarms/Errors (Page 3) Go back to top Go back to TOC Histogram (Page 4) Page 4 displays the Alarms and Errors associated with the High Order Path (HP, SDH). The measured parameters are: HP-UNE (HP-Unequipped) HP-PLM (HP-Payload Mismatch) HP-TIM (HP-Trace Identifier Mismatch) HP-RDI (HP-Remote Defect Indication) B3 errors...
- Page 71 TU-LOP (TU-Loss of Pointer) Histogram - TU Alarms/Errors (Page 5) Go back to top Go back to TOC Histogram Page 6 displays the Alarms and Errors associated with the Low Order Path (LP,SDH). The measured parameters are: LP-UNE (LP-Unequipped) LP-PLM (LP-Payload Mismatch) LP-TIM (LP-Trace Identifier Mismatch) LP-RDI (LP-Remote Defect Indication) LP-RFI (LP-Remote Fault Indication)
- Page 72 Histogram (Page 7) Page 7 displays the Alarms associated with the payload. The measured parameters depend on the payload selected. Histogram - E1 Alarms (Page 7) Go back to top Go back to TOC Histogram (Page 8) Page 8 displays the Errors associated with the test pattern. Histogram - BERT Alarms/Errors (Page 8) Go back to top Go back to TOC 7.1.6 Graph...
-
Page 73: Graph
MS-REI HP-REI LP-BIP LP-REI PDH errors depending on payload Scroll through the various pages to display the anomaly of interest. A status pop-up screen can be accessed by tapping on the graph area. Graph (Page 3) Go back to top Go back to TOC 7.1.7 Performance Analysis G.821 Analysis The Analysis tab displays measured objectives from ITU-T performance tests selected from the Measurements tab... - Page 74 expanded to include higher bit rates. ES, SES, AS and UAS are evaluated and can be performed on the following events: FAS bit errors (FAS 2, FAS 34) CRC errors E bit errors Bit errors (TSE, Test Sequence Error) The following signals can be measured when performing G.821 evaluation of bit errors (TSE): Unframed patterns N x 64kbps Framed patterns and bulk signals...
- Page 75 Go back to top Go back to TOC Evaluation According to ITU-T G.828 G.828 provides a precise block length for each bit rate as opposed to G.826. ES, SES, BBE, UAS and SEP are evaluated. Pass/Fail result is in conjunction with path allocation between 0.1 and 100%. G.828 evaluation can be performed on the following events: MS-REI HP-REI...
- Page 76 Evaluation According to ITU-T M.2100 M.2100 applies to commissioning and maintenance. Commissioning consists of a 15-minute line up phase followed by a 24-hour in-service measurement. Once the line up phase is completed successfully, errors may occur within certain limits. ES, SES and UAS are evaluated. Pass/Fail results are based on threshold values S1 and S2 for ES and SES.
- Page 77 Evaluation of the near end and far-end is possible but far-end evaluations can only be made if REI is available. Bit errors can be evaluated for: Unframed patterns Framed patterns and bulk signals Overhead bytes E1/E2 (order wire), F1/F2 (user), D1 - D3 and D4 - D12 (DCC) in the SDH Overhead (SOH and POH) M.2101 measures block errors, therefore bit error evaluation is disabled.
-
Page 78: Results: Sonet
7.2 Results: SONET 7.2.1 Summary The Summary tab displays a summary of test results and parameters. At a glance, the user is able to see if there are any alarms, errors, or signal failure pertaining to the SONET signal and its payload. Summary (Page 1) SONET mapping information is displayed on page 2 and 3. - Page 79 Summary (Page 3) 7.2.2 Errors/Alarms The Errors/Alarms tab brings up several pages showing error and alarm statuses. Page 1 provides an overview of all the Errors and Alarms applicable to the signal or network under test. The color of the page tab is normally blue; however, it will turn red when an alarm error condition has been detected or recorded. The soft LEDs on screen are arranged logically and will depend on signal hierarchy, structure, payload, and framing selected.
- Page 80 SONET Error and Alarm definitions per Bellcore GR.253 and ANSI T1.105 recommendations: SONET Error and Alarm defection criteria per Bellcore GR.253 and ANSI T1.105/231: RXT-6200_RXT6000e_Module_Manual Page 80 of 387...
- Page 81 Go back to top Go back to TOC Errors/Alarms (Page 2) Page 2 lists the SONET Errors in logical order that are associated with the signal under test. All errors are evaluated RXT-6200_RXT6000e_Module_Manual Page 81 of 387...
- Page 82 and stored. The Elapsed Time [ET] is shown in the right hand corner of the header. Error conditions are displayed in red including count and rate. Errors/Alarms (Page 2) Go back to top Go back to TOC Errors/Alarms (Page 3) Page 3 lists the Section and Line Overhead Alarms in logical order associated with the signal under test.
- Page 83 Errors/Alarms (Page 4) Errors/Alarms (Page 5) Go back to top Go back to TOC Errors/Alarms (Page 6) Page 6 lists the PDH/DSn Alarms in logical order that are associated with the signal and payload under test. All alarms are evaluated and stored. RXT-6200_RXT6000e_Module_Manual Page 83 of 387...
- Page 84 Errors/Alarms (Page 6) Go back to top Go back to TOC Errors/Alarms (Page 7) Page 7 lists the PDH/DSn Errors in logical order that are associated with the signal and payload under test. All errors are evaluated and stored. Errors/Alarms (Page 7) Errors/Alarms (Page 8) Page 8 lists the BERT Errors in logical order that are associated with the signal and payload under test.
-
Page 85: Event Log
Errors/Alarms (Page 8) Go back to top Go back to TOC 7.2.3 Event Log The Event log tab brings up the screen listing the Error and Alarm events recorded during a test. The events are presented in chronological sequence - number, type of event, start time and duration and duration (alarms) and ratio/count (errors) are displayed. - Page 86 Signal (Page 1) Go back to top Go back to TOC Signal > Frequency (Page 2) The received signal frequency and offset is measured and displayed. For SONET signals, the measurement is performed on both electrical (BNC) and optical interfaces. Frequency (Page 2) Frequency: The received signal frequency and offset is measured and displayed.
- Page 87 Low quality clock sources that deviate from the nominal value cause problems in the operation of network elements. It is necessary and recommended to measure the signal frequency at all hierarchies to reduce synchronization risks. To measure line frequency in service, the test set must be connected to a Protected Monitoring Point (PMP). The frequency of the signal is normally reported in Hz, while the deviation is reported in ppm.
-
Page 88: Histogram
Signal > Optical Information (Page 4) Page 4 displays the Optical module Power Measurement Graph. Signal - Optical (Page 4) Go back to top Go back to TOC 7.2.5 Histogram The Histogram tab displays the screen showing a historical record of the Alarms and Errors recorded during the measurement interval. - Page 89 Go back to top Go back to TOC Histogram (Page 2) Page 2 displays the Errors associated with the SONET Errors. Histogram - SONET Errors (Page 2) Go back to top Go back to TOC Histogram (Page 3) Page 3 displays the Alarms and Errors associated with the STS PATH. The measured parameters are: AIS-P, STS Path AIS LOP-P, STS Path LOP Histogram - P Alarms/Errors (Page 3)
- Page 90 UNEQ-P (STS Path-Unequipped) PLM-P (STS Path-Payload Mismatch) TIM-P (STS Path-Trace Identifier Mismatch) RDI-P (STS Path-Remote Defect Indication) B3 errors REI-P (STS Path-Remote Error Indication) Histogram - P Alarms/Errors (Page 4) Go back to top Go back to TOC Histogram (Page 5) Page 5 displays the Alarms and Errors associated with the Virtual Tributary (VT).
- Page 91 Page 6 displays the Alarms and Errors associated with the VT Path. The measured parameters are: UNEQ-V (VT-Unequipped) PLM-V (VT-Payload Mismatch) TIM-V (VT-Trace Identifier Mismatch) RDI-V (VT-Remote Defect Indication) RFI-V (VT-Remote Fault Indication) BIP-V (VT-Bit Interleaved Parity) REI-V (VT-Remote Error Indication) Histogram - VT Alarms/Errors (Page 6) Go back to top Go back to TOC Histogram (Page 7)
-
Page 92: Graph
Page 8 displays the Bit Errors associated with the test pattern. Histogram - BERT Alarms/Errors (Page 8) Go back to top Go back to TOC 7.2.6 Graph The Graph tab brings up the screen displaying a log of the Errors recorded during the measurement interval. A dedicated page is available for each of the following error types: REI-S REI-P... -
Page 93: Performance Analysis
Go back to top Go back to TOC 7.2.7 Performance Analysis G.821 Analysis The Analysis tab displays measured objectives from ITU-T performance tests selected from the Measurements tab (Setup > Measurements). Please see Analysis for information on the Analysis tab and test definitions. For a brief description of supported G-Series and M-Series performance tests as well as setup instructions, please see Performance Analysis. -
Page 94: Results: Otn
7.3 Results: OTN Measurements are accessed by tapping the Results icon in the main menu. The results comprise a range of tabbed pages, similar to the setup pages. 7.3.1 Summary The Summary tab displays a summary page of test results and parameters. At a glance, the user is able to see if there are any alarms, errors or signal failure pertaining to the OTN/SDH signal and its payload. - Page 95 Summary (Page 3) Go back to top Go back to TOC 7.3.2 Errors and Alarms The Error/Alarm tab brings up several pages showing the errors and alarm status. Page 1 provides an overview of all the Errors and Alarms applicable to the signal or network under test. The color of the page tab is normally blue;...
- Page 96 The LED headers are described in the table below: OTN Error and Alarm definitions per ITU-T G.709 recommendations: RXT-6200_RXT6000e_Module_Manual Page 96 of 387...
- Page 97 RXT-6200_RXT6000e_Module_Manual Page 97 of 387...
- Page 98 SDH/PDH alarms are described previously Go back to top Go back to TOC Errors/Alarms (Page 3) Page 3 lists the OTU Errors in logical order that are associated with the signal under test. All errors are evaluated and stored. The Elapsed Time [ET] is shown in the right hand corner of the header. Error conditions are displayed in red RXT-6200_RXT6000e_Module_Manual Page 98 of 387...
-
Page 99: Errors And Alarms
including count and rate. Errors/Alarms (Page 3) Go back to top Go back to TOC Errors/Alarms (Page 4 & 5) Page 4 lists the OTU Alarms in logical order associated with the signal under test. All alarms are evaluated and stored. - Page 100 Errors/Alarms (Page 5) The alarms associated with the Section and Line are displayed separately for ease of interpretation. Go back to top Go back to TOC Errors/Alarms (Page 6 & 7) Page 6 & 7 lists the ODU/OPU errors and alarms in logical order that are associated with the signal under test. All alarms are evaluated and stored.
- Page 101 Errors/Alarms (Page 7) Go back to top Go back to TOC Errors/Alarms (Page 8 to 14) Page 8 to 14 lists the SDH/PDH Alarms in logical order that are associated with the signal and payload under test. All alarms are evaluated and stored. See SDH details in Section 7.1 Signal (Pages 1 to 4)
- Page 102 For OTN signals, the measurement is performed on the optical interfaces (SFP+ for OTU-1 and OTU-2). OTN Current: Indicates the frequency of the input signal Offset (ppm): Indicates the difference between the standard rate and the bit rate of the input signal Min (ppm): Indicates the difference between the standard rate and the minimum deviation detected in the input signal Max (ppm): Indicates the difference between the standard rate and the maximum deviation detected in the...
- Page 103 This is useful for troubleshooting defective XFPs or for monitoring intermittent optical power fluctuations Signal (Page 4) Go back to top Go back to TOC RXT-6200_RXT6000e_Module_Manual Page 103 of 387...
-
Page 104: Sdh/Pdh Alarms
8.0 SDH/PDH Alarms Accessing Alarm Generation and Error Insertion Tap on Home (main menu) >Advanced Mode> Alarm/Error The alarm and error functions are used in conjunction with the drop-down menu which has dedicated buttons for error injection and alarm generation. Alarm and error selections will depend on PDH, SDH, or OTN signal types. Alarm Setup Go back to top Go back to TOC 8.1 Alarm Generation... -
Page 105: Pdh Alarms
8.1.1 PDH Alarms The following PDH and T-Carrier alarms can be generated: E1 signals: LOS, LOF, AIS, RDI E3 signals: LOS, LOF, AIS, RDI E4 signals: LOS, LOF, AIS, RDI DS1 signals: AIS, Yellow, idle, LOS, LOF DS3 signals: LOS, LOF, OOF, AIS, Parity Mode: Static (enable/disable) using drop-down menu function. -
Page 106: Error Insertion
SDH Alarm Type Go back to top Go back to TOC 8.1.3 OTN Alarms The following OTN alarms can be generated: OTU-1/OTU-2: LOS, LOF, OOF, OOM, LOM, AIS, IAE, BDI, TIM ODU-1/OPU-2:AIS, OCI, LCK, BDI, TIM OPU-1/OTU-2: PLM SDH Payload alarms: LOF, MS-AIS, MS-RDI, RS-TIM, AU-LOP, AU-AIS, HP-UNEQ, HP-PLM, HP-RDI, HP-TIM, TU-LOM, TU-LOP, TU-AIS, LP-UNEQ, LP-PLM, LP-RDI, LP-RFI, LP-TIM PDH Payload alarms (depends on payload): DS1-AIS, DS1-LOF, 2M-AIS, 2M-RDI, 2M-LOF, 34M-AIS, 34M-LOF, 34M-RDI, 45M-AIS... -
Page 107: Sdh Errors
8.2.1 PDH & T-Carrier Errors The following PDH and T-Carrier errors can be inserted: E1 signals: Code, FAS, CRC, REI, E-bit, Bit E3 signals: Code, FAS, Bit E4 signals: FAS, Bit DS1 signals: Code, FAS, Bit DS3 signals: Code, FAS, Bit PDH Error Type Go back to top Go back to TOC 8.2.2 SDH Errors... -
Page 108: Otn Errors
SDH Error Type Go back to top Go back to TOC 8.2.3 OTN Errors OTU-1/2 signals: FAS, MFAS, BIP, BEI, Corrected FEC errors, Uncorrectable FEC ODU-1/2 signals: BIP, BEI STM-16/64 signals: FAS, B1, B2, MS-REI, B3, HP-REI, LP-BIP, LP-REI, Depends on payload: 2M-FAS, 2M-CRC, 2M-REI, 34M-FAS, 45M-FAS, 1.5M-FAS OTN Error Type Go back to top Go back to TOC Error Flow: OTN, SDH, SONET, PDH signals... - Page 109 Error Flow Alarm Generation/Error Insertion At any time during the test process, tap the Error Injection or Alarm Generation buttons to inject errors or generate alarms. Go back to top Go back to TOC RXT-6200_RXT6000e_Module_Manual Page 109 of 387...
-
Page 110: Otn Tools
9.0 OTN Tools 9.1 Shortcuts Accessing OTN Tools Tap on Home (main menu) > OTN Tools OTN Tools Menu Overhead Analyzer: Displays the Optical Channel Transport Unit(OTU) Displays Optical Channel Data Unit(ODU) Displays Optical Channel Payload Unit(OPU) bytes of the received channel Overhead Generator: Used to edit Optical Channel Transport Unit(OTU) Used to edit Optical Channel Data Unit(ODU) -
Page 111: Overhead Analyzer & Generator
9.2 Overhead Analyzer & Generator Tap the Overhead Analyzer icon to display the OH screens shown below. Overhead Analyzer Menu The Overhead is color coded for simplified viewing. Decoding Bytes Tapping the applicable byte enables an automatic decode – a byte description including the Hexadecimal and Binary value is provided. -
Page 112: Optical Transport Unit (Otu) Analysis
Uses the first six bytes and, similar to SONET/SDH, it is used to provide framing for the entire signal In order to provide enough 1/0 transitions for synchronization, scrambling is used over the entire OTU frame, except for the FAS bytes MultiFrame Alignment Signal (MFAS) Byte is used to extend command and management functions over several frames The MFAS counts from 0 to 255, providing a 256 multiframe structure... -
Page 113: Optical Data Unit (Odu) Analysis
GCCO Type Reserved (RES) bytes are currently undefined in the standard. Go back to top Go back to TOC 9.2.3 Optical Data Unit (ODU) Analysis The ODU overhead is divided into several fields: RES, PM, TCMi, TCM ACT, FTFL, EXP, GCC1/GCC2 and APS/PCC. - Page 114 PM TTI Type Go back to top Go back to TOC TCMi: There are six Tandem Connection Monitoring (TCMi) fields that define the ODU TCM sub-layer, each containing TTI, BIP-8, BEI/BIAE, BDI, and STAT subfields associated to each TCM level (i=1 to 6). The STAT subfield is used in the PM and TCMi fields to provide an indication of the presence or absence of maintenance signals.
- Page 115 FTFL Type Go back to top Go back to TOC Experimental (EXP) Field not subject to standards and is available for network operator applications RXT-6200_RXT6000e_Module_Manual Page 115 of 387...
- Page 116 EXP Type Go back to top Go back to TOC General Communication Channels 1 and 2 (GCC1/GCC2) Fields are very similar to the GCC0 field, except that each channel is available in the ODU GCC1 Type Go back to top Go back to TOC Automatic Protection Switching and Protection Communication Channel (APS/PCC) Supports up to eight levels of nested APS/PCC signals associated to a dedicated-connection monitoring level depending on the value of the multiframe...
-
Page 117: Optical Payload Unit (Opu) Analysis
APS/PCC Type Go back to top Go back to TOC 9.2.4 Optical Payload Unit (OPU) Analysis Payload Structure Identifier (PSI) Primary overhead field associated with the OPU A 256-byte multiframe whose first byte is defined as the Payload Type (PT). The remaining 255 bytes are currently reserved. -
Page 118: Payload Label
Go back to top Go back to TOC 9.3 Payload Label (Payload Structure Identifier) Tap the Payload Label icon to display the screen shown below. Tabs for Tx and Rx label settings are provided. Payload Label PSI[0] contains a one-byte Payload type. PSI[1] to PSI[255] are mapping and concatenation specific. RXT-6200_RXT6000e_Module_Manual Page 118 of 387... -
Page 119: Trace Identifier
Go back to top Go back to TOC 9.4 Trace Identifier (Trail Trace Identifier) Tap the Trace Identifier icon to display the screen shown below. There are tabs for Tx and RX settings of the TTI. Trace Identifier (Trail Trace Identifier) Trail Trace Identifier TTI similar to the J0 byte in SONET/SDH, is used to identify the signal from the source to the destination within the network. -
Page 120: Tcm Tasks
Go back to top Go back to TOC 9.5 TCM Tasks (Tandem Connection Monitoring) Tap the TCM Tasks icon to display the screen shown below. TCM Tasks Results are available for up to six tandem connections. The counts are numbers of seconds containing the error or indication. -
Page 121: Sdh/Sonet Tools
10.0 SDH/SONET Tools 10.1 SDH Tools Accessing SDH Tools Tap on Home (main menu) >SONET/SDH Tools 10.1.1 Shortcuts SDH/SONET Tools Menu Overhead Analyzer: Displays the Section Overhead (SOH) and Path Overhead (POH) bytes of the received channel. Overhead Generator: SDH mode. Used to edit Section Overhead (SOH) and Path Overhead (POH) bytes of the transmitted channel. - Page 122 SOH RX, which displays the bytes associated with the Section/LINE Overhead POH RX, which displays the bytes associated with the Path Overhead Summary, which displays the Path Traces (J0, J1, J2), APS (K1, K2), Synchronization status (S1), STS Path (C2), and VT Path (v5) Signal Label bytes Tapping the applicable byte enables an automatic decode –...
- Page 123 Path Trace Byte (J0) Regenerator section trace Used to transmit a 16 or 64-byte identifier (trace) (including a CRC-7 byte) repeatedly so that all regenerators can verify their connection Used for continuity testing between regenerators B1 Byte (RS-BIP) An 8-bit even parity code used to check for transmission errors over the regenerator section Its value is calculated over all the bits of the STM-1 frame before scrambling The checksum value is placed in the RS overhead of the following STM-1 before scrambling Path Trace Byte (J0)
- Page 124 AU Pointer Byte Go back to top Go back to TOC Line Layer / Multiplexer Section B2 Byte (MS-BIP) A 24-bit interleaved even parity code used to determine if transmission errors have occurred over the Multiplexer Section Its calculated over all the bits of the STM-1 frame except those in the Regenerator Section overhead The computed checksum is placed in the MSOH of the following STM-1 frame K1 Byte (APS-Linear) Used to activate and deactivate the switching between the main and protection paths on a multiplexer section...
- Page 125 K1 Byte (APS-Linear) Go back to top Go back to TOC K1 Byte (APS-Ring) Used to activate and deactivate the switching between the main and protection paths on a multiplexer section APS message type conforms to ITU-T G.841/ Bellcore GR.253 Ring Network architectures Bits 1-4 are the condition 1111 Lockout of protection 1110 Forced switch (span)
- Page 126 111 MS-AIS Others Not used K2 Byte (APS-Ring) Conforms to and follows ITU-T G.841 Bellcore GR.253 recommendations Used to activate and deactivate the switching between the main and protection paths on a multiplexer section Used to communicate Alarm Indication Signal (AIS) and Remote Defect Indication (RDI) conditions Bits 1-4 are the source node ID Bit 5 is the path code 0 Short path...
- Page 127 1101 Stratum 3e 1110 Previsional by the Network Operator 1111 Not used for synchronization Other bytes are reserved S1 Byte (Synchronization Status) Order Wire Byte (E2) A 64kbps voice communication channel between multiplexers. It’s a channel used by craft persons and will be ignored as it passes through regenerators. The relief byte is used for ring protection Go back to top Go back to TOC Path Overhead Layer...
- Page 128 J1 Byte (HP Path Trace) B3 byte Even code parity which determines if a transmission error has occurred over a path Its value is calculated over all the bits of the previous VC-4 The computed checksum is placed in the B3 byte before scrambling C2 byte (HP signal label) for SDH mode Indicates mapping of the VC-n.
- Page 129 Go back to top Go back to TOC G1 byte (Path status) High Order path status byte Used to convey the path terminating status back to the originating path, thus allowing bidirectional monitoring of the complete path Bits 1-4: Remote Error Indication (HP-REI) indicates number of bit errors detected by B3 Bit 5: Remote Defect indication (HP-RDI) set to 1 if signal failure is detected Bits 6-7: Enhanced RDI information to differentiate between payload defects (HP-PLM), connectivity defects (HP-TIM, HP-UNQ) and server defects (HP-AIS, LOP)
- Page 130 Frame 74 > ODI indicating to the far-end that AU/TU-AIS has been inserted into egressing AU-n TU-n due to defects before or within the tandem connection Frames 73-76 > Reserved capacity V5 byte (LP signal label) Byte contains error analysis, signal label and path status information Continuous monitoring of anomalies or defects and payload composition at the path end or along the path Bits 1-2 provides error checking (BIP-2) Bit 3 is the LP-REI (0 = no error, 1 = errors)
- Page 131 Frames 1-8 >Frame Alignment Signal (FAS) Frames 9-72 > The Access Point Identifier of the tandem connection (TC-API) Frames 73-76 > TC-RDI indicating defects that have occurred in the tandem connection to the far- Frame 74 > ODI indicating to the far-end that AU/TU-AIS has been inserted into egressing AU-n/ TU-n due to defects before or within the tandem connection Frames 73-76 >...
- Page 132 Summary Path Traces (SP) indicates a space between the message characters. The message is displayed in red when an alarm condition is detected. Go back to top Go back to TOC 10.1.3 Overhead Generator Tap the Overhead Generator icon to display the OH screens shown below. There are three tabs: SOH TX, which allows editing of select bytes associated with the Section Overhead.
- Page 133 Convenient drop-down selections. In some instances, the selections will be available over multiple pages. While programming of most overhead bytes is possible using the OH Generator feature, dedicated functions are available for Pointer Tasks, Payload Labels, Trace Identifier, APS Testing, TCM testing. In some instances, more advanced editing is possible using the dedicated functions.
-
Page 134: Overhead Generator
Overhead Generator Programming most overhead bytes is possible using the OH Generator feature, however dedicated test functions are available for Pointer Tasks, Payload Labels, Trace Identifier, APS Testing, TCM testing. In some instances, more advanced editing is possible using the dedicated functions. Go back to top Go back to TOC 10.1.4 Pointer Tasks Tap the Pointer Tasks icon to display the Pointer testing screens. -
Page 135: Pointer Generation
Analysis > AU tab For TU pointers: Pointer value LOP (Loss of Pointer) PJE and NJE NDF or New Data Flags Difference and Sum Analysis > TU tab Go back to top Go back to TOC 10.1.4.2 Pointer Generation The Pointer generator is able to generate individual pointer movements as follows: For AU pointers: SS bits: Program bits 5 and 6 of the H1 byte to be either SDH [10], SONET [00], Unknown [01] or [11]. -
Page 136: Pointer Sequences
Generator > AU tab For TU pointers TU Pointer value: Set value in a range of 0 to 784 (TU-3) and 0 to 139 (TU-12) TU-11 Pointer value: Set value in a range of 0 to 109 (TU-11) Increment (INC) or Decrement (DEC) pointer value by 1 byte is single steps Generator >... - Page 137 Periodic: Generate periodic changes in the pointer value 87-3: Generate an 87-3 pattern (87 consecutive pointer adjustments, 3 consecutive pointer value, with no adjustments) 87-3 Add: Generate an 87-3 pattern (87 consecutive pointer adjustments, 3 consecutive pointer value, added to have an additional pointer value) 87-3 Cancel: Generate an 87-3 pattern (87 consecutive pointer adjustments, 3 consecutive pointer value, reduced the number of adjustments by one)
-
Page 138: Trace Identifier
G.873 > TU tab Pointer Sequence Testing It is recommended to run one sequence with positive adjustments followed by a sequence with negative adjustments. Performing the measurement at the maximum positive and negative frequency offset applicable to the line rate increases the stress on the pointer processor. -
Page 139: Transmitted Traces (Tx)
There are dedicated tabs for Transmitted and Received (expected) path traces and setups. 10.1.5.1 Transmitted Traces (TX) J0 [RS]: Regenerator section trace Program a 1 or 16-byte identifier to check the connection between regenerators J1 [HP]: High order path section trace Program a 16 or 64-byte identifier to check the high order transmission path J2 [LP]: Low order path section trace Program a 16 or 64-byte identifier to check the low order transmission path... -
Page 140: Payload Labels
RX - JO [S] Go back to top Go back to TOC 10.1.6 Payload Labels This function is used to set the C2 and V5 Path Signal Labels which indicate the content of the High order and Low order VCs. SDH/SONET Tools Menu Tap the Payload Label icon to display the payload label screens. -
Page 141: Aps Tasks
TX C2 [HP] V5 [LP Path]: Path signal label Program the TX and RX label by editing the hexadecimal value or by using the convenient drop-down menu selection For the RX label, enable or disable the Payload Mismatch (PLM) Alarm TX V5 [LP] Go back to top Go back to TOC 10.1.7 APS Tasks... - Page 142 following conditions: “Hard” Failure (SF) condition – Loss of Signal (LOS), MS-AIS, BER > 1 x 10 “Soft” Failure (SD) condition – Signal degradation when BER exceeds a predetermined threshold. Normally over a provisioned range of 1 x 10 to 1 x 10 Tap the APS Testing icon to display the APS testing screen shown below.
-
Page 143: Aps Sequence
Go back to top Go back to TOC 10.1.7.2 APS Sequence The associated K1/K2 sequence and received K1/K2 bytes may be captured. RXT-6200_RXT6000e_Module_Manual Page 143 of 387... -
Page 144: Tandem Connection Monitoring (Tcm)
Event Details Go back to top Go back to TOC 10.1.8 Tandem Connection Monitoring (TCM) HP Setup TCM Standards The Tandem paths are defined in ITU recommendation G.707 Annex D and Annex E G.707 Annex D for VC4 and VC3 G.707 Annex E for VC2 and VC1 G.707 defines a tandem connection source and sink and describes the responses of each when defect (alarm) and error conditions are detected... -
Page 145: Tributary Scan
Go back to top Go back to TOC 10.1.9 Tributary Scan This function requires VC12 or VT-1.5 mapping and allows for a quick check of the signal structure, trace identifier, and the payload. An important part of any Add Drop Multiplexer (ADM) installation process is the verification of the path routing. Considering that an STM-1 contains 63 x VC-12’s and a STM-4 contains 252 x VC-12’s checking each path manually can be very time consuming. -
Page 146: Round Trip Delay
Go back to top Go back to TOC 10.1.10 Round Trip Delay The Round Trip Delay (Propagation Delay) measurement works by sending a test pattern with an error. The time it takes for the error to reach the receiver is the propagation time through the network. Select SDH as TX/RX standard. -
Page 147: Sonet Tools
10.2 SONET Tools Accessing SDH/SONET Tools Tap on Home (main menu) >SONET/SDH Tools 10.2.1 Shortcuts SDH/SONET Tools Menu Overhead Analyzer: Displays the Section/Line Overhead (SOH) and STS Path Overhead (POH) bytes of the received channel. Overhead Generator: Used to edit Section/Line Overhead (SOH) and STS Path Overhead (POH) bytes of the received channel. - Page 148 Summary, which displays the Path Traces (J0, J1, J2), APS (K1, K2), Synchronization status (S1), STS Path (C2), and VT Path (v5) Signal Label bytes Tapping the applicable byte enables an automatic decode – a byte description including the Hexadecimal and Binary value is provided.
- Page 149 Regenerator section trace Used to transmit a 16 or 64-byte identifier (trace) (including a CRC-7 byte) repeatedly so that all regenerators can verify their connection Used for continuity testing between regenerators B1 Byte (RS-BIP) An 8-bit even parity code used to check for transmission errors over the regenerator section. Its value is calculated over all the bits of the STS-N frame before scrambling The checksum value is placed in the SECTION overhead of the following STS-N before scrambling B1 (Section-BIP) Byte...
- Page 150 D1 Byte Pointers H1/H2/H3 Bytes (STS Pointers) Enable transfer of STS-3 frames with STS-N frames and are processed by the MS terminating equipment H1 Pointer Byte Go back to top Go back to TOC Line Layer B2 Byte A 24-bit interleaved even parity code used to determine if transmission errors have occurred over the Section Layer Its calculated over all the bits of the STS-3 frame except those in the Section overhead The computed checksum is placed in the TOH of the following STS-N frame...
- Page 151 B2 Byte K1 Byte (APS-Linear) Used to activate and deactivate the switching between the main and protection paths on a multiplexer section APS message type conforms to ITU-T G.783 and Bellcore GR.253 for Linear network architectures Bits 1-4 (G.783 Protocol) 1111 Lockout of protection 1110 Forced switch 1101 Signal fail, high priority (1:n only)
- Page 152 K1 Byte (APS-Linear) K1 Byte (APS-Ring) Used to activate and deactivate the switching between the main and protection paths on a multiplexer section APS message type conforms to ITU-T G.841/ Bellcore GR.253 Ring Network architectures Bits 1-4 are the condition 1111 Lockout of protection 1110 Forced switch (span) 1101 Forced switch (ring)
- Page 153 Others Not used K2 Byte (APS-Ring) Conforms to and follows ITU-T G.841 Bellcore GR.253 recommendations Used to activate and deactivate the switching between the main and protection paths on a multiplexer section Used to communicate Alarm Indication Signal (AIS) and Remote Defect Indication (RDI) conditions Bits 1-4 are the source node ID Bit 5 is the path code 0 Short path...
- Page 154 1110 Provisionable by the Network Operator 1111 Not used for synchronization Other bytes are reserved S1 Byte (Synchronization Status) Order Wire Byte (E2) A 64 kbps voice communication channel between multiplexers. It’s a channel used by craft persons and will be ignored as it passes through regenerators. The relief byte is used for ring protection Go back to top Go back to TOC Path Overhead Layer...
- Page 155 J1 Byte (STS Path Trace) B3 byte Even code parity which determines if a transmission error has occurred over a path Its value is calculated over all the bits of the previous STS-3 The computed checksum is placed in the B3 byte before scrambling B3 Byte (STS Path BIP) C2 byte (STS path signal label) Indicate the type of payload being transported in the STS, SPE, including the status of the mapped...
- Page 156 C2 Byte (STS Path signal label) C2 byte structure per GR.253 recommendations Code[hex] Payload type Unequipped Equipped non-specific (standard payload) Floating VT mode Locked VT mode Asynchronous mapping for DS3 Asynchronous mapping for 139.264Mbps Mapping for ATM Mapping for DQDB Asynchronous mapping for FDDI Mapping for HDLC over SONET STS-1 payload with 1 VT-x payload defect...
- Page 157 STS-1 payload with 18 VT-x payload defects STS-1 payload with 19 VT-x payload defects STS-1 payload with 20 VT-x payload defects STS-1 payload with 21 VT-x payload defects STS-1 payload with 22 VT-x payload defects STS-1 payload with 23 VT-x payload defects STS-1 payload with 24 VT-x payload defects STS-1 payload with 25 VT-x payload defects STS-1 payload with 26 VT-x payload defects...
- Page 158 H4 Byte (VT Indicator) Z3/Z4 byte (STS Path) Allocated for future use. Have no defined value. The receiver is required to ignore their content. Z5 byte (STS Path TCM) Allocated to provide a STS Path Tandem Connection monitoring function for contiguously concatenated STS-3 levels.
- Page 159 Z5 Byte (Path TCM) V5 byte (VT path overhead) The first byte of a VT SPE provides the functions of error checking, signal label and path status. Continuous monitoring of anomalies or defects and payload composition at the path end or along the path Bits 1-2 provides error checking (BIP-2) Bit 3 is the REI-V (0 = no error, 1 = errors), that is sent back towards an originating VT PTE if errors were detected by the BIP-2.
- Page 160 V5 Byte (VT signal label) J2 byte (VT path trace) Used to transmit a configurable 16-byte identifier that enables the receiving path to continuously verify its connection with the transmitter Uses the same byte structure as the J0 and J1 bytes Z6 byte (VT-TCM) Provides VT tandem connection monitoring function (TCM-V) for the VT-1.5, VT-2 levels.
- Page 161 Z6 Byte (VT-TCM) Z7 byte (VT path Extended Label) If bits 5-7 of V5 byte are set to 101 (value = 5), then: The signal label in Z7 byte becomes valid where: This is a 32-bit multi-frame string Bit 1 is allocated to the extended signal label Bit 2 is allocated to virtual concatenation Bits 3 and 4 are unassigned and are reserved for VT APS signaling Bits 5, 6, 7 are allocated for optional use...
- Page 162 Summary Go back to top Go back to TOC 10.2.3 Overhead Generator Tap the Overhead Generator icon to display the OH screens shown below. There are three tabs: SOH TX, which allows editing of select bytes associated with the Section Overhead. Editing of J0, K1, K2, S1 is permitted as follows: Hexadecimal value using pop-up keypad.
- Page 163 S1 Byte from SOH POH TX, which allows editing of select bytes associated with the Path Overhead. Editing of J1, C2, H4, G1, Z5, and J2, V5, Z6 is permitted as follows: Hexadecimal value using pop-up keypad Binary values using simple on-screen bit toggle or pop-up keypad Convenient drop-down selections.
- Page 164 Go back to top Go back to TOC 10.2.4 Pointer Tasks Tap the Pointer Tasks icon to display the Pointer testing screens. SDH/SONET Tools Menu Go back to top Go back to TOC 10.2.4.1 Pointer Analysis Pointers keep SONET signals synchronous by compensating for timing differences without having to use stuffing bits. Pointers are allowed to move up or down every three frames however the actual rate should be slower.
- Page 165 Analysis > P Pointer For TV pointers: Pointer value LOP (Loss of Pointer) PJE and NJE NDF or New Data Flags Difference and Sum Analysis > VT tab Go back to top Go back to TOC 10.2.4.2 Point Generator The Pointer generator is able to generate individual pointer movements as follows: For STS pointers: SS bits: Program bits 5 and 6 of the H1 byte to be either SONET [10], SONET [00], Unknown [01] or [11].
- Page 166 Generator > STS tab For VT pointers VT Pointer value: Set value in a range of 0 to 109 (VT-1.5) and 0 to 139 (VT-2) Increment (INC) or Decrement (DEC) pointer value by 1 byte is single steps Generator > VT tab Go back to top Go back to TOC 10.2.4.3 Pointer Sequences The Pointer generator is also able to generate Standard ITU-T G.783 and ANSI T1.105.03 and Bellcore GR-253...
- Page 167 adjustments) 87-3 Add: Generate an 87-3 pattern (87 consecutive pointer adjustments, 3 consecutive pointer value, with added to have an additional pointer value) 87-3 Cancel: Generate an 87-3 pattern (87 consecutive pointer adjustments, 3 consecutive pointer value, with reduce the number of adjustments by one) Unit: Select the type of unit to count :Frames N: Specify the number of pointer adjustments in a row: 1—9999 (default=6) T: Specify the average pointer spacing in time.
- Page 168 Pointer Sequence Testing It is recommended to run one sequence with positive adjustments followed by a sequence with negative adjustments. Performing the measurement at the maximum positive and negative frequency offset applicable to the line rate increases the stress on the pointer processor.
- Page 169 Go back to top Go back to TOC 10.2.5.2 Received Traces (RX) J0 [Section]: Regenerator section trace/Section Layer trace Program a 1 or 16-byte identifier to set and check the expected trace Enable or disable the TIM (Trace Identifier Mismatch) alarm J1 [STS Path]: High order path section trace/STS path section trace.
- Page 170 SDH/SONET Tools Menu Tap the Payload Label icon to display the payload label screens. There are dedicated tabs for Transmitted and Received payload labels and setups: C2 [STS Path]: Path signal label Specifies the mapping type in the STS-1n Program the TX or RX label by editing the hexadecimal value or by using the convenient drop-down menu selection For the RX label, you can enable or disable the Payload Mismatch (PLM) Alarm TX C2 [P]...
- Page 171 Go back to top Go back to TOC 10.2.7 APS Tasks 10.2.7.1 APS Timing This function measures the Automatic Protection Switching (APS) limits of the network. APS applies only to the Multiplex sections of a SONET network and enables network elements to re-route traffic to a backup circuit in the event of network failure or problems.
- Page 172 APS Timing Setup APS Test Procedure: The test set should be connected to a tributary port of network element or transmission system to ensure that the switching time is measured for the service transported by the SONET network. Ensure that no errors or alarms are present on the transmission system because this will impact the measurement.
- Page 173 The associated K1/K2 sequence and received K1/K2 bytes may be captured. Event Details Go back to top Go back to TOC 10.2.8 Tandem Connection Monitoring (TCM) HP Setup TCM Standards The Tandem paths are defined in ITU recommendation G.707 Annex D and Annex E. ITU-T recommendation G.707 defines a tandem connection source and sink and describes the responses of each when defect (alarm) and error conditions are detected.
- Page 174 Go back to top Go back to TOC 10.2.9 Tributary Scan This function requires VC12 or VT-1.5 mapping and allows you to quickly check the signal structure, trace identifier and the payload. Tributary Scan An important part of any Add Drop Multiplexer (ADM) installation process is the verification of the path routing. Considering that an STS-3 contains 84 x VT-1.5’s and a STS-12 contains 336 x VT-1.5’s checking each path manually can be very time consuming.
- Page 175 Go back to top Go back to TOC 10.2.10 Round Trip Delay Round Trip Delay Results The Round Trip Delay (Propagation Delay) measurement works by sending a test pattern. A errors is transmitted in the pattern. The time it takes for the error to reach the receiver is the propagation time through the network. Select SONET as TX/RX standard.
- Page 176 11.0 Jitter and Wander Accessing Jitter and Wander Go to OTN/SDH/SONET Testing from the Test Mode Selection, then select the following: For SONET or SDH signals: Home (Main Menu) > SONET/SDH Tools > More > Jitter & Wander Jitter & Wander displays the Jitter Measurements showing measurements and analysis of jitter in received signal. Jitter and Wander are usually described as the phase noise in digital signals.
- Page 177 Configure the following settings before starting the test: Filter: HP1+LP or HP2+LP. The frequency for each filter varies depending on the setup mode (E1/E3, DS1/DS3). Frequency ranges for each filter and setup mode are listed as follows: E1: HP1+LP (20Hz to 100KHz); HP2+LP (18 Hz to 100KHz) E3: HP1+LP (100Hz to 800KHz);...
- Page 178 Error Message: Configuration Suggestions Loss of Signal (LOS) Check If the LOS condition is detected at any time during the MTJ test, the data will become invalid and the test will stop automatically. An error message will appear to notify the user to correct the condition before running the test again. LOS Error Message Table Table values include:...
- Page 179 MTJ Table Graph A cross (x) indicates the maximum jitter value tolerated at the frequency. Yellow triangles (▲) indicate that the data point is greater than, while the green "X" symbols represent actual measured values. Greater than implies that the jitter tolerance of the DUT (device under test) is much better than the value measured by the test set.
- Page 180 Loop Message 2. Device Under Test (DUT) Before starting the test, "Connect Device Under Test" will appear. Connect the test set to the DUT then press Start to begin testing. Frequency (Hz): Frequency measured JTF (Jitter Transfer Function) (dB): Jitter in divided by jitter out value (in dB) Mask (dB): Jitter output in relationship to the input Progress: The bar at the bottom of the graph shows the test progress RXT-6200_RXT6000e_Module_Manual...
- Page 181 Advanced Clock Wander & Phase Measurements Built-in MTIE/TDEV Wander Analysis VeEX MTIE/TDEV Wander Analysis PC software Individual screens, fields and selections may vary among products or technologies, and depend on the options/licenses loaded or available for each test set. Nonetheless, the concepts and procedure flow are very similar.
- Page 182 Wander >Wander Go back to top Go back to TOC 11.4.1.1 Test Setup Setup 1. Measurement Clock Reference or Reference Clock Source offers a selection of external or internal (optional) frequency references. Internal or built-in reference options could be “Atomic 10 MHz” or “Atomic 1PPS”, disciplined by GPS or free running.
- Page 183 GPS-disciplined clock (built-in option or external). The Wander (TIE) and Phase (TE) data logs can be saved in real time to a USB Memory using VeEX proprietary format (to be analyzed by the built-in or PC-based MTIE/TDEV Analysis software) or exported to an open CSV format.
- Page 184 User can also set the sampling rate (samples per second). 6. File Types available are the proprietary “VeEX” format (compatible with VeEX Wander Analysis PC software” and an open CSV format that can be analyzed or formatted with a spreadsheet program (e.g. Excel or Numbers) or could be imported to other analysis software.
- Page 185 PASS/FAIL assessment, without the need for a PC. The test set may allow the analysis to be performed while the test is still running for run-time verification. Longer test take a lot longer to be analyzed, so the VeEX Wander Analysis PC Software is still recommended for tests longer than 24 hours. Features: •...
- Page 186 1. Date and Time stamp indicating when the test was started 2. Total of seconds recorded during the test 3. Beginning and end of the data set to be analyzed and displayed in the graph (5) below. Tap in the Start and/or End field and enter the desired time limits, then press the Set Range button to apply these changes.
- Page 187 MTIE & TDEV Results Exported to CSV 11.4.3 VeEX MTIE/TDEV Wander Analysis PC software • Provides further post-processing of clock stability data, such as MTIE and TDEV for long-term tests • Frequency offset calculation and removal for relative TIE analysis •...
- Page 188 Click on the MTIE/TDEV Analysis button to go to the wander analysis function 11.4.3.2 MTIE & TDEV Analysis Select the desired tolerance masks from the pull-down list and click on the Analyze button to perform the MTIE and/or TDEV analysis. 11.4.3.3 MTIE &...
- Page 189 Click on the Report button to generate a copy of the measurement and analysis in PDF format. Go back to top Go back to TOC RXT-6200_RXT6000e_Module_Manual Page 189 of 387...
- Page 190 12.0 OTU-Xe 12.1 OTU-Xe Overview Overclocked OTN Testing An Overclocked option verifies extended bit rates to ITU-T series G supplement 43 standards. Overclocked OTN compensates for the rate mismatch between 10 GbE LAN and OPU2 payload by raising the overall OTU2 data rate from the standard 10.709 Gbps to fit the 10GbE LAN client signal.
- Page 191 12.2 Home Menu and Switch Test Mode The Home menu can be accessed at anytime during operation by pressing the Home key on the rubber keypad. The screen is divided into three presentation areas: 1 - Left: LEDs: Displays soft LEDs associated with Errors and Alarms Tools: IP connection status, Advanced IP features (Net Wiz, WiFi Wiz, VoIP, and IPTV applications) Utilities: Applications (Help, Settings, Files) which are common to all VePAL handheld test sets 2 - Middle:...
- Page 192 Enabling Ethernet Options on the OTUx Home Menu The Home menu features different test applications depending on Setup configuration. To enable Ethernet options (BERT, RFC 2544, Throughput) and access them from the Home menu, select 10GE SYNC or 10GE ASYNC for the OTN Mapping.
- Page 193 12.3 OTN Setup Tap on the Setup icon to access the tabs featured in this section. 12.3.1 Signal Setup Signal Setup Tap on the Signal tab to set up the Transmitter and Receiver interfaces and associated test parameters prior to running a test.
- Page 194 Go back to top Go back to TOC 12.3.1.2 Interface Tapping the Interface box opens the Interface Setup screen. Interface Setup Test Port: Optical interface is available for OTU-1e, OTU-2e signals. Clock Source: Can be configured as follows: Internal clock: The clock for the transmitter is derived from the internal clock. The internal clock has an accuracy of +/- 3.5ppm conforming to G.812 recommendations.
- Page 195 Pattern Setup PRBS Pattern: Use the pattern drop-down box to select the test pattern which will be inserted into the transmitted signal. Pseudo Random Bit Sequences (PRBS) defined by ITU-T 0.150 and 0.151 standards, fixed words and 24-bit or 32 bit user defined patterns are available. Note, if the 32 bit user pattern entered is incorrect, the default pattern will be 0xFFFFFFFF.
- Page 196 General tab Audible Alarm: OFF, ON. Results on start: On or Off. Provides an automatic move to Result screen when it starts. Measurement Clock Source: Internal Clock or Tx Clock Source; the measurement is synchronized to the Transmitted (Tx) Clock. Go back to top Go back to TOC 12.4 OTN Results Accessing OTN Results...
- Page 197 OTN Menu (Ethernet BERT application) Go back to top Go back to TOC 12.4.1 Summary The Summary tab displays a summary page of test results and parameters. At a glance, the user is able to see if there are any alarms, errors or signal failure pertaining to the OTN signal and its payload. Summary tab Go back to top Go back to TOC 12.4.2 Errors/Alarms...
- Page 198 Red: An error or alarm condition is detected and is currently present. Yellow: Indicates a history condition. An error or alarm was detected during the measurement interval but it is no longer present or active. Errors/Alarms (Page 1) Tapping the individual soft LED will automatically link to the applicable result screen which provides detailed information.
- Page 199 RXT-6200_RXT6000e_Module_Manual Page 199 of 387...
- Page 200 Go back to top Go back to TOC Errors/Alarms (Page 2) RXT-6200_RXT6000e_Module_Manual Page 200 of 387...
- Page 201 Page 2 lists the OTU Errors in logical order that are associated with the signal under test. All errors are evaluated and stored. The Elapsed Time [ET] is shown in the right hand corner of the header. Error conditions are displayed in red including count and rate.
- Page 202 Errors/Alarms (Page 5) Errors/Alarms (Page 7) Page 7 lists the BERT Errors/Alarms in logical order that are associated with the signal under test. All alarms are evaluated and stored. Errors/Alarms (Page 7) Go back to top Go back to TOC 12.4.3 Event Log The Event log tab brings up the screen listing the error and alarm events recorded during a test.
- Page 203 Event Log Go back to top Go back to TOC 12.4.4 Signal Level (Page 1) The Signal tab displays the Level and Frequency screen. Page 1 displays the level measurement Loss of Signal (LOS); the Saturation level for optical signals is shown graphically, including the level measurement in dBm. Signal (Page 1) Go back to top Go back to TOC Frequency (Page 2)
- Page 204 Signal (Page 2) Frequency: The received signal frequency and offset is measured and displayed. OTN Current (bps): Indicates the frequency of the input signal Offset (ppm): Indicates the difference between the standard rate and the rate of the input signal Min (ppm): Indicates the difference between the standard rate and the minimum deviation detected in the input signal Max (ppm): Indicates the difference between the standard rate and the maximum deviation detected in the input...
- Page 205 12.5 OTU-Xe Ethernet Applications Accessing Ethernet Applications from OTU-Xe To enable and access Ethernet applications from the Home menu (RFC 2544, BERT, Throughput), tap on Setup [Home menu] > Hierarchy > OTN Mapping and select 10GE SYNC or 10GE ASYNC from the drop-down menu. Hierarchy Setup After configuring the OTU-Xe signal, press the Home Key on the keypad and tap on the desired Ethernet test.
- Page 206 OTN Home Menu with Ethernet Options Setup and results for Ethernet applications featured in OTU-x (-1e, -2e) are the same as those featured in Ethernet Testing mode. Please refer to the corresponding Ethernet testing section for more information on the following applications: 12.5.1 OTU-Xe with 10GE BERT redirects to BERT...
- Page 207 (CFP4, CFP2, QSFP+, SFP+, RJ45) to select the test mode. Depending on interface options purchased, the following selections are possible: Test Mode Seelction RXT-6200 Test Mode Seelction RXT-6000e Shared single/dual port combinations between RXT-6200 and RXT-6000e: Single port 100G (CFP2 or CFP4) Single port 100G, 50G (QSFP28/QSFP+) RXT-6200_RXT6000e_Module_Manual...
- Page 208 Single port 40G (QSFP+) Single port 25G, 10G, 1G (SFP28/SFP+) Single Copper port 1G (1G Copper) Dual port 100G, 50G (QSFP28/QSFP+) Dual port 40G (QSFP+) Dual port 25G, 10G, 1G (SFP28/SFP+) Dual Copper port 1G (1G Copper) Single/dual port combinations present only in RXT-6000e: Single port 100G (CFP2) Single port 100G, 50G (QSFP28/QSFP+) Single port 40G (QSFP+)
- Page 209 1 GE Fiber Port Auto Negotiation: On or Off. Matches the test set's negotiation settings to those of the link partner Speed: Default set to 1000 Mbps Duplex: Default set to Full Flow Control: TX On, RX On, Both On, or Off When flow control is enabled, the test set will respond to pause frames received by the link partner by adjusting the transmit rate When flow control is disabled, the test set ignores all incoming pause frames from the link partner and...
- Page 210 10GE Port Setup Go back to top Go back to TOC 10 GE Port 10GE Mode: LAN or WAN WIS Mode (only available in WAN mode): SDH or SONET Flow Control: Enable chosen as default option Clock Offset (ppm): The frequency may be offset in parts per million Status Status tab The Status tab lists current port settings.
- Page 211 Go back to top Go back to TOC 40 GE Port Setup 40 GE Port Setup 40G port profile: Default Network Type: LAN Flow Control: Enable/Disable Clock Source: Internal, External (2Mbps, 2MHz, 1.5Mbps, 1.5MHz, 10MHz, 1PPS), RxCLK, GPS1PPS Clock Offset (ppm): Can be configured; range is +/- 150ppm Link Fault Response: Enable/Disable Go back to top Go back to TOC 100 GE Port...
- Page 212 Setup Clock Offset 13.1.3 Measurement Settings 10 GE Measurement Setup The measurement and event log settings are configured in this screen. Profile: Last configuration, Delete, Save, Save as..., Default. Mode: Manual, timed, or auto mode are available. Manual mode: User starts and stops the measurements manually. Timed mode: User defines the duration of the test;...
- Page 213 ToD Synchronization Source: Disable, GPS 1PPS Clock Synchronization is not supported on all the test set models. Check with customer care for availability. Go back to top Go back to TOC RXT-6200_RXT6000e_Module_Manual Page 213 of 387...
- Page 214 13.2 BERT 13.2.1 BERT Setup Overview: BER testing at Layer 1, 2, 3, and 4 is supported. The BERT can be configured to use either regular PRBS test patterns, stress patterns (specifically for 10Gigabit Ethernet) or user defined test patterns to simulate various conditions. The test layer, frame header, traffic profile, error injection, and control settings of the far-end device (if applicable) must be configured prior to testing.
- Page 215 BERT Setup - Header (Layer 3) Layer 4: Framed BERT (same as Layer 1, 2, & 3 Framed) MAC Address: A default or user configured Media Access Control (MAC) address is added to the frame IP Address: A default or user configured IP address is added to the frame UDP Address: A user defined source and destination port address is added to the frame BERT Setup - Header (Layer 4) Go back to top Go back to TOC...
- Page 216 Ethernet Type I-SID Backbone VLAN ID, Priority, Type Test: Select the test layer to perform the BERT Options are Layer 1 Unframed, Layer 1 Framed, Layer 2, Layer 3, and Layer 4 Frame Type: Select the Ethernet frame type for Layer 2 or Layer 3 802.3 Raw (IEEE 802.3 frame without LLC) - Not available when Layer 3 is selected 802.3 LLC (IEEE 802.3 frame with LLC header) 802.3 SNAP (IEEE 802.3 frame with SNAP header)
- Page 217 MAC, VLAN, MPLS, IP, and Test Pattern Configurations: To configure the MAC addresses, IP addresses, VLAN tag(s), MPLS tag(s), and test pattern, tap on the frame image displayed on the screen. This brings up the configuration screens for all the header fields. MAC Header Tab: MAC Source: Use the default source address of the test set or configure a new or different address.
- Page 218 Type: The following selections are possible: 8100 (IEEE 802.1Q tagged frame) 88a8 (IEEE 802.1ad Provider Bridging) Drop Eligible: If enabled, drop eligibility flag will be set. VLAN Flooding: Enable/Disable. VLAN Flooding Range: Specifies the number of VLAN IDs. Enter a number from 0-4096. The VLAN IDs will be incremented by 1 until it reaches the number of times entered in the flood range.
- Page 219 TTL: Configurable in the range 0 to 255. The default setting is 128 hops. Used to decrement the time-to-live counter. BERT Setup - MPLS label configuration Go back to top Go back to TOC IP Tab: In the IP tab the user must configure the destination IP address and source address. The user may also configure the following IP header fields: IP Type: IPv4 IP Src and IP Dest: For IP Src, if the IP connection is up, refer to section 9.1 IP in the V300 Common...
- Page 220 BERT Setup - IP Address settings (Layer 3) Go back to top Go back to TOC Data Tab: User selects a test pattern that will be encapsulated in the Ethernet frame payload (for framed mode). Depending on the test layer, different test pattern options are available. Layer 1 Framed Test Patterns CRPAT: Compliant Random Pattern provides broad spectral content and minimal peaking for the measurement of jitter at component or system level.
- Page 221 BERT Setup - Data selection - (Layer 1 Unframed) Layer 1 Unframed Test Patterns HFPAT (High Frequency Pattern): This test pattern is to test random jitter (RJ) at a BER of 10- 12, and also to test the asymmetry of transition times. This high frequency test pattern generates a one, or light on, for a duration of 1 bit time, followed by a zero, or light off, for a duration of 1 bit time.
- Page 222 Fixed: All 0s or All 1s User Defined pattern: Length depends on size of frame Inversion: Normal or inverted BERT Setup - Data selection - PRBS Patterns (Page 1) Auto (Special Patterns): For special patterns, the most significant bit of the test pattern is populated first into the payload frame, as opposed to non-special patterns, in which the least significant bit is populated first.
- Page 223 BERT Setup - RX Filter selection UDP/TCP: Input Source Port and Destination Port. BERT Setup - RX Filter selection Go back to top Go back to TOC 13.2.1.2 Traffic Settings Traffic Tab The user configures the traffic profile for the stream, including traffic flow, frame size, frame type, and transmit rate. Traffic Flow: Select from the following traffic flows: Constant: The selected frame is transmitted continuously according to the selected bandwidth %.
- Page 224 Frame Size (bytes): Enter the frame size when a Layer 2, 3, or 4 BERT is selected Frame size configuration is not available for Layer 1 BERT Frame sizes can be from 64 bytes to 1518 bytes, in addition to jumbo frames up to 10000 bytes BW (Transmit Bandwidth): Configure the transmit rate for the test When traffic flow is equal to Burst, two burst bandwidths are configured with burst time When traffic flow is equal to Ramp, starting and an ending bandwidth are configured along with the...
- Page 225 BERT Setup - Injection Error Error Injection After pressing Start, error injection can be enabled by pressing the Error Inj. button on the right side of the screen. Go back to top Go back to TOC 13.2.1.4 Starting/Stopping a BERT Once all configurations have been made, the user can start the BERT test (press the Start icon on the top right section of the screen).
- Page 226 Once the far-end unit has been looped back, start the test by pressing the Start button. When the all of the selected test are completed, the BERT test suite will stop automatically. Once all tests have been completed and there is no need to test again, go back to the Control tab, and press the Loop Down button.
- Page 227 BERT Results - Errors Go back to top Go back to TOC 13.2.2.3 Events Events tab: A time stamped record or log of anomalies, alarms, test status (start/stop) and test application are displayed. BERT Results - Events Go back to top Go back to TOC 13.2.2.4 Traffic Traffic tab: The following Traffic statistics are displayed: Frame type: Test and non-test frames...
- Page 228 BERT Results - Traffic Distribution Go back to top Go back to TOC Frames tab: The following Frame distribution statistics are displayed in Count (#) and Percentage (%): Received (RX) frames: Total frames Test frames VLAN tagged frames Q-in-Q VLAN stacked frames Non-test frames Transmitted (TX) frames: Total frame - Total # frames transmitted...
- Page 229 Layer 2 Unicast frames: Number of Unicast frames received without FCS errors. Layer 2 Broadcast frames: Number of Broadcast frames received without FCS errors. Broadcast frames have a MAC address equal to FF-FF-FF-FF-FF-FF. Layer 2 Multicast frames: Number of Multicast frames received without FCS errors. BERT Results - Traffic Type Go back to top Go back to TOC Frame Size tab: The following Frame distribution statistics are displayed in Count (#) and Percentage (%):...
- Page 230 13.2.2.5 Rates Rates tab: Rate statistics are displayed in a graph format. Tap on either gauge to see rate details in table form. The table shows transmitted (Tx) and received (Rx) current, minimum, maximum and average frame rates (FPS) and Data Rates (Mbps).
- Page 231 BERT Results - Delay Go back to top Go back to TOC 13.2.2.7 Alarms Alarms tab: The following Alarms (Current and Total) are displayed: LOS: Loss of Signal LOS Sync: Loss synchronization Pattern Loss: Indicates errors related to test pattern Service disruption associated with loss of signal: Current: Duration of the current service disruption Total: Total accumulated duration of the service disruptions...
- Page 232 BERT Results - Signal Go back to top Go back to TOC RXT-6200_RXT6000e_Module_Manual Page 232 of 387...
- Page 233 13.3 RFC 2544 Conformance Testing Overview Setup - Standard Mode Header Settings Frames Settings Threshold Settings Peer-to-Peer Asymmetric Testing Throughput Settings Latency Settings Frame Loss Settings Burst Settings Starting / Stopping a RFC2544 Measurement Results - Standard Mode Status Summary Signal Events Latency / Jitter...
- Page 234 RFC 2544 Setup - Layer 2 parameters Go back to top Go back to TOC 13.3.1 Setup - Standard Mode Unless otherwise noted, the Frame Header and related setups are identical to the setups described in the BERT Application above. A summary of the RFC 2544 setup options are outlined below. 13.3.1.1 Header Settings RFC 2544 Profile: Load a previously configured test profile or create a new profile from existing settings.
- Page 235 Test: Select the test layer to perform the test. Options are Layer 2, Layer 3, and Layer 4. Frame Type: Select the Ethernet frame type for Layer 2, Layer 3 or Layer 4. 802.3 Raw (IEEE 802.3 frame without LLC) - Not available when Layer 3 is selected 802.3 LLC (IEEE 802.3 frame with LLC header) 802.3 SNAP (IEEE 802.3 frame with SNAP header) Ethernet II (DIX) (named after DEC, Intel, and Xerox, this is the most common frame type today)
- Page 236 RFC 2544 Setup - MAC address editing Data Tab: No payload selection is possible. The payload area is populated with a VeEX signature field and other proprietary data. RX Filter Tab: Depending on test layer, allows the user to filter streams by:...
- Page 237 MPLS Tab: MPLS label, CoS priority settings, TTL, and S-bit fields are configured for available MPLS tags. Please refer to the BERT application for more details. IP Tab: User configures the source and destination IP addresses. The user can also configure the following IP header fields; IP TOS (for quality of service testing), TTL, fragment offset byte, and the protocol field.
- Page 238 User enables or disables threshold settings for the throughput and latency tests. When enabled, threshold settings can be configured for all of the test frames selected in the frame settings tab. A Pass/Fail criteria will be applied when the threshold settings are enabled. For example, if the throughput threshold value for a 64 byte frame is configured for 80%, then a Pass criteria is assigned if the throughput rate is 80% or better.
- Page 239 Asymmetric Control Asymmetric Testing Setup Partner Address: Select MX Discovered or User Defined. For instructions and further information on the MX Discovered and User Defined options, please see 13.5.1.2 MX Discover and Control. Mode: Select an asymmetric test configuration: Asymmetric Up: Tests traffic in the upstream direction (local to remote direction). Asymmetric Down: Tests traffic the downstream direction (remote to local direction).
- Page 240 Throughput tab: Max Rate: Up to 100% of the negotiated line rate. The default value is 100%. This is the maximum transmit rate to perform the throughput test for each test frame size. The user may configure this rate as a % of the total line rate or in Mbps. For example if the user configures the Max Rate to be 90% and the negotiated line rate of the link is 100Mbps, then the maximum transmit rate will be 90Mbps or 90% of the line rate.
- Page 241 RFC 2544 Setup - Latency Settings Go back to top Go back to TOC Frame Loss tab: Max Rate: Up to 100% of the negotiated line rate. The default value is 100%. This is the maximum transmit rate to perform the frame loss test for each test frame size. The user may configure this rate as a % of the total line rate or in Mbps.
- Page 242 Burst (Back-to-Back) tab: Max Rate: The default value is 100%. In the burst test, frames are always transmitted at the maximum rate for a given minimum and maximum burst duration. Minimum Duration: Selectable in the range 2 to 999 seconds. Default value is 2 seconds. This is the duration of the first burst.
- Page 243 mode to manual Enter the MAC and/or IP address of the far-end unit Send the loop up command by pressing Loop Up Once the far-end unit has been looped back, start the test by pressing the Start button. When the all of the selected test are completed, the RFC 2544 test suite will stop automatically.
- Page 244 Number of bytes Pause Frames: Total number of transmitted and received ethernet pause flow-control frames. RFC 2544 Results - Summary Go back to top Go back to TOC Signal tab: The Signal tab (fiber ports only) displays the optical level measured by the SFP or XFP transceiver. RFC 2544 Results - Signal RXT-6200_RXT6000e_Module_Manual Page 244 of 387...
- Page 245 RFC 2544 Results - Signal (page 2) Go back to top Go back to TOC Events tab: A time stamped log of each test is displayed. RFC 2544 Results - Events Go back to top Go back to TOC The Throughput tab displays the maximum throughput rate of the link under test. Results are displayed in graphical and table formats.
- Page 246 RFC 2544 Results - Throughput (Tx Graphical) RFC 2544 Results - Throughput (Summary Table) RFC 2544 Results - Throughput (Test Log Table) Go back to top Go back to TOC Latency and frame jitter measurements results are displayed in the following formats. Use the drop-down menu to RXT-6200_RXT6000e_Module_Manual Page 246 of 387...
- Page 247 select the Latency format: Graphical: Latency results displayed in line graph form (Latency [us] vs Frame size [bytes]). Summary and Test log tables display: byte size Latency (us): Round trip delay latency. Rate (%): Percentage of frames transmitted. Data rate used for latency test. Pass/Fail test status.
- Page 248 RFC 2544 Results - Latency (Test Log) RFC 2544 Results - Latency (Jitter Graphical) RFC 2544 Results - Latency (Jitter Summary) RXT-6200_RXT6000e_Module_Manual Page 248 of 387...
- Page 249 RFC 2544 Results - Latency (Jitter Test log) Go back to top Go back to TOC Frame Loss tab: Frame loss displays the percentage of frames not received. Use the drop-down menu to select the Frame Loss format: Summary and Test log tables display test frame length, byte size, frame loss (%) from received traffic, and rate (%) transmitted.
- Page 250 RFC 2544 Results - Frame Loss (Graphical) RFC 2544 Results - Frame Loss (Test log) Go back to top Go back to TOC Burst tab: Burstability (back-back) results are the number of frames successfully transmitted/received at the line rate. It is displayed in the following formats: Summary table: Displays Average Frame Count received for each test frame length Test log table: Displays Average Frame Count and Duration (seconds) for each test frame length RXT-6200_RXT6000e_Module_Manual...
- Page 251 RFC 2544 Results - Burstability (Summary) RFC 2544 Results - Burstability (Test Log) Go back to top Go back to TOC 13.3.3 Saving RFC 2544 Results Once the test has been stopped the results can be saved by pressing the Save key on the VePAL’s keypad. The results will be saved and named automatically.
- Page 252 Setup For Header, Frames, Thresholds, Throughput, Latency, Frame Loss, and Burst, please refer to Setup - Standard Mode. Background - General # of Back. Streams: From 1 to 7 streams RFC 2544 Test Stream (%): This is the max rate set in frame loss Background Stream # (%): Allocated Bandwidth per Stream: The total bandwidth for all streams cannot exceed 100% Total (%): Sum of all stream rates in %...
- Page 253 Setup - Background - Traffic Starting/Stopping an Advanced SLA Mode Please see Starting/Stopping a RFC 2544 Test for information on starting/stopping the test. Go back to top Go back to TOC 13.3.5 Background Results - Advanced SLA Mode For information on Global and Per Stream Results in Advanced SLA Mode, please refer to 13.5.2 Throughput Results.
- Page 254 Background Results - Per Stream Go back to top Go back to TOC RXT-6200_RXT6000e_Module_Manual Page 254 of 387...
- Page 255 Event Log Overview V-SAM (VeEX Service Activation Methodology) is an automated Ethernet service activation test feature conforming to the ITU-T Y.1564 standard, created to address and solve the deficiencies of RFC 2544: • RFC 2544 was limited to test at the maximum throughput line rate for a single service. SAM is able to...
- Page 256 The purpose of the SAM test suite is to verify that the service is compliant to its Bandwidth Profile and Service Acceptance Criteria. The test is broken down into two phases: Phase 1: Service Configuration test: The services running on the same line are tested one by one to verify the correct service profile provisioning.
- Page 257 Service Bandwidth Profile Phase 2: Service Performance Test Services running on the same line are tested simultaneously over an extended period of time, to verify network robustness. Service Acceptance Criteria (SAC) including Frame Transfer Delay (FTD), Frame Delay Variation (FDV), Frame Loss Ratio (FLR) and Availability (AVAIL) are verified for each service.
- Page 258 V-SAM - Setup - General (Page 1) V-SAM - Setup - General (Page 2) CIR Test Configuration CIR Test Config.: Select Simple Test, Step Load Test, or Simple and Step. Simple Test: Starts the tests at the CIR. Step Load Test: Starts the test below the CIR and continues in steps until it reaches the CIR. Simple and Step Load Test: Step Load Test performs only if the Simple Validation test fails.
- Page 259 CIR Test Config Go back to top Go back to TOC 13.4.1.1 Header Settings Service #: Select a service to configure Service Name: Assign a name to the service if desired. Frame Size Type: Fixed or EMIX (1GE only). A fixed frame size is chosen as default Frame Size: For Fixed Traffic Flow: Input a fixed frame size within the range of 64-10000 bytes by tapping the value box.
- Page 260 V-SAM Setup - Services - Header Settings V-SAM Setup - Services - EMIX Frame Size Settings V-SAM Setup - Services - PBB Settings Go back to top Go back to TOC 13.4.1.2 Service Attributes Bandwidth Profile Parameters RXT-6200_RXT6000e_Module_Manual Page 260 of 387...
- Page 261 The Bandwidth Profile specifies how much traffic the customer is authorized to transmit and how the frames are prioritized within the network. In the Bandwidth table, the user specifies the following bandwidth criteria: CIR: Committed Information Rate. This is the guaranteed maximum rate at which the customer can send frames that are assured to be forwarded through the network without being dropped.
- Page 262 V-SAM Setup - Services - Service Attributes Enabling/Disabling Tests A check next to the parameters in the Service Attributes table indicates that the test for the corresponding service is set to run. Tap on the box to remove the check and cancel the test for that service.
- Page 263 Copying Services Copying Services Tap on the Copy button on the bottom of the Header or Service Attributes tabs to copy frame parameters specific to that tab to other services. For example, pressing Copy on the Header tab will only transfer header parameters to other services. MX Discover and Control Settings For instructions on how to loop up/down the test set with another test set or device, please refer to 13.5.1.2 MX...
- Page 264 Configuration Test The Config. Tests tab lists the Pass/Fail status of each service and test. Tapping on the table brings up a screen with CIR, CIR/EIR and Policing Test results for the chosen Service. CIR, CIR/EIR Test, and Policing tabs display min, mean, and max values for IR Mbps, FTD, FDV, Frame Loss Count, and Frame Loss Ratio (%).
- Page 265 CIR/EIR test: The test passes if the received IR value is between the CIR (minus the margin allowed by the FLR) and CIR+EIR. Policing Test - Service 1 Policing test: The test passes if the received traffic rate is at least at the CIR (minus the margin allowed by the FLR) but does not exceed the allowed CIR+EIR.
- Page 266 Performance Test The Service # tabs display min, mean, and max values for IR Mbps, FTD, FDV, Frame Loss Count, Frame Loss Ratio (%), Availability, and Errored Frame Count. Pass/Fail/Pending status of each test is displayed on the top of each table.
- Page 267 Event Log Go back to top Go back to TOC RXT-6200_RXT6000e_Module_Manual Page 267 of 387...
- Page 268 13.5 Throughput Testing (Multiple Streams) Overview: The throughput application (or the multiple streams application) performs the following measurements: throughput performance, frame loss analysis, delay analysis, frame/packet arrival analysis, received traffic type analysis, and received traffic frame size analysis. On the transmit side, the throughput application allows for the configuration of up to 8 traffic streams with their own MAC and IP addresses, VLAN tags (up to 3 per stream), bandwidth/rate, frame size, and L2 and/or L3 quality of service (QoS) parameters.
- Page 269 Stream #: Allocated Bandwidth per Stream: The total bandwidth for all streams cannot exceed 100%. Total (%): Sum of all stream rates in %. Throughput Setup - General Settings Page 2: #of Streams: From 1 to 10 streams. # of Streams can be specified either on Page 1 or Page 2. It will be reflected on both pages.
- Page 270 Throughput Setup - General Settings Page 2 Throughput - General Settings Delay Measurement Mode Multiple Streams All streams are configured for the same test layer - if Layer 2 is selected, all streams will be Layer 2 traffic. Go back to top Go back to TOC 13.5.1.2 MX Discover and Control Before proceeding with MX Discover or Control, be sure to assign an IP address to each test port.
- Page 271 MX Discover enables the test set to discover other VeEX VePal test sets and devices with an assigned IP address on the same subnet. To discover other devices using MX Discover: Tap on the MX Discover button and then press Discover.
- Page 272 Remote Partner Control The Peer-to-Peer option is available only for RFC 2544 testing. For more information on Peer-to-Peer mode, please 15.3.1.4 Peer-to-Peer and Asymmetric Testing. 13.5.1.3 Per Stream Configurations MAC Setup MAC configuration in the Throughput section features MAC flooding for buffering verification and performance testing of Ethernet switches.
- Page 273 Multiple Streams - MAC/IP Address Setup If all of the streams are going to the same far-end unit, then the MAC/IP destination addresses must be the same on all of the streams. If any of the traffic streams are going to more than one far-end unit then ensure the correct MAC/IP destination addresses are configured for the respective streams.
- Page 274 Go back to top Go back to TOC 13.5.1.5 Error Injection Settings (Per Stream Configuration) - (Only in 10GE) Error injection can be performed during test. The type of errors and error injection are configured in the Error Injection tab. Once the test is running, error injection can be performed by pressing the Error Inject button on the right side of the screen.
- Page 275 (continuous) can be selected. Alarm Length: 1s, 10s, or 100s. Throughput Alarm Injection Setup Go back to top Go back to TOC 13.5.1.7 Summary The summary screen lists the source, destination and VLAN information of each stream. Tap on the appropriate box of each tab to reconfigure the source, destination, or VLAN information if desired.
- Page 276 Throughput Test - Summary (IP List) Throughput Test - Summary (VLAN List) Throughput Test - Summary (Port List) RXT-6200_RXT6000e_Module_Manual Page 276 of 387...
- Page 277 Go back to top Go back to TOC 13.5.1.8 Starting/Stopping a Throughput (Multiple Streams) Test Once all configurations have been made, the user can start the Throughput test (press the Start icon on the top right section of the screen). The following are three scenarios of how to prepare and start the unit for Throughput testing. If testing on the fiber ports, make sure the LASER is turned On before starting the test.
- Page 278 Throughput Results - Global Stream Summary Go back to top Go back to TOC The Aggregate screen displays these parameters: Line Rate (Mbps): Negotiated rate of the interface (10M, 100M, or 1000M). This value is always fixed since it depends on the maximum capacity of the link under test, hence the test interface that is configured. Framed Rate: (Payload + MAC/IP Header + VLAN Tag + Type/Length + CRC) / (Payload + Total Overhead) * Line Rate % (in Mbps).
- Page 279 Throughput Results - Global Signal Throughput Results - Global Signal (page 2) Go back to top Go back to TOC The Global Errors screen displays the Current and Total error count of all streams: FCS/CRC: Number of received frames with an invalid Frame Check Sequence (FCS) IP Checksum: Invalid IP Frame Check sequence TCP/UDP Checksum (Layer 4 only) Jabber frames: Number of received frames larger than 1518 bytes containing an invalid FCS...
- Page 280 Throughput Results - Global Errors Go back to top Go back to TOC The Global Alarms screen displays the Current and Total alarm count of all streams: LOS: Loss of Signal LOSync: Loss synchronization Service disruption associated with loss of signal: Current: Duration of the current service disruption Total: Total accumulated duration of the service disruptions Min/Max: Minimum and maximum duration of the service disruption events...
- Page 281 The Global Events screen displays the Time, Event Type, Number of Events, and Test Type. Throughput Results - Global Events The Global Traffic screen displays: Frame Type of all streams Traffic Type of all streams Frame size of all streams Throughput Results - Global Traffic Summary Go back to top Go back to TOC The Global Delay tab: Delay measures the interpacket gap, start of the frame, and preamble duration.
- Page 282 Throughput Results - Global Delay Go back to top Go back to TOC 13.5.2.3 Per Stream Results The Per Stream tab displays the same type of statistics as seen in Global Results, but for each stream. For descriptions of the parameters in each tab, with the exception of Rates, please refer back to the corresponding section 13.5.2.2 Global/Aggregate Results.
- Page 283 The Per Stream Errors screen displays the Current and Total error count of each stream. Bit: Indicates errors related to test pattern (Bit Error or LSS [Pattern Loss]) BER: Bit Error Ratio FCS/CRC: Number of received frames with an invalid Frame Check Sequence (FCS) IP Checksum: Invalid IP Frame Check sequence TCP/UDP Checksum (Layer 4 only) Jabber frames: Number of received frames larger than 1518 bytes containing an invalid FCS...
- Page 284 Throughput Results - Events per SDT Go back to top Go back to TOC The Per Stream Events screen displays a Date and Time stamped record of bit errors, alarms and other anomalies pertaining to each stream. Throughput Results - Events per Stream Go back to top Go back to TOC The Per Stream Traffic screen displays the frame type and frame size distribution pertaining to each stream.
- Page 285 Throughput Results - Traffic per Stream Go back to top Go back to TOC The Per Stream Delay screen displays the frame delay information pertaining to each stream. The Histogram shows the sampling points for the delay. Round Trip Delay Results and Histogram: Throughput Results - Delay per Stream RXT-6200_RXT6000e_Module_Manual Page 285 of 387...
- Page 286 Throughput Results - Round Trip Delay Histogram One Way Delay Results and Histogram (Table and Graph): Throughput Results - Delay per Stream (One Way Delay) Throughput Results - One Way Delay Histogram Graph RXT-6200_RXT6000e_Module_Manual Page 286 of 387...
- Page 287 Throughput Results - One Way Delay Histogram Table Go back to top Go back to TOC The Per Stream Rate screen displays the frame rate and data rate pertaining to each stream. Throughput Results - Rates per Stream RXT-6200_RXT6000e_Module_Manual Page 287 of 387...
- Page 288 Throughput Results - Rates per Stream (Rate Details) Go back to top Go back to TOC 13.5.2.4 Saving Throughput (Multiple Streams) Results Once the test has been stopped the results can be saved by pressing the Save key on the keypad. The results will be saved and named automatically.
- Page 289 13.6 Ethernet OAM Testing Ethernet OAM provides automatic defect detection, fault management and performance monitoring tools for network links and end-to-end Ethernet Virtual Circuits (EVC). The OAM service supports IEEE 802.3ah, IEEE 802.1ag, and ITU-T Y.1731. Go back to top Go back to TOC 13.6.1 OAM Setup 13.6.1.1 Link Level 802.3ah OAM Setup 802.3ah functions include:...
- Page 290 Link OAM Setup 802.3ah OAM Tap on the check box to start 802.3ah protocol testing. Transmission of OAM PDUs starts as soon as the box is checked. OAM Mode Select Active or Passive mode from the drop-down menu. Active and passive mode determines the type of actions the test set will take.
- Page 291 OAM Mode Active/Passive Actions OAM Mode - Acceptable Active/Passive Combinations Notice that each device can be placed in any mode as long as the remote and local device are not both in passive mode. Discovery Capabilities: Capabilities advertised during discovery process Remote Loopback Link Events: Supported, but no stateful MIB Retrieval: Can be advertised but is not supported in current release...
- Page 292 OAM - Service Level OAM (Page 1) Service Level OAM Configuration Parameters MD Name: Name of the Maintenance Domain (only for 802.1ag) MA Name: Enter the name of the 802.1ag MA or Y.1731 MG MD Level: Maintenance domain level (0 to 7) MEP ID: End point identifier (1 to 8191) Primary VLAN ID: VLAN ID associated with the MA or MEG Direction...
- Page 293 Some terms differ between the two protocols. The chart below describes the differences. Definition Equivalencies Maintenance Point Roles Go back to top Go back to TOC OAM Services Setup Under the same tab, OAM Services pertaining to 802.1ag and/or Y.1731 can be enabled. The tests listed include: Continuity Check (CCM) RXT-6200_RXT6000e_Module_Manual Page 293 of 387...
- Page 294 Loopback (LBM/LBR) Link Trace (LTM/LTR) Loss Measurement (LMM/LMR) (Y.1731 Only) Delay Measurement (DMM/DMR) (Y.1731 Only) General Setup To run any 802.1ag/Y.1731 Tests, fill out the listed parameters and press Start. In the case of CCM, select Enable from the drop-down menu to run that test. Details on individual test parameters will be listed in the specified section. 802.1ag/Y.1731 Connectivity Fault Management Functions 802.1ag/Y.1731 Connectivity Fault Management Functions supported by the test set are as listed: Fault Detection –...
- Page 295 CCM Message Format Service Level OAM (Page 1) CCM Configuration Parameters Enable: Enable sending Continuity Check messages Disable: Disable sending Continuity Check messages Priority: 802.1p priority in the CCM VLAN Tag Tx Interval: Choose from the supported CCM intervals: 1 s, 10 s, 1 min, 10 min. Link Trace and Loopback Messages RXT-6200_RXT6000e_Module_Manual Page 295 of 387...
- Page 296 OAM - Service Level OAM (Page 2) Link Trace Messages (LTM/LTR) LTM (Link Trace Message) Multicast messages are transmitted on demand to a destination MAC address. All MIPs and destination MEPs respond with LTR (Link Trace Reply) and forward the LTM on to its destination. LTM Diagram Link Trace Message Format RXT-6200_RXT6000e_Module_Manual...
- Page 297 Link Trace Response Format Loopback Message (LBM/LBR) LBM (Loopback Message) are unicast messages transmitted on demand to a destination MAC address. A destination address responds with an LBR (Loopback Reply Message). LBM Diagram Loopback Message Format Link Trace and Loopback Message Config. Parameters Destination MEP: Sends LTM/LBM to the destination MEP as configured on Page 1.
- Page 298 Y.1731 Performance Management Functions OAM - Service Level OAM (Page 3) Loss (LMM/LMR) and Delay Measurement (DMM/DMR) Configuration Parameters Destination MEP: Sends LMM/DMM to the destination MEP as configured on Page 1 MAC: Sends LMM/DMM to a destination MAC address Priority - 802.1p priority in the LMM/DMM VLAN Tag Destination MAC - Configure the destination MAC address used for the LMM/DMM.
- Page 299 LMM frames contain frame counters. Delay Measurement On demand OAM for measuring Frame Delay (FD) and Frame Delay Variation (FDV): TxTimeStampf = Timestamp transmission of DMM frame RxTimef = Reception time of the DMM frame RxTimeb = Reception of DMR frame Two-way ETH-DM: DMM frame (Unicast DA or Multicast Class 1 DA for multipoint measurement) &...
- Page 300 Mode: Lists Active or Passive mode configuration. Supported and unsupported capabilities advertised during Discovery are listed, including: Unidirection, Link Events, Remote Loopback, MIB Retrieval, and MTU Size. OAM - Link - Discovery (Page 2) Vendor SPI and OUI: Organization Unique identifier and Vendor specific information (similar to MAC address fields).
- Page 301 OAM PDU OAM PDU Transmitted and received 802.3ah OAM PDU are displayed with other Link OAM statistics: Information: Information OAM PDU acts as a "heartbeat" message. Discovery must be restarted if no OAM PDU is received after 5 seconds. Unique and Duplicate Events are Threshold crossing events not supported in the current test set release. Number of Loopback Control frames.
- Page 302 Remote MAC: MAC address of the remote MEP. RDI: The CCM received contains the RDI flag set. LOC: The MEP detects loss of connectivity. XCON: Possible cross-connect, the CCM received could be from another MA. UNEXP: Unexpected MEP ID or non matching CCM interval. Alarm: A fault alarm is triggered if a defect is present for a time period of 10s.
- Page 303 MAC: MAC address of the responder TTL: TTL field on the response, indicated how many hops have been traversed Flags: If set, indicates that only MAC addresses learned in a Bridge's Filtering Database, and not information saved in the MIP CCM Database, is to be used to determine the Egress Port Y.1731 Performance Management Functions Results OAM - Service - LMM OAM - LMM Message...
- Page 304 OAM - DMM Message OAM DMM Parameters DMM Status: Lists status (In progress, Fail, or Complete) Delay Samples: Number of frames transmitted Average Delay: Average round trip delay over the number of delay samples Average Variation: Average round trip delay variation over the number of delay samples Last Delay: Last round trip delay value measured Last Variation: Last round trip delay variation value measured Go back to top Go back to TOC...
- Page 305 13.7 Auto Profile Scripting The Auto Scripting application allows users to run tests with pre-configured 1GE/10GE/40GE/100GE Throughput or BERT profiles in sequence for a certain duration. This allows for a certain degree of automation for lab and field applications. The pre-configured profiles can be either created with ReVeal and loaded to the unit, or created on the unit itself.
- Page 306 Test Mode Selection 3. When the shortcut is selected from the Test Mode selection window, the Auto Script application is automatically launched. Auto Script Main Menu Selecting Profiles Pre-configured profiles appear in each of the Profile pull down menus. The user can select any profile available one or more than one time.
- Page 307 Pre-configured Profiles User can select up to 10 profiles, each with a different test duration. Selected Profiles Profile Test Duration: The duration of each profile can be in seconds, minutes, hours, or days RXT-6200_RXT6000e_Module_Manual Page 307 of 387...
- Page 308 Profile Test Duration Error handling during Test: The user can choose to Continue the auto scripting test if errors occur in any of the profiles by selecting “Continue”. Or they can choose to stop the auto script by selecting “Exit”. Error Handling Status of Profile Test: At the end of each profile tests, the status will be indicated by the soft LEDs next to each profile.
- Page 309 Status before testing Test Running: To identify the profile being tested, progress of the test, and remaining time of each profile being tested, Profile Name, Progress and RT are scrolled on the bottom bar one after the other for a couple of seconds each time. Bottom Bar - Profile Name Progress: Progress (1 of X) profiles being tested is displayed on the bottom bar.
- Page 310 Bottom Bar - Progress Remaining Time is displayed on the bottom bar. Bottom Bar - Remaining Time End of Test At the end of the auto scripting test a “Profile Script Completed” message is displayed on the bottom bar. RXT-6200_RXT6000e_Module_Manual Page 310 of 387...
- Page 311 Bottom Bar - Profile Script Completed At the end of the auto script test the soft LEDs will display the overall status of each profile test that was carried out. Status at the end of the test Go back to top Go back to TOC RXT-6200_RXT6000e_Module_Manual Page 311 of 387...
- Page 312 13.8 Monitor (Pass Through)(RXT-6000e Only) Pass through monitor mode enables the test set to be used for long term in-service testing. This allows for bi-directional monitoring of up to 10GE Ethernet line rate on the two 10GE SFP+ ports or the two 10/100/1000T RJ45 ports. The Pass Through functionality allows: In-line traffic monitoring in both directions Long or short term network monitoring for troubleshooting network traffic problems...
- Page 313 Monitor Mode Results Monitor Mode Results features the same statistics as BERT Results. Please see 15.2.2 BERT Results. The Status screen displays the following statistics: Utilization (%) CRC Errors Service Disruption (ms) Go back to top Go back to TOC 13.9 Loopback Mode The Loopback application in the main menu allows the user to establish a manual loopback on the test set.
- Page 314 Press Start to begin loopback. indicates that loopback is in progress. The Results tab displays current test results. Please see 13.2.2 BERT Results for information on the Results tabs. Loopback Setup Loopback In Progress Go back to top Go back to TOC RXT-6200_RXT6000e_Module_Manual Page 314 of 387...
- Page 315 14.0 PCS 14.1 Setup 14.1.1 Tx Lane Mapping and Skew PCS to CAUI lanes configurable mapping: Defines the alignment markers ID that will be assigned to each lane Default, random or manual setting Receivers must be able to reorder and reassemble any mapping of PCS lanes into single stream Lane Skew generation (up to 16000 bits time) Enter relative delay that will be introduced for the PCS lane pair (CAUI lane) Stresses the de-skew function on the receiver side...
- Page 316 PCS Setup - Tx Alarm/ Error Injection Go back to top Go back to TOC 14.2 Results 14.2.1 Summary PCS Results - Summary Go back to top Go back to TOC 14.2.2 Rx Lane Skew RXT-6200_RXT6000e_Module_Manual Page 316 of 387...
- Page 317 PCS Results - Rx Lane Skew Go back to top Go back to TOC 14.2.3 Alarms/Errors PCS Results - Alarms/Errors Go back to top Go back to TOC 14.2.4 Events RXT-6200_RXT6000e_Module_Manual Page 317 of 387...
- Page 318 PCS Results - Events Go back to top Go back to TOC 14.3 Saving PCS Results Once the test has been stopped the results can be saved by pressing the Save key on the platform's keypad. A window will open giving the option of naming the results file. Enter the desired name for the file and tap apply. The results will be saved.
- Page 319 15.0 OTU3/ OTU4 Test App Follow the steps to assign the test module to a test tab as described in RXT-1200 Platform Manual of this manual. Select the OTU4 Testing Application and press Accept. The module will be configured and the progress will be displayed on the unit's screen. The OTU4 home page will be displayed with links to Setup, OTN Results and OTN Tools.
- Page 320 15.1 Setup The following Signal parameters can be configured under the Setup tab on the OTU4 Home screen: The parameters are for TX and RX Coupled - TX and RX configurations are grouped as one block; TX and RX will have identical configuration.
- Page 321 OTL Tx Lane Mapping and Skew Go back to top Go back to TOC 15.1.2 Heirarchy Tap the Heirarchy tab to enter the Heirarchy configuration screen. The following parameters are displayed: Network Type: OTN Test Rate: OTU4 (111.819 Gbits/s) Scrambler: On/Off FEC: On/Off Tx Clock Source: Internal: The clock for the transmitter is derived from the internal clock.
- Page 322 OTU4 Heirarchy Setup (Received Clock) OTU4 Heirarchy Setup (External Clock) Go back to top Go back to TOC 15.1.3 Data Tap the Data tab to configure the Test Data Settings. The following parameters are available: Test Data Mode: PRBS Pattern RXT-6200_RXT6000e_Module_Manual Page 322 of 387...
- Page 323 PRBS Pattern (TX and RX): Pseudo Random Bit Sequences (PRBS) defined by ITU-T 0.150 and 0.151 standards, fixed words and 24-bit or 32 bit user defined patterns are available. Avaialble patterns: 2^31-1, 2^23-1, 2^9-1 Invert (Logic pattern inversion): On / Off OTU4 Setup - Test Data Settings Go back to top Go back to TOC RXT-6200_RXT6000e_Module_Manual...
- Page 324 16.0 CPRI Testing Overview Interface Specifications CPRI Testing Test Areas Test Ports Test Modes CPRI Layer 2 Framed Testing Setup Results CPRI Round Trip Delay Control Words Frame Capture CPRI Overview CPRI stands for Common Public Radio Interface This protocol has been developed by Ericsson AB, Huawei Technologies Co. Ltd, NEC Corposration, Alcatel Lucent and Nokia Siemens It is an industry cooperation aimed at defining a publicly available specification for the key internal interface of radio base stations between the Radio Equipment Control (REC) and the Radio Equipment (RE)
- Page 325 Go back to top Go back to TOC Physical Layer The following Line bit rates are defined from the standard: Line Coding: 8B/10B line coding shall be used for serial transmission according to IEEE 802.3-2005, clause 36. (Same encoding as used for Gigabit Ethernet and Fibre Channel) Bit Error Correction/Detection: The physical layer is designed in such a way that a very low bit error ratio can be achieved without expensive forward error...
- Page 326 16.2 CPRI Testing Test Ports and Modes RXT-6200 RXT-6200 RXT-6000e RXT-6000e RXT-6200_RXT6000e_Module_Manual Page 326 of 387...
- Page 327 Go back to top Go back to TOC RXT-6200_RXT6000e_Module_Manual Page 327 of 387...
- Page 328 16.3 CPRI Layer 2 Framed Testing CPRI Layer 2 Main Menu Go back to top Go back to TOC 16.3.1 Setup Setup Menu Go back to top Go back to TOC Configure the following: Signal: Hierarchy: CPRI Rate selection from 614.4Mbps to 6.144Gbps. 4.9 and 6.1 Gbps rate requires compatible SFP+. Hierarchy RXT-6200_RXT6000e_Module_Manual Page 328 of 387...
- Page 329 Interface: CPRI Clock Selection Internal/External (Master mode only). Slave uses RX signal recovered clock. Master: Internal, External (1.5MHz, 2MHz, 1.5 Mbps, 2Mbps, 10MHz), Or Atomic 10MHz (Atomic clock option required) For External clock connection use the unit's SMA CLK port. Interface Payload: CPRI Layer 2 configuration CPRI Emulation Type: CPRI Master emulation (Radio Equipment Controller Emulation)
- Page 330 capabilities Payload Pattern: Independent TX/RX test Pattern selection. PRBS 2^23-1 (normal or inverted) or PRBS 2^31-1 (normal or inverted) Pattern Go back to top Go back to TOC Measurements: Measurements Setup RXT-6200_RXT6000e_Module_Manual Page 330 of 387...
- Page 331 Mode: Manual, Timed, Auto Timed: Duration: Enter the time Units: Select seconds, minutes, hours, days Auto: Start time, and Duration Interval Save: Test result automatically saved at configurable interval ON: Set the Save Interval (in minutes). Tap the box to enter the value. OFF: To opt to not save Go back to top Go back to TOC General:...
- Page 332 Gate Time: Gate time setting determines the duration of the measurement. Configurable from 20 to 10000 ms. SDT Setup Enable CPRI and/or BERT trigger events In the CPRI and BERT Tab enable (ON) or disable (OFF) the Alarms and Errors used to determine Service Disruption events. At least one error or alarm must be enabled for SDT to trigger.
- Page 333 Go back to top Go back to TOC Alarm and Error Injection Alarm Injection: Each alarm can be set to Continuous or Count CPRI Alarms: LOS: Trigger a Loss of Signal event (Laser OFF) LOF: Trigger a Loss of Framing event. The Z.0.0 control byte is modified to send an invalid byte of value 0xff SDI: Service Defect Indication is transmitted in the Control bytes for L1 inband protocol RAI: Remote Alarm Indication is transmitted in the Control bytes for L1 inband protocol RLOS: Remote Loss of Signal is transmitted in the Control bytes for L1 inband protocol...
- Page 334 Press Start to start the test. Go back to top Go back to TOC 16.3.2 Results Results Summary Go back to top Go back to TOC Alarms and Errors These include Hyperframe Synchronization indication and BFN (NodeB Radio Frame) Synchronization indication. Green indicates no alarm Red indicates current alarm Grayed out indicates that the measurements are masked by an higher layer alarm or error...
- Page 335 Go back to top Go back to TOC CPRI: LOS: Loss of Signal detection in seconds Code: 8b/10b code violation detected count and rate LOF: Loss of framing seconds detected if invalid Z.0.0 sync byte is received HLOF: Loss of Hyperframe synchronization seconds BLOF: Loss for Basic Frame (NodeB) frame synchronization seconds SDI: Service Defect Indication is detected in the Control bytes for L1 inband protocol RAI: Remote Alarm Indication is detected in the Control bytes for L1 inband protocol...
- Page 336 Go back to top Go back to TOC Signal Signal Page 1 Page 2 includes: Frequency: Measured RX signal frequency Offset: current frequency offset from the frequency measurement clock (internal or external) Min: minimum frequency offset Max: maximum frequency offset Hyperframes TX/RX: counters of Transmitted/Received Hyperframes NodeB frames TX/RX: counters of Transmitted/Received NodeB (Radio) framed Signal Page 2...
- Page 337 Signal Page 3 Histogram showing the fluctuation in RX optical signal level. Signal Page 4 Go back to top Go back to TOC Histogram Histogram showing CPRI alarms and errors events. RXT-6200_RXT6000e_Module_Manual Page 337 of 387...
- Page 338 Histogram Histogram showing BERT alarms and errors events. Histogram Page 2 Go back to top Go back to TOC Graph Graph showing CPRI Code and Bit error rate over time. Graph RXT-6200_RXT6000e_Module_Manual Page 338 of 387...
- Page 339 Graph Page 2 Go back to top Go back to TOC Event Log Logs CPRI Alarms and Errors events along with corresponding count and duration for each event. Event Log Go back to top Go back to TOC RXT-6200_RXT6000e_Module_Manual Page 339 of 387...
- Page 340 16.3.3 CPRI Round Trip Delay CPRI Standard Cable Delay Measurement reference points: Toffset = Frame offset delay between Slave RX and Slave TX T 1,4 = Frame delay between Master TX and Master RX Cable Delay (round trip) = T 1,4 – Toffset The figure below shows the definition of reference points for delay calibration (single-hop configuration): Round trip delay Measurement procedure: 1.
- Page 341 disruptions are detected and measured. SDT Results SDT Event Log Go back to top Go back to TOC 16.3.5 Control Words Display of Control words content in the 64 Subchannels. Tap on any subchannel to display Hex and Binary value of the contents. Control Words Display RXT-6200_RXT6000e_Module_Manual Page 341 of 387...
- Page 342 Byte Analyzer Byte Analyzer Go back to top Go back to TOC Frame Capture The test set must be set to Slave mode or use the Master’s ref. Clock. RXT-6200_RXT6000e_Module_Manual Page 342 of 387...
- Page 343 Capture up to 5000 Hyperframes CSV or raw frame format Compression (gzip format) Capture file written directly to USB drive Frame Capture Setup Go back to top Go back to TOC RXT-6200_RXT6000e_Module_Manual Page 343 of 387...
- Page 344 17.0 eCPRI 17.1 eCPRI Testing Overview The Common Public Radio Interface (CPRI) forum introduced a new more stringent Ethernet packet based fronthaul interface, eCPRI, due to limitations for 5G deployments based on traditional CPRI or OBSAI. To ensure that 5G network's strict requirements are met in the fronthaul, the eCPRI Transport Network requirement document establishes classes of service for data and C&M traffic.
- Page 345 CPRI Specification was written with the goal to be generic enough to support scalable rates, physical access medium type, and air interface technologies. eCPRI relies on existing standards for Ethernet/IP networking, synchronization, and security. Go back to top Go back to TOC 17.2.1 Protocol Stack eCPRI Protocol Stack* (*eCPRI Interface Specifications ver 1.2)
- Page 346 Go back to top Go back to TOC 17.2.2 eCPRI Key Features Key features of eCPRI include: 25G/10G eCPRI (Protocol ver.1) Ethernet Type: AE-FE (eCPRI) Configurable C field and message type Dual-port testing capabilities RS-FEC support Multi-stream testing up to 32 independent streams Each stream can be set with independent frame size, bandwidth, traffic profile, and QoS levels Throughput testing at Layer 2 and Layer 4 Frame sizes from 64 to 1518 bytes and jumbo frames up to 16000 bytes (Layer 2 only)
- Page 347 17.2.4 eCPRI One Way Latency Measurement The diagram below shows how eCPRI works with RXT-6000e and RXT-6200 test modules. eCPRI One Way Latency Measurement Go back to top Go back to TOC RXT-6200_RXT6000e_Module_Manual Page 347 of 387...
- Page 348 17.3 eCPRI Setup Test mode, test port(s), and network settings are required prior to performing any measurements or applications. 17.3.1 Test Port Selection Test Mode Selection This menu is accessed via the Test Port button located at the top left hand side of the screen. To select the eCPRI test: 1.
- Page 349 Go back to top Go back to TOC Port Setup Port Profile: Lock, Delete, Save, Save as..., Default, Last configuration Network Type: LAN Flow Control: Enable/Disable When flow control is enabled, the test set will respond to pause frames received by the link partner by adjusting the transmit rate.
- Page 350 The measurement and event log settings are configured in this screen. Profile: Last configuration, Delete, Save, Save as..., Default. Mode: Manual, timed, or auto mode are available. Manual mode: Starts and stops the measurements manually. Timed mode: Defines the duration of the test; after the test is started, the test will run for the configured duration and stop automatically.
- Page 351 Go back to top Go back to TOC RXT-6200_RXT6000e_Module_Manual Page 351 of 387...
- Page 352 17.4 Throughput Testing 17.4.1 Setup To access Throughput testing features, tap Throughput from the Home menu. Overview: This application is very useful in verifying the transport of traffic with different prioritization settings across a network link. The test helps verify that the network can handle high priority traffic and low priority traffic accordingly. The Throughput application performs the following measurements: Throughput performance Frame Loss analysis...
- Page 353 Throughput Header Settings: Layer 4 Profile: Load a previously configured test profile or create a new profile from existing settings. Stream #: Number of stream for which to configure the profile. Use the Prev and Next buttons to change streams. Use the General tab to configure the total number of streams.
- Page 354 Go back to top Go back to TOC MAC, VLAN, MPLS, IP, UDP, eCPRI, DATA, and RX Filter Test Pattern Configurations: To configure the MAC addresses, IP addresses, VLAN tag(s), and test pattern, tap on the frame image displayed on the screen. This brings up the configuration screens for all the header fields.
- Page 355 Set by the Priority Code Point (PCP), a 3-bit field referring to the IEEE 802.1p priority. Indicates the frame priority level from 0 (lowest) to 7 (highest); used to prioritize different classes of traffic (voice, video, data, etc.). Type: The following selections are possible: 8100 (IEEE 802.1Q tagged frame) 88a8 (IEEE 802.1ad Provider Bridging) User Defined...
- Page 356 in the label stack. TTL: Configurable in the range 0 to 255. The default setting is 128 hops. Used to decrement the time-to-live counter. Throughput Setup - MPLS configuration (Layer 4) Go back to top Go back to TOC IP Tab: Configures the destination IP address, source address and header fields. IPv4 IP Type: IPv4, IPv6 Source and Destination IP Address: The source address is fixed to the IP address from the IP setup menu.
- Page 357 IPv6 IP Type: IPv6 Source and Destination IP Address: 128-bit fields. The source address is fixed to the IP address from the IP setup menu. Traffic Class: 8-bit level used to designate priority handling of packets. Flow Label: 20-bit label used to identify packets for special handling. Next Header: 8-bit field to identify the type of header that immediately follows.
- Page 358 If any of the traffic streams are going to more than one far-end unit then ensure the correct MAC/IP destination addresses are configured for the respective streams. Go back to top Go back to TOC UDP Header Tab: Source Port: 16-bit fields used to identify the transmitter's and receiver's ports. Field has limit of 65,535. Throughput Setup - UDP Settings Layer 4 Go back to top Go back to TOC eCPRI Header Tab:...
- Page 359 Go back to top Go back to TOC Data Tab: Select a test pattern that will be encapsulated in the Ethernet frame payload (for framed mode). For both Layer 2 and 4 the following pattern is available: PRBS: 2E31 -1 (147 483 647-bit pattern used for special measurement tasks, [e.g., delay measurements at higher bit rates]) 2^23 -1 (8 388 607 bit pattern primarily intended for error and jitter measurements at bit rates of 34 368 and 139 264 kbps)
- Page 360 RX Filter Tab: Filters incoming streams. When checked, the incoming traffic flows that do not match these criterion will not be considered for test results. MAC Destination MAC Source VLAN Ethernet Type DSCP (Layer 4 only) Protocol Type (Layer 4 only) IP Destination (Layer 4 only) IP Source (Layer 4 only) Destination Port (Layer 4 only)
- Page 361 17.4.1.3 General Throughput Settings (Global Configuration) # of Streams: Up to 32 streams. Stream #: Allocated Bandwidth per Stream: The total bandwidth for all streams cannot exceed 100%. Total (%): Sum of all stream rates in %. Throughput General Setup Page 2 features One Way Delay measurement and Service Disruption Test (SDT) measurement settings.
- Page 362 SDT Measurement Trigger (>us): Any inter-frame gap that is equivalent or greater than the configured threshold will trigger the SDT measurement. This is useful if a known threshold is expected from a given network under test. For example, if the known switchover time is 50ms, the trigger can be set to a value slightly below 50ms to assure that the SDT is measured.
- Page 363 Behavior: How the alarms will be injected: Continuous or Single Burst Optical LOS Lane Selection: Checkbox appears when Type is set to Optical LOS. Throughput Error/Alarm Injection Setup Go back to top Go back to TOC 17.4.1.5 Summary The summary screen lists the MAC source, MAC destination and VLAN information of each stream. Tap the appropriate box of each tab to reconfigure the source, destination, or VLAN information.
- Page 364 Throughput Summary VLAN List - Level 4 Throughput Summary MPLS List - Level 4 RXT-6200_RXT6000e_Module_Manual Page 364 of 387...
- Page 365 Throughput Summary Gateway List - Level 4 Go back to top Go back to TOC 17.4.1.6 Starting/Stopping a Throughput (Multiple Streams) Test Once all configurations have been made, tap the Start button on the right section of the screen to start the measurements. If testing on the fiber ports, make sure the LASER is turned On before starting the test.
- Page 366 Go back to top Go back to TOC The Aggregate screen displays these parameters: Line Rate (bps): This value is always fixed since it depends on the maximum capacity of the link under test, hence the test interface that is configured. Utilization: % of Line Rate.
- Page 367 Throughput Results - Global Signal Page 2 Throughput Results - Global Signal Page 3 RXT-6200_RXT6000e_Module_Manual Page 367 of 387...
- Page 368 Throughput Results - Global Signal Page 4 Go back to top Go back to TOC The Global Errors screen displays the Current and Total error count of all streams: Sync Header Error Block Type Error FCS/CRC: Number of received frames with an invalid Frame Check Sequence (FCS) IP Checksum: Invalid IP Frame Check sequence TCP/UDP Checksum (Layer 4 only) Jabber frames: Number of received frames larger than 1518 bytes containing an invalid FCS...
- Page 369 Go back to top Go back to TOC The Global Alarms screen displays the Current and Total alarm count of all streams: LOS (ms): Loss of Signal Link Down (ms) Service disruption associated with loss of signal: Current: Duration of the current service disruption Total: Total accumulated duration of the service disruptions Min/Max: Minimum and maximum duration of the service disruption events No.
- Page 370 The Global Traffic screen displays: Frame Type of all streams Traffic Type of all streams Frame size of all streams Throughput Results - Global Traffic Tap on the bar graph for frame and traffic distribution statistics. Frames tab: The following Frame distribution statistics are displayed in Count (#) and Percentage (%): Received (RX) frames: Total frame Total/Test frames VLAN tagged frames...
- Page 371 Traffic Type tab: The following Traffic distribution statistics are displayed in Count (#) and Percentage (%): Layer 2/3 Unicast frames: Number of Unicast frames received without FCS errors. Layer 2/3 Broadcast frames: Number of Broadcast frames received without FCS errors. Broadcast frames have a MAC address equal to FF-FF-FF-FF-FF-FF.
- Page 372 Go back to top Go back to TOC 17.4.2.2 Per Stream Results The Per Stream tab displays the same type of statistics as seen in Global Results, but for each stream. For descriptions of the parameters in each tab, with the exception of Rates, please refer back to the corresponding section in Global/Aggregate Results.
- Page 373 Bit: Indicates errors related to test pattern (Bit Error or LSS [Pattern Loss]) BER: Bit Error Ratio FCS/CRC: Number of received frames with an invalid Frame Check Sequence (FCS) IP Checksum: Invalid IP Frame Check sequence TCP/UDP Checksum (Layer 4 only) Jabber frames: Number of received frames larger than 1518 bytes containing an invalid FCS Runt frames: Number of received frames smaller than 64 bytes containing an invalid FCS Frame Loss: Number of frames lost from receiver...
- Page 374 Go back to top Go back to TOC The Per Stream Events screen displays a Date and Time stamped record of bit errors, alarms and other anomalies pertaining to each stream. Throughput Results - Per Stream Events Go back to top Go back to TOC The Per Stream Traffic screen displays the frame type and frame size distribution pertaining to each stream.
- Page 375 Go back to top Go back to TOC The Per Stream Delay screen displays the frame delay information pertaining to each stream. The Histogram shows the sampling points for the delay. Throughput Results - Per Stream Delay Throughput Results - Per Stream Delay - Histogram RXT-6200_RXT6000e_Module_Manual Page 375 of 387...
- Page 376 Go back to top Go back to TOC The Per Stream Rates screen displays the frame rate and data rate pertaining to each stream. Tap on either dial to see rate details. Throughput Results - Per Stream Rates Throughput Results - Per Stream Rate Details RXT-6200_RXT6000e_Module_Manual Page 376 of 387...
- Page 377 Go back to top Go back to TOC 17.4.3 Saving Throughput Results After stopping the test, save the results by pressing the Save button on the platform's keypad. A window will open giving the option of namingx the results file. Enter the desired name for the file and tap apply. The results will be saved.
- Page 378 17.5 Packet Capture 17.5.1 Packet Capture Setup The packet capture function can be used to capture packets to eCPRI test ports. The packet capture format is compatible with Wireshark and can be viewed on the unit or on a PC. Configure the following Capture Mode parameters: Profile: Drop-down selections are Default, Delete, Save, Save As...
- Page 379 Go back to top Go back to TOC Tap the Start button to begin packet capture. A message appears showing the number of packets being captured. Packet Capture In Progress Go back to top Go back to TOC 17.5.2 Packet Capture Results To finish packet capture and manage packet capture results, press Stop.
- Page 380 Go back to top Go back to TOC Viewing Packet Capture Results When viewing results, Wire shark will launch and display the results. The file is stored in the Files folder. It can be viewed on the test set or exported and analyzed on PC Wireshark. For more information on viewing and exporting files, see the RXT-1200 User Manual on www.veexinc.com.
- Page 381 Length Info Middle and Lower Sections: Frame details Ethernet frame details Go back to top Go back to TOC RXT-6200_RXT6000e_Module_Manual Page 381 of 387...
- Page 382 18.0 Profiles Profiles can be created in any application that has a "Profiles" drop-down menu available. The SDH, OTN, Ethernet applications all have the ability to save profiles. Profiles can be viewed and loaded in the Profiles folder located in the Files folder structure. Accessing and Configuring Profiles To access the Profiles menu from the OTN/SDH/SONET Testing main menu, tap on the following icons: Advanced Mode >...
- Page 383 19.0 Common Functions Please refer to the RXT-1200 Platform Manual for the following functions: IP Tools: Ping, Trace Route Net Wiz WiFi Wiz Advanced Tools Utilities Files R-Server Backlight VeExpress M.Upgrade Go back to TOC RXT-6200_RXT6000e_Module_Manual Page 383 of 387...
- Page 384 Replace hardware which proves to be defective provided that the products that the customer elects to replace is returned to VeEX Inc. by the customer along with proof of purchase within thirty (30) days of the request by the customer, freight prepaid.
- Page 385 21.0 Product Specifications The most recent product specifications can be found on the VeEX web site at www.veexinc.com. Go back to TOC RXT-6200_RXT6000e_Module_Manual Page 385 of 387...
- Page 386 All applicable products imported into the EU market after July 1, 2006 must pass RoHS compliance. For more information about RoHS as it relates to VeEX Inc, go to the VeEX web site at www.veexinc.com/RoHS...
- Page 387 23.0 About VeEX VeEX Inc., the Verification EXperts, is an innovative designer and manufacturer of test and measurement solutions addressing numerous technologies. Global presence through a worldwide distribution channel provides uncompromised product support. Visit us online at www.veexinc.com for latest updates and additional documentation.
Need help?
Do you have a question about the RXT-6200 and is the answer not in the manual?
Questions and answers