Table of Contents
Advertisement
Quick Links
MANUAL
•
• PDF Reports
• Field Ready
Info
9/2017
Link
manual pn: 31913
Link
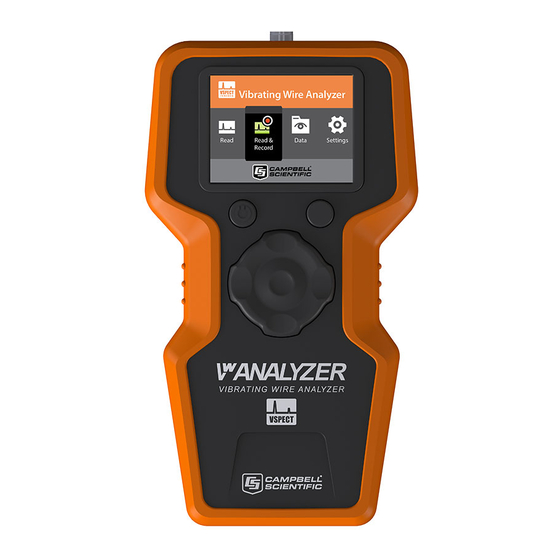
Meet the Vibrating Wire Analyzer
Meet the Vibrating Wire Analyzer (VWA), the best vibrating wire (vw) field reader
available. Field ready to quickly measure a sensor, save data, and communicate
results with custom PDF reports and spreadsheet output. Measurements are
geo-located with the integrated GPS allowing the VWA to verify locations and
walk you to your sensors. The large color display and VSPECT
technology
TM
confidence that you are getting the best measurement possible both in the field
and in the office.
, when your measurements matter.
1
Protected under U. S. Patent No. 7,779,690
Caution
!
•
Avoid contact with water, see
Precautions
•
Transport/store in carrying case
•
Measurements are not pressure or temperature corrected
Downloads
Visit
www.campbellsci.com/vwanalyzer
to download:
•
VwProjects software
•
Updated operating systems (updated Sensor Library)
•
Manual (this document)
QUICK TOUR
Vibrating Wire Analyzer
1
Power
1
, left soft key
2
2
Right soft key
2
3
Enter/select
3
4
Menu navigation arrows (4)
5
Serial number (SN)
1
6
Battery door
2
7
Battery door screws (2)
3
8
Elastic strap connection (2)
4
9
Measurement cable
10
USB port (PC connection)
11
Measurement cable connection
Hold (2–3 s) to turn off
1
2
Soft keys select the displayed screen
Quality
option (when present)
3
Selects the highlighted option
FIELD
Operation
1 Turn on the VWA
•
Install/replace batteries as needed (5-AA)
6
•
Push power button
1
2 Select/Create User
•
Links user information to specific measurements
•
User information is documented on PDF reports
3 Connect Sensor (if measuring)
11
•
Connect measurement cable
. Keyed connector, do not force
•
Match sensor and measurement cable colors
4 Navigate the Main Menu
•
Return to the Main Menu by pushing the left soft key
create
1
Vibrating Wire Analyzer
Read
Read &
Data
Settings
Record
Read:
Measure a sensor quickly,
Read
Data is NOT saved
Read & Record:
Measure a sensor,
Data is saved
Read &
Record
see
Read & Record
Data:
Export data to CSV file, or view saved data
Data
see
Data Retrieval
Settings:
Change system, measurement, or power settings
Settings
PDF Reports
12
User specific title
13
Project Information
14
User-Defined Inputs
15
VSPECT Diagnostics
16
Field Notes
5
17
Sensor Frequency
6
18
Resistance (Thermistor/RTD)
7
19
Frequency Spectrum graph
8
20 9
Time Series graph
1
Entered manually or with a PC,
see
VwProjects
2
The
VSPECT Measurement
explains how to use and understand
9
VSPECT data.
11
10
Tips:
•
Return to the Main Menu by pushing the left soft key
•
Carry spare batteries (5-AA) in the carrying case.
•
A continuous measurement can display engineering units when linked to a Site/Sensor
with an engineering unit conversion applied.
•
Leave 1–2 mm of exposed sensor wire on datalogger/multiplexer wiring for VWA
connection
9
. Always disconnect automated system power prior to VWA connection.
Definitions:
Sensor:
An individual vibrating wire sensor. A VWA can store up to 880
unique sensors (40 sites, 22 sensors/site).
Site:
A project or geographic location containing up to 22 sensors.
9
. See
Wiring Guide
User:
Operator name and information.
Wiring Guide
several times.
1
9
VWA Cable
-RED
-ONG
Red
2
Orange
2
Red
Black
Orange
Black
2
2
Green
2
Blue
2
Green
White
2
Blue
2
White
Blue
Yellow
1
If sensor wiring does not match the table, refer to the sensor manufacturer manual to determine the VW gage
wire leads. Some sensors may not have a thermistor or RTD (temperature measurement).
Vibrating wire leads are interchangeable (black and red instead of red and black); thermistor leads are similarly
2
interchangeable.
Read & Record
There are three options to save data when using Read & Record.
•
Single is used when sensors won't be repeatedly measured in the future (installation
record, baseline reading, troubleshooting).
•
Site/Sensor is used when sensors will be repeatedly measured and data needs to be
linked to a site. Site/Sensor data is viewable in the field for historical comparison.
•
Continuous measures a single sensor at a user defined interval ranging from 1 second
to 15 minutes. Used to document installations, live field testing (push-in-piezometer,
well pump test, sensor response, etc.), and for troubleshooting.
Notes:
•
Measurements are not pressure or temperature compensated.
•
Users can view all data. Sites are not user specific.
•
See
Measurement Screens
•
Sites, Sensors, and Users can be created and edited either on the VWA, or with a PC and
keyboard using VwProjects.
OFFICE
Data Retrieval
Fi
les are transferred to a PC from the VWA using the USB port
1
with the Read & Record option is saved as a PDF and/or CSV file. A printable report (PDF) com-
1
12
municates results quickly and professionally. Raw data files (CSV) can collect multiple sensors
(site) in a single file for additional spreadsheet analysis and reporting.
13
17
2
18
1 Export CSV files (optional)
14
19
2
15
20
2
2 Connect VWA to a PC with USB
16
for details.
section
3 Copy files to PC
1
several times.
4 Eject VWA from PC
VwProjects
VwProjects is a free software package for easier setup of Sites, Sensors, and Users with a PC.
VwProjects can be downloaded and installed from the VWA memory or from the internet, see
Downloads.
Common Sensor
Sensor
VwProjects is used to create and edit a project file that contains information about Sites, Sen-
Cable Colors
1
Description
sors, and Users. Project files can be used to back up or transfer information to other VWA devices.
or
Orange
VW Gage
See
Using VwProjects
White w/Orange
VW Gage
or
Blue
Therm/RTD
White w/Blue
Therm/RTD
Bare/Clear
Drain Wire
File Types
The following files are created or used with the VWA. Files are transferred with a USB connection
(see
for an explanation of displayed measurement results.
10
. Measurement data collected
•
Navigate to the Main Menu. See Operation.
•
Select Data. Choose and export CSV files.
10
•
Connect a PC to the VWA
with a USB Mini-B cable.
•
Power is supplied through the USB-PC connection.
•
Find the USB flash memory device (VWA) on the PC.
•
Data files are stored in either the PDF Reports or CSV Data folder.
•
Copy files to the PC.
PDF
•
Ready to print PDF reports
Reports
•
Field documentation
CSV
•
Multiple measurements in one file
Data
•
Spreadsheet analysis
•
Eject the VWA from the PC prior to disconnecting the USB cable.
for details about creating, editing, and transferring project files.
Notes:
•
A project file contains information about Sites, Sensors, and Users. Measurement
data is saved in the PDF and CSV files, and is NOT saved or transferred in a project
file.
•
You can preview a report title block
12
when creating or editing a user in
VwProjects.
Data
Retrieval).
PDF:
Measurement Reports
created using Read & Record.
CSV: Created by the VWA with Read & Record, use for further spreadsheet analysis; see
Data
Retrieval.
VWA: A project file contains information about Users, Sites, and Sensors. Created in the
VWA or with VwProjects.
OBJ: Operating system file, created by Campbell Scientific. See Downloads.
Advertisement
Table of Contents

Related Manuals for Campbell VWANALYZER


Summary of Contents for Campbell VWANALYZER
-
Page 1: Data Retrieval
VWA or with VwProjects. • Measurements are not pressure or temperature compensated. Visit www.campbellsci.com/vwanalyzer to download: OBJ: Operating system file, created by Campbell Scientific. See Downloads. • Users can view all data. Sites are not user specific. • VwProjects software Settings: •... - Page 2 A project file contains site, sensor, and user information. Project files can be shared between VWAs. • VwAnalyzer • USB cable Output and Diagnostics...
Need help?
Do you have a question about the VWANALYZER and is the answer not in the manual?
Questions and answers