
Related Manuals for Rohde & Schwarz FSH3


Summary of Contents for Rohde & Schwarz FSH3
- Page 1 Test and Measurement Division Operating Manual Handheld Spectrum Analyzer R&S FSH3 1145.5850.03 1145.5850.13 1145.5850.23 1145.5973.12-06-...
- Page 2 R&S FSH3 Contents Contents Specifications Safety Instructions Certificate of Quality EC-Certificate of Conformity Support Center Address List of R&S Representatives 1 Putting into Operation ......................1.1 Front view............................1.1 Putting into Operation........................1.2 Unpacking the Instrument......................1.2 Setting up the Instrument......................1.3 Switching on the Spectrum Analyzer ..................1.4 Spectrum Analyzer Connectors ....................1.5...
- Page 3 Contents R&S FSH3 2 Getting Started ..........................2.1 Measurements on CW Signals ......................2.1 Level measurement ........................2.1 Setting the Reference Level......................2.2 Frequency Measurements ......................2.3 Harmonic Measurements......................2.4 Power Measurements Using the Power Sensor .................2.5 Power and Reflection Measurements with the R&S FSH-Z44 ...........2.7 Two Port Transmission measurements ..................2.9...
- Page 4 R&S FSH3 Contents 4 Instrument Functions .......................4.1 Instrument Default Setup.........................4.1 Status Display...........................4.1 Setting the Frequency........................4.2 Entering the center frequency.....................4.2 Setting a frequency offset ......................4.2 Entering the center-frequency stepsize ..................4.3 Entering the start and stop frequency ..................4.4 Setting the Span ..........................4.5 Setting the Amplitude Parameters....................4.6...
- Page 5 Contents R&S FSH3 Setting and Using the Measurement Functions ................4.33 Measuring the channel power of continuously modulated signals..........4.33 Power measurements on TDMA signals ..................4.36 Measuring the occupied bandwidth ..................4.40 Measurements using the power sensor..................4.43 Connecting the power sensor ..................4.43 Zeroing the power sensor ....................4.46 Selecting the unit for the power readout ..............4.46...
- Page 6 R&S FSH3 Specifications Specifications Specifications apply under the following conditions: 15 minutes warm-up time at ambient temperature, specified environmental conditions met and calibration cycle adhered to. Data without tolerances: typical values only. Data designated as "nominal" are design parameters and are not tested.
- Page 7 Specifications R&S FSH3 Input related spurious Carrier offset > 1 MHz <-70 dBc (nominal) Level display Reference level -80 dBm to +20 dBm in steps of 1 dB Display range 100 dB, 50 dB, 20 dB, 10 dB, linear Display units Logarithmic dBm, dBµV, dBmV,...
- Page 8 DAB If standard is selected ± 1 % of measured value (± 0.04 dB) 3GPP W-CDMA, cdma2000 on R&S FSH3 ± 2 % of measured value (± 0.09 dB) DVB-T ± 2 % of measured value (± 0.09 dB) π/4 DQPSK...
- Page 9 Specifications R&S FSH3 Matching measurement range Return loss 200 MHz to 3 GHz 0 dB to 23 dB 3 GHz to 4 GHz 0 dB to 20 dB VSWR 200 MHz to 3 GHz > 1.15 3 GHz to 4 GHz >...
- Page 10 R&S FSH3 Specifications Calibration standards Short/open Connector N male 50 Ω load Impedance 50 Ω Return loss up to 3 GHz >46 dB Power-handling capacity Connector N male General data Power consumption 500 mW (nominal) Dimensions (W x H x D)
- Page 11 CMOS RAM Memory Settings and traces Environmental conditions Temperature Operating temperature range R&S FSH3 powered from internal battery 0 °C to 50 °C R&S FSH3 powered from AC power 0 °C to 40 °C supply Storage temperature range -20 °C to +60 °C Battery charging mode 0 °C to 40 °C...
- Page 12 VSWR Bridge and Power Divider, R&S FSH-Z2 1145.5767.02 10 MHz to 3 GHz, for R&S FSH3 (open, short, 50 Ω load) Power Sensor, 10 MHz to 18 GHz, for R&S FSH3 R&S FSH-Z18 1165.1909.02 Directional Power Sensor, 200 MHz to 4 GHz, R&S FSH-Z44 1165.2305.02...
- Page 13 Specifications R&S FSH3 12 V Car Adapter for R&S FSH3 R&S FSH-Z21 1145.5873.02 Serial/Parallel Converter for R&S FSH3 R&S FSH-Z22 1145.5880.02 Carrying Bag for R&S FSH3 R&S FSH-Z25 1145.5896.02 Spare Short/Open Standard for R&S FSH-Z2 for R&S FSH-Z30 1145.5773.02 VSWR Calibration Spare 50 Ω...
-
Page 14: Safety Instructions
Applicable local or national safety regulations ditions and positions specified by the manufac- and rules for the prevention of accidents must turer. The R&S FSH3 is protected against drip- be observed in all work performed. ping water and dust (IP degree 51). - Page 15 Safety Instructions 11. The outside of the instrument is suitably 12. Any additional safety instructions given in this manual are also to be observed. cleaned using a soft, lint-free dustcloth. Never use solvents such as thinners, acetone and similar things, as they may damage the front panel labeling or plastic parts.
- Page 16 R&S FSH3 Certificate of quality Certificate of quality Dear Customer, You have decided to buy a Rohde & Schwarz product. You are thus assured of receiving a product that is manufactured using the most modern methods available. This product was developed, manufactured and tested in compliance with our quality management system standards.
- Page 17 EC Certificate of Conformity Certificate No.: 2002-41 This is to certify that: Equipment type Stock No. Designation FSH3 1145.5850.03/.13/.23 Handheld Spectrum Analyzer FSH-Z1 1155.4505.02 Average Power Sensor FSH-Z18 1165.1909.02 Average Power Sensor FSH-Z2 1145.5767.02 VSWR Bridge and Power Driver FSH-Z32 1145.5796.02...
- Page 18 R&S FSH3 Support Center Support Center Should you have any technical questions concerning this Rohde & Schwarz product, please contact the hotline of Rohde & Schwarz Vertriebs-GmbH, Support Center. Our hotline team will answer your questions and find solutions to your problems.
- Page 19 Adressen/Addresses FIRMENSITZ/HEADQUARTERS Phone Zweigniederlassung Süd, Geschäftsstelle +49 (89) 41 86 95-0 München +49 (89) 40 47 64 E-mail Mühldorfstraße 15 · D-81671 München Postfach 80 14 69 · D-81614 München Rohde & Schwarz GmbH & Co. KG +49 (89) 41 29-0 Mühldorfstraße 15 ·...
- Page 20 Adressen/Addresses Canada ROHDE & SCHWARZ CANADA Inc. +1 (613) 592 80 00 Denmark ROHDE & SCHWARZ DANMARK A/S +45 (43) 43 66 99 555 March Rd. +1 (613) 592 80 09 Ejby Industrivej 40 +45 (43) 43 77 44 Kanata, Ontario K2K 2M5 cgirwarnauth@rscanada.ca 2600 Glostrup Canada...
- Page 21 Adressen/Addresses India ROHDE & SCHWARZ India Pvt. Ltd. +91 (80) 535 23 62 Kenya Excel Enterprises Ltd +254 (2) 55 80 88 Bangalore Office +91 (80) 535 03 61 Dunga Road +254 (2) 54 46 79 No. 24, Service Road, Domlur rsindiab@rsnl.net P.O.Box 42 788 2nd Stage Extension...
- Page 22 Adressen/Addresses Norway ROHDE & SCHWARZ NORGE AS +47 (23) 38 66 00 Sri Lanka LANKA AVIONICS +94 (1) 95 66 78 Enebakkveien 302 B +47 (23) 38 66 01 658/1/1, Negombo Road +94 (1) 95 83 11 1188 Oslo Mattumagala lankavio@sltnet.lk Ragama Oman...
- Page 23 Adressen/Addresses United Arab ROHDE & SCHWARZ Emirates L.L.C. +971 (2) 631 20 40 Emirates P.O.Box 31156 +971 (2) 631 30 40 Abu Dhabi rsuaeam@emirates.net.ae United ROHDE & SCHWARZ UK Ltd. +44 (1252) 81 88 88 (sales) Kingdom Ancells Business Park +44 (1252) 81 88 18 (service) Fleet +44 (1252) 81 14 47...
-
Page 24: Putting Into Operation
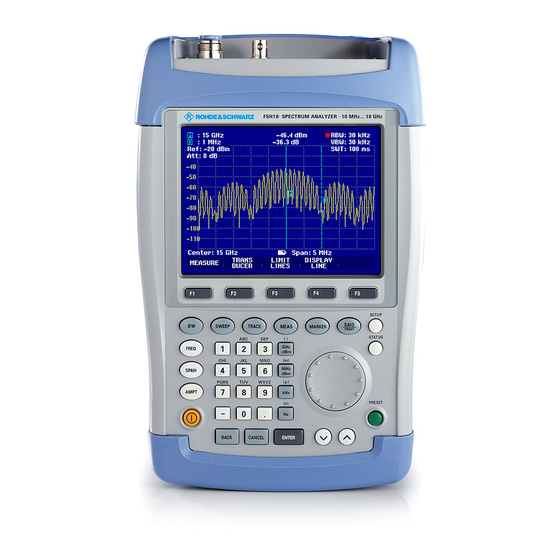
R&S FSH3 Front view 1 Putting into Operation Front view Connector for External trigger /external power sensor reference input BNC connector Generator output RF input N connector N connector Connector for Connector for headphones AC power supply Display RS-232 optical... -
Page 25: Putting Into Operation
Section 2 describes the operation of the Spectrum Analyzer using simple measurements as examples. Unpacking the Instrument The R&S FSH3 comes in a formfitting packaging, consisting of an upper and a lower shell. Both shells are held together by a tape wrapped around the packaging. -
Page 26: Setting Up The Instrument
The Handheld Spectrum Analyzer R&S FSH3 has been designed for operation in labs as well as for on- site use for service and maintenance applications. For any application, the R&S FSH3 can be set up to optimize ease of operation and the viewing angle of the display. -
Page 27: Switching On The Spectrum Analyzer
The R&S FSH3 displays a connector symbol in the middle of the display above the softkey labels to indicate that it is mains powered. When the R&S FSH3 is switched on, it recalls the settings that it was using when it was last switched off. Note: If the internal battery is completely flat, the R&S FSH3 cannot be switched on, even though... -
Page 28: Spectrum Analyzer Connectors
DC connector for external power supply (on the right-hand side of the carrying handle). The R&S FSH3 is powered from the AC/DC adapter via the DC connector and the R&S FSH3 internal battery is also charged. The input voltage for the instrument must be between 15 V and 20 V. Power consumption is approx. - Page 29 Putting into Operation R&S FSH3 Tracking generator output (model 1145.5850.13 and 1145.5850.23 only) Connect the tracking generator output to the DUT via an N connector. The nominal output level is -20 dBm (100 µW). With model 1145.5850.23, the level can be switched between –20 dBm and 0 dBm (1 mW).
-
Page 30: Screen Settings
Putting into Operation Screen Settings The R&S FSH3’s screen is a transflective, passive color LCD. Indoors, its brightness depends on the intensity of the backlighting. If light irradiation is strong, the ambient light supports readability. The viewing angle can be optimized by adjusting the contrast. To achieve maximum contrast, the screen can be switched from color display to black-and-white display. - Page 31 DISPLAY softkey again. In the submenu that opens, select COLOR or BLACK/WHITE. Confirm the selection with the ENTER key or by pressing the DISPLAY softkey again. The R&S FSH3 switches to the selected color settings. 1145.5973.12...
-
Page 32: Country-Specific Settings
R&S FSH3 Putting into Operation Country-Specific Settings The R&S FSH3 is “multilingual” and can display text in the language of your choice. The softkey lettering is always in English. The default setting (factory-setting) is also English. Selection Press the SETUP key. -
Page 33: Setting The Date And Time
R&S FSH3 Setting the Date and Time The R&S FSH3 has an internal clock that can date and time stamp, e.g. outputs to a printer or stored data records. The user can reset the date and time. Setting the date Press the SETUP key. -
Page 34: Charging The Battery
For rapid charging, we urgently recommend that you switch off the R&S FSH3 during charging. The charging time is approx. four hours. If the R&S FSH3 is switched on, the charging current for the battery is reduced by the current drain of the R&S FSH3, which means the battery might not be charged. -
Page 35: Switchover External Reference / External Trigger
ENTER key or the GENERAL softkey. Switchover External Reference / External Trigger The Ext Trig/Ext Ref BNC connector on top of the R&S FSH3 can be used either as an input for an external trigger or an external reference. Switchover is via the Setup menu. -
Page 36: Using A Preamplifier
If the preamplifier is switched on, its use is coupled to the reference level, thus ensuring at all times optimum dynamic range of the R&S FSH3. The table below shows the positions of the RF attenuator and the preamplifier as a function of the reference level. -
Page 37: Pin Code Entry
To prevent unauthorized use, the R&S FSH3 can be protected with a PIN code. When the R&S FSH3 is delivered, the PIN code is set to 0000 and PIN code entry is disabled when the R&S FSH3 is switched on. A PIN code, i.e. a four-digit number, can be re-entered whenever you wish. - Page 38 The selected PIN code is now activated. The next time the R&S FSH3 is switched on, the PIN code must be entered before the instrument can be operated. When a wrong PIN code is input the R&S FSH3 asks again for the PIN code. After three trials with the wrong key code it asks for the Master code.
-
Page 39: Connecting Printers
R&S FSH3 Connecting Printers The R&S FSH3 can output a screen shot to a printer equipped with an RS232 interface. Use the Serial/Parallel Converter R&S FSH-Z22 for printers with a parallel interface. A printer with an RS232 interface can be directly connected using the RS232 optical interface cable supplied. - Page 40 Z22 by opening the ist cabinet. Selecting a printer Press the SETUP key on the R&S FSH3. The R&S FSH3 displays the selected printer and its baud rate in the setup settings. To select another printer, proceed as follows: Press the GENERAL softkey.
-
Page 41: Enabling Options
R&S FSH3 Enabling Options The R&S FSH3 can be fitted with options (e.g. distance-to-fault measurements on cables) which are enabled by entering a key code. The key code is based on the unique serial number of the instrument. To retrofit an option, enable it with a key code. -
Page 42: Getting Started
Level -30 dBm Level measurement First, set the R&S FSH3 to its default settings to show all the operating steps that are required. Press the PRESET key. The analyzer displays the frequency spectrum from 100 kHz to 3 GHz – the R&S FSH3’s maximum Frequency Span. -
Page 43: Setting The Reference Level
The R&S FSH3 now displays the generator signal with a higher resolution. The R&S FSH3 has markers for reading off signal levels and frequencies. Markers are always positioned on the trace. Both the level and frequency at their current positions are displayed on the screen. -
Page 44: Frequency Measurements
Frequency Span that has been selected. The R&S FSH3 has a frequency counter to increase the accuracy of the marker-frequency readout, It stops the sweep at the marker position, counts the frequency and then continues the sweep. -
Page 45: Harmonic Measurements
Enter '250' using the numeric keypad and confirm the entry with the MHz key. The R&S FSH3 now displays the spectrum from 50 MHz to 250 MHz, and so the signal at 100 MHz and its 2nd harmonic at 200 MHz. -
Page 46: Power Measurements Using The Power Sensor
The R&S FSH3 opens the screen for power measurements. If a power sensor has not been connected, no measured value is displayed. If a power sensor has been connected, the R&S FSH3 sets up a connection via the RS232 interface and after a few seconds displays the measured power. - Page 47 Measurements on CW Signals R&S FSH3 Press the ZERO softkey. The R&S FSH3 outputs a message to tell the user not to apply any signals to the power meter when zeroing is being performed. Disconnect the power sensor from any signal sources.
-
Page 48: Power And Reflection Measurements With The R&S Fsh-Z44
It is driven and powered via a special serial interface. The cable on the power sensor must be connected and screw-fastened to the Power Sensor connector on the R&S FSH3. The directional power sensor itself has to be inserted between the source and the load. - Page 49 Now connect the R&S FSH-Z44 between the source and the load. The R&S FSH3 displays the measured forward power level in dBm and the return loss of the load in To achieve highest measurement accuracy, enter the frequency of the signal under test.
-
Page 50: Two Port Transmission Measurements
(only for R&S FSH3 with tracking generator: order No. 1145.5850.13 or 1145.5850.23). For measurement of the gain or attenuation of two port devices the R&S FSH3 provides a tracking generator. It generates a sinewave signal at exactly the receive frequency of the Spectrum Analyzer. - Page 51 If the reference is changed after calibration, greater measurement uncertainty must be anticipated (up to 1 dB). The R&S FSH3 retains the calibration data but displays a red dot in front of Transmission . When saving a data set for a scalar transmission measurement in a calibrated state, the R&S FSH3 can store the calibration data along with the other settings (see section "Saving Calibration Data").
-
Page 52: Measurement Of Return Loss
Control cable Connect the control cable of the R&S FSH-Z2 to the Power Sensor connector of the R&S FSH3. Connect the RF and Generator port of the R&S FSH-Z2 to the RF input and generator output of the R&S FSH3. - Page 53 If the reference is changed after calibration, a larger measurement uncertainty must be anticipated. The R&S FSH3 retains the calibration data, but places a red dot in front of the Reflection display to indicates possible increase in measurement uncertainty.
- Page 54 5 °C from its temperature when the data set was stored. If the temperature deviation is greater, the R&S FSH3 outputs a (red) dot in front of • Reflection . A precise measurement can then only be made after a calibration.
-
Page 55: Performing Distance To Fault Measurement
ENTER key or the MEAS softkey. The R&S FSH3 turns on the "Distance to Fault" measurement function. The R&S FSH3 delivers best results, if the Center Frequency is set to the frequency the device under test is operated. - Page 56 Entering the cable parameters at a frequency: If cables are used that are not in the list of cable models stored in the R&S FSH3, it is possible to enter the cable parameters at a frequency. It is advisable to use the Center Frequency of the DTF measurement.
- Page 57 The R&S FSH3 uses the cable length to determine the optimal span for the measurement and for scaling the x-axis in DTF mode. For best results the cable should be specified 20 to 50 % longer than the actual cable length.
- Page 58 Precondition for a valid calibration is, that the instrument temperature does not change more than 5 °C after calibration. In case of a higher temperature change the R&S FSH3 shows a red dot in front of the • DTF display . A new calibration is recommended, then.
- Page 59 Cursor keys (step = 10 % of the span). For higher fault resolution, the R&S FSH3 offers a zoom function in the position of the marker. The x axis of the display can be extended up to a span of 3 m.
- Page 60 The R&S FSH3 turns off the tracking generator and displays the spectrum over the frequency range of the DTF measurement. To indicate that the R&S FSH3 is in the spectrum mode, DTF Spectrum is displayed in the top right- hand corner of the screen. Otherwise, the R&S FSH3 uses exactly the same settings as it did for DTF measurements.
-
Page 61: Saving And Recalling Settings And Test Results
By pressing the BACK key the R&S FSH3 browses through the list of names of the already stored data sets and shows them with the 1 available free extension. That way the name of the data set recalled for a specific measurement can be selected for storage of the measurement data. -
Page 62: Saving Calibration Data
If it deviates more than 5 °C the R&S FSH3 outputs a red dot in front of the • Transmission or • Reflection display. A new calibration is recommended, then. -
Page 63: Recalling Measurement Results
Press the PRINT softkey to send the displayed data set to a printer. Pressing the ACTIVATE softkey transfers the stored trace to the R&S FSH3's trace memory. The current trace can be compared with the stored one by switching on the trace memory. -
Page 64: Printing Out Measurement Results
Printing Out Measurement Results The R&S FSH3 can print out screen shots to a printer equipped with a serial interface. The type of printer and the baud rate of the serial interface are set in the setup menu (SETUP key) using the GENERAL softkey and the 'PRINTER BAUD...' and 'PRINTER TYPE...' menu items. -
Page 65: Operation
R&S FSH3 Screen Layout 3 Operation Screen Layout Screen layout for spectrum-mode measurements without markers Trigger Trace mode Parameter Detector uncoupled display display display Display of resolution bandwidth (RBW), Reference video bandwidth (VBW) and level display sweep time (SWT) Invalid-trace symbol... -
Page 66: Screen Layout When The Marker Mode Is Selected
Screen Layout R&S FSH3 Screen layout when the marker mode is selected Display: Marker-value Setting not coupled readout Marker Delta marker Selected menu item Softkey menu Softkey activated Softkey function on for entry The colour of the softkey labelling and its background indicate the status of the softkey function in... -
Page 67: Entering Measurement Parameters
The alphanumeric keypad is also used to enter letters, e.g. file names for data sets. If the R&S FSH3 is expecting a letter entry, it automatically assigns the letters above the keys to the keys in the alphanumeric keypad. The keys have multiple assignments. The letter you want is obtained by pressing the key the appropriate number of times. -
Page 68: Entering Units
To enter a unit for a value entry, terminate the entry with a unit key. Use the unit keys down the right- hand side of the alphanumeric keypad. These keys have multiple assignments which depend on the unit entry expected by the R&S FSH3. GHz, -dBm, V, s MHz, dBm, dBmV, mV, ms kHz, dBµV, µV, µs... -
Page 69: Menu Overview
R&S FSH3 Menu Overview Menu Overview Frequency entry CENTER START STOP FREQ FREQ FREQ STEPSIZE FREQ FREQ OFFSET 0.1 x SPAN =CENTER MANUAL... Frequency span entry MANUAL FULL ZERO LAST SPAN SPAN SPAN SPAN SPAN Level entry AMPT RANGE UNIT... -
Page 70: Sweep Entry
Menu Overview R&S FSH3 Sweep entry MANUAL AUTO CONT SINGLE SWEEP TRIGGER SWPTIME SWPTIME SWEEP SWEEP FREE RUN VIDEO... EXTERN EXTERN DELAY... Trace settings TRACE TRACE-> SHOW TRACE DETECTOR MODE MEMORY MEMORY CLEAR/WRITE AUTO PEAK AVERAGE MIN PEAK MIN HOLD... -
Page 71: Measurement Functions
R&S FSH3 Menu Overview Measurement functions TRANS LIMIT DISPLAY MEAS MEASURE DUCER LINES LINE ANALYZER TRACKING GEN POWER SENSOR CHANNEL POWER DISTANCE TO FAULT REFLECTION OCCUPIED BW SPECTRUM TDMA POWER DISTANCE TO FAULT CABLE MEAS LIST CABLE MODEL LENGTH MODE... -
Page 72: Markers
Menu Overview R&S FSH3 TRANS LIMIT DISPLAY MEAS MEASURE DUCER LINES LINE TRANSD TRD'S EXIT TRANSD TRANSD LIST -> SELECT EXIT PRINTER TRANS LIMIT DISPLAY MEAS MEASURE DUCER LINES LINE BEEP... MESSAGE... UPPER LOWER LIMITS EXIT OPTIONS LIMIT LIMIT LIMIT LIST ->... - Page 73 R&S FSH3 Menu Overview Distance-to-fault mode (option R&S FSH-B1): DISTANCE MARKER MARKER MKR LIST MARKER MARKER OFFSET MARKER MODE VÎEW PEAK NORMAL NEXT PEAK NOISE FREQ COUNT MINIMUM MULTI MARKER CENTER = MRK FREQ ZOOM ON REF LVL = MRK LVL...
-
Page 74: Save And Print Menu
Menu Overview R&S FSH3 Save and print menu SAVE/ SCREEN-> SAVE DELETE RECALL PRINTER PRINT DELETE LIST -> DELETE EXIT RECALL PRINTER SCREEN-> EXIT ACTIVATE {Data Set Name} PRINTER Instrument setup LOCAL SETUP -> HARDWARE SETUP GENERAL DISPLAY SETTINGS SETTINGS PRINTER CONTRAST... -
Page 75: Instrument Functions
Instrument Default Setup When you press the PRESET key, the R&S FSH3 is set to its default setup or presets. It is best to select the PRESET when you are going to perform a new measurement task. The new settings can then be made on the basis of the more familiar default setup without the old settings affecting the measurement. -
Page 76: Setting The Frequency
R&S FSH3 Setting the Frequency The R&S FSH3's frequency is set with the FREQ key. The frequency can be specified in terms of the center frequency (center freq. = frequency at the center of the frequency axis in the measurement diagram) or the start and stop frequency for a particular span. -
Page 77: Entering The Center-Frequency Stepsize
ENTER key. If you select "0.1 x SPAN" or "= CENTER", the R&S FSH3 makes the setting directly itself. If you select "MANUAL...", the value entry box opens and indicates the current stepsize. -
Page 78: Entering The Start And Stop Frequency
Adjust the start frequency with the rotary knob or the cursor keys and terminate the entry with the ENTER key. The R&S FSH3 sets the new start frequency. The x axis labelling changes from CENTER and SPAN to START and STOP. -
Page 79: Setting The Span
The span that was set immediately before the current span is restored. The ZERO SPAN softkey sets the span to 0 Hz. The R&S FSH3 measures the signal level only at the center frequency that has been set. As a spectrum cannot be displayed when measurements are made at a single frequency, the display mode switches to the time domain. -
Page 80: Setting The Amplitude Parameters
The RF attenuation setting at the input of the R&S FSH3 is directly coupled to the reference level. If the reference level is high, RF attenuation is switched on in steps of 10 dB according to the following table so that the input mixer always remains in the linear range. - Page 81 (SPAN = 0 Hz). The R&S FSH3 can also handle measurements on 75 Ω systems. The R&S FSH3 does not select a 75 Ω RF input per se, but instead only a 75 Ω matching pad connected at the RF input. The 50/75 Ω...
-
Page 82: Setting The Reference Level
R&S FSH3. The menu items VSWR 1-6 and VSWR 1-2 are valid scaling options only if the R&S FSH3 is fitted with a tracking generator which is configured for reflection measurements. If the R&S FSH-K2 option is installed, the ranges VSWR 1-1.5 and VSWR 1-1.1 are available... -
Page 83: Entering The Display Unit
R&S FSH3 Setting the Amplitude Parameters Entering the display unit Press the AMPT key. Press the UNIT softkey. A submenu opens. The various unit options for the reference level are displayed. Using the rotary knob or the cursor keys, select the unit you want and confirm your selection by pressing the ENTER key. -
Page 84: Setting The Bandwidths
1 kHz) the sweep time must be increased by a factor of 100. The R&S FSH3 has resolution bandwidths from 1 kHz to 1 MHz in a 1, 3, 10 sequence. Model 1145.5850.23 provides in addition the resolution bandwidths 100 Hz and 300 Hz. When the default setting is selected, they are coupled to the span, i.e. - Page 85 R&S FSH3 Setting the Bandwidths Operating sequence: Press the BW key. Resolution bandwidth Resolution bandwidth The menu for setting the bandwidth opens. If the uncoupled display default setting is activated, the softkey label for automatically setting the bandwidth is highlighted in green.
-
Page 86: Video Bandwidth
The R&S FSH3 has video bandwidths from 10 Hz to 3 MHz in a 1, 3, 10 sequence. When the default settings are selected, they are coupled to the resolution bandwidth. The video bandwidth equals the resolution bandwidth. - Page 87 R&S FSH3 Setting the Bandwidths Operating sequence: Press the BW key. The menu for setting bandwidths opens. When the default setting has been selected, the softkey label for setting the bandwidth automatically is highlighted in green. Press the MANUAL VIDEO BW softkey.
-
Page 88: Setting The Sweep
The R&S FSH3 requires a minimum sweep time of 20 ms per 600 MHz of span. If a larger span is set, the R&S FSH3 automatically adapts the minimum sweep time in the coupled mode. For the maximum span of 3 GHz, a minimum sweep time of 100 ms is required. -
Page 89: Sweep Mode
Setting the Sweep Sweep mode When the default settings are activated, the R&S FSH3 is in the continuous sweep mode, i.e. when one sweep of the span has been completed, the sweep is automatically repeated from the start of the span. -
Page 90: Trigger
Setting the Sweep R&S FSH3 Trigger To respond to events, the R&S FSH3 has a variety of trigger functions. The trigger can either be external or generated internally. • FREE RUN A new sweep starts on completion of the previous sweep. This is the default setting for the R&S FSH3. - Page 91 R&S FSH3 Setting the Sweep Change the video-trigger threshold with the cursor keys or the rotary knob (0 to 100 %). The trigger threshold is set immediately after entry. Terminate the trigger threshold entry with the ENTER key or the TRIGGER softkey.
-
Page 92: Trace Settings
Trace Settings R&S FSH3 Trace Settings The R&S FSH3 provides one measurement trace and a reference trace in memory. Trace mode A variety of display modes can be selected for the trace: • CLEAR/WRITE The R&S FSH3 clears the old trace during a new sweep. This is the default setting. - Page 93 R&S FSH3 Trace Settings Operating sequence: Press the TRACE key. Press the TRACE MODE softkey. The submenu for setting the trace mode opens. Using the cursor keys or the rotary knob, select the trace mode you want and confirm with the ENTER key or the TRACE MODE softkey.
-
Page 94: Detector
The detector processes a spectrum analyzer’s video voltage before it is displayed. The detector is pixel- oriented, i.e. it determines how the level at each pixel will be displayed. The R&S FSH3 always measures the whole spectrum. However, the trace only has 301 pixels in the x direction for displaying results. -
Page 95: Trace Memory
(Detect: Auto Pk in Fig. to right). Trace memory The R&S FSH3 can transfer a trace to the trace memory and also display the current trace and the trace in the trace memory for comparison. The saved trace is always displayed in white to distinguish it from the current trace. -
Page 96: Using The Markers
Using the Markers The R&S FSH3 has a marker and a delta marker to make it easier to read off trace values. The markers cannot leave the trace and indicate the frequency and level of the point they are positioned on. The frequency indicated by a marker is shown by a vertical line which extends from the top to the bottom of the measurement diagram. -
Page 97: Automatic Marker Positioning
Confirm the delta marker position by pressing the ENTER key or the DELTA MARKER softkey. Automatic marker positioning The R&S FSH3 has functions that make setting markers easier or allow instrument settings to be made on the basis of the current marker position: • PEAK This function places the marker or the delta marker on the highest value of the trace. -
Page 98: Using More Than One Marker At A Time (Multimarker Mode)
Using more than one marker at a time (multimarker mode) To measure different signals in a trace, the R&S FSH3 has the multimarker function. Up to six different markers are available in the multimarker mode. Marker 1 measures in absolute units. Markers 2 to 6 can measure in absolute units (marker) as well as relative units (delta). - Page 99 The R&S FSH3 displays the marker or delta marker last edited in the marker readout box at the upper left-hand corner of the screen. All marker functions in the SET MARKER menu apply to the displayed markers.
- Page 100 The delta markers remain unaffected by this function. Displaying all multimarker values: The R&S FSH3 can display a list of all activated markers and their values. Press the MKR LIST VIEW softkey. The R&S FSH3 displays a list of all activated markers and delta markers.
- Page 101 Note: If marker 1 (M1) is deactivated, the R&S FSH3 also deactivates all delta markers, because they use marker 1 as a reference. Deactivating all markers or delta markers: Press the MARKER or DELTA softkey.
- Page 102 Using the Markers R&S FSH3 The R&S FSH3 transfers the settings of the multimarker and multi delta marker with the lowest numbers to the normal marker mode. Alternatively, you can exit the multimarker mode by deactivating all markers (MARKER key: MARKER softkey: ALL MARKERS OFF menu item) or with PRESET.
-
Page 103: Marker Functions
(absolute or relative). To stabilize the noise power display, the R&S FSH3 uses the pixel on which the marker is positioned and the four pixels to the right and the four pixels to the left of the marker pixel. Noise power density can provide useful information when measurements are made on noise or digitally modulated signals. -
Page 104: Measuring The Frequency
301 frequency coordinates. The frequency resolution is therefore relatively coarse – especially if a large span is set. To circumvent this problem, the R&S FSH3’s internal frequency counter can be used. When frequency measurements are being made, the R&S FSH3 briefly stops the sweep at the marker position and measures the frequency using the frequency counter. -
Page 105: Af Demodulation
The currently set demodulation time is displayed in the value entry box. The demodulation time range is 100 ms to 500 s. If the R&S FSH3 is set to span = 0 Hz, the demodulation time setting is irrelevant as continuous demodulation is always performed. -
Page 106: Using The Display Line
Y direction. For a display range of 100 dB, it is 0.5 dB. When the line is set with the rotary knob, the R&S FSH3 always uses the step width of the display resolution in the Y direction, e.g. 0.5 dB for a 100 dB level measurement range. The cursor keys, on the other hand, always move the line by 10 % of the display range in the Y direction. -
Page 107: Setting And Using The Measurement Functions
The measured values on the trace are then integrated to give the total power. The R&S FSH3 takes into account the selected display mode (absolute or relative), the selected detector and the resolution bandwidth, which means that the result is comparable to the result that would have been obtained from a thermal power meter. - Page 108 If USER is selected, the R&S FSH3 sets the last channel power measurement setting used in the USER mode. The R&S FSH3 automatically makes changes to the setting so that it is again available when the USER standard is called again.
- Page 109 Setting the reference level: When selecting the reference level, ensure that the R&S FSH3 is not overdriven. As the power is measured with a resolution bandwidth that is small in comparison with the signal bandwidth, the R&S FSH3 may still be overdriven even though the trace is still within the measurement diagram. To prevent the R&S FSH3 from being overdriven, the signal can be measured at the largest resolution...
-
Page 110: Power Measurements On Tdma Signals
R&S FSH3 Power display: The R&S FSH3 displays the power at the bottom of the measurement diagram (Power = nn.n dBm). Usually the trace is not obscured. However, if the trace is in this area of the screen, the power readout can be removed from the screen. - Page 111 USER STANDARD is selected. Setting the measurement time: The measurement time (MEAS TIME) is the time over which the R&S FSH3 performs a power measurement. A value less than or equal to the sweep time can be selected. 1145.5973.12...
- Page 112 To obtain the greatest possible dynamic range for burst signals, the lowest reference level possible must be set. If this is not done, the R&S FSH3 will be overdriven by the measurement signal, if its maximum level exceeds the maximum reference level. Because the R&S FSH3’s resolution bandwidths are implemented digitally after the A/D converter, depending on the resolution bandwidth selected, the signal level at the A/D converter can be higher than the level indicated by the trace.
- Page 113 R&S FSH3 will trigger on the rising edge of the burst. Should this not be the case, the trigger level must be adjusted so that the R&S FSH3 is triggered by the burst edge. Otherwise no measurement will be performed.
-
Page 114: Measuring The Occupied Bandwidth
(99 %) of power is transmitted. One of the measurement functions of the R&S FSH3 is the measurement of occupied bandwidth. After the channel bandwidth has been entered, the R&S FSH3 automatically selects the measurement parameters so that an optimal result is attained. - Page 115 If USER is selected, the R&S FSH3 restores the last setting used in the USER mode for measuring the occupied bandwidth. The R&S FSH3 automatically makes changes to the setting so that it is again available when USER is called again.
- Page 116 "Limit exceeded". Displaying the occupied bandwidth: The R&S FSH3 now displays the occupied bandwidth (OBW: nnn.nn kHz) at the bottom of the measurement diagram. Usually the trace is not obscured. However, if the trace is in this area, the display of the occupied bandwidth can be turned off.
-
Page 117: Measurements Using The Power Sensor
The Power Sensors R&S FSH-Z1 and -Z18 are controlled and powered via a special interface. Connect the power sensor cable to the R&S FSH3’s power sensor connector and screw into position. The DUT is connected to the N-connector on the power sensor. - Page 118 The R&S FSH3 opens the screen for power measurements. If no power sensor is connected, no measured value is displayed. If a power sensor is connected, the R&S FSH3 sets up a connection via its interface and after a few seconds displays the measured power.
- Page 119 The power sensor has a memory containing frequency-dependent correction values. This means that the highest accuracy is reached for signals whose frequency is known. If the R&S FSH3 switches over to the power measurement mode from another operating mode, it uses the center frequency as the frequency for the power sensor.
-
Page 120: Zeroing The Power Sensor
Selecting the unit for the power readout The R&S FSH3 can display measured power in relative units (dBm) or in absolute units in Watts (W, mW, µW, nW and pW). A reference level in dB is also provided by the R&S FSH3. -
Page 121: Setting The Averaging Time
– particularly if signals are at the lower end of the measurement range or are noisy. The R&S FSH3 has three times for power measurements: fast, normal and slow. Stationary sine signals with a high level (> -40 dBm) require only a short measurement time to produce a stabile, accurate result. -
Page 122: Taking Additional Loss Or Gain Into Account
The directional power sensor is controlled and powered via a special serial interface. The sensor cable is to be connected and screwed to the POWER SENSOR connector on the R&S FSH3. The sensor is to be connected between the source and the load. - Page 123 The R&S FSH3 opens the screen for power measurements. If no power sensor is connected, no measured value is displayed. If a power sensor is connected, the R&S FSH3 sets up a connection via its interface and displays, after a few seconds, the type of the sensor connected (R&S FSH-Z44) as well as the measured power.
-
Page 124: Zeroing The Power Sensor
The power sensor has a memory that contains frequency-dependent correction values. This means that the highest accuracy is reached for signals whose frequency is known. When the R&S FSH3 switches to the power measurement mode from another operating mode, it transfers its current center frequency to the power sensor. -
Page 125: Selecting The Unit For The Power Readout
W or mW (absolute value). Moreover, a reference level can be defined relative to which the R&S FSH3 indicates the level difference in dB. Load matching is indicated as return loss in dB or as voltage standing wave ratio (VSWR). - Page 126 Select the Forward Power... parameter. Select dBm or Watt for forward power indication. To ensure that true results are output when measuring modulated signals, the R&S FSH3 offers the possibility of taking correction values into account for a number of common transmission standards.
-
Page 127: Taking Additional Attenuation Into Account
Two-port transfer functions can be determined directly by connecting the input of the DUT to the output of the tracking generator and the DUT’s output to the R&S FSH3’s RF input. A bridge is required to measure the reflection coefficient, e.g. the VSWR Bridge R&S FSH-Z2. - Page 128 (Option FSH-K2) When the tracking generator is switched on, the R&S FSH3 displays Track Gen Uncal . This indicates that tracking generator measurements are uncalibrated. The level axis is in the relative unit dB. Apart from the level values, the 0 dB reference is also displayed. This corresponds to a reference level of -20 dBm in the spectrum analyzer mode (= nominal output level of the tracking generator).
- Page 129 Changing these parameters after calibration invalidates calibration. When you press the MEAS key twice, the R&S FSH3 again opens the menu for selecting the various measurements. 1145.5973.12...
-
Page 130: Measuring The Transfer Function Of Two-Ports
To perform a transfer function measurement, connect the input of the DUT to the generator output and the DUT’s output to the RF input of the R&S FSH3. The R&S FSH3 measures the magnitude of the DUT’s transfer function. The operating sequence is explained below using a transfer function measure- ment on a SAW filter with a center frequency of 380 MHz and a bandwidth of approx. - Page 131 Scalar measurement of transfer function: Press the MEAS key. Press the TRANSM CAL softkey. The R&S FSH3 now prompts you to connect its RF input to the tracking generator output so that calibration can be carried out. Connect the RF input of the R&S RSH3 directly to the tracking generator output without the DUT.
-
Page 132: Vector Measurement Of Transfer Function
5 °C from its temperature when the data set was stored. If the temperature deviation is greater, the R&S FSH3 outputs a (red) dot in front of • Transmission . A precise measurement can then only be made after a calibration. - Page 133 R&S FSH3 vector-calibrated transfer measurement. Connect the DUT between the tracking generator output and the RF input. The R&S FSH3 displays the magnitude of the transfer function of the DUT. 1145.5973.12 4.59...
-
Page 134: Reflection Measurements
RF input connector and the generator’s output. Connect the control cable of the R&S FSH-Z2 with the socket Power Sensor of the R&S FSH3. Connect the RF and Generator port of the R&S FSH-Z2 to the RF input and generator output of the R&S FSH3. - Page 135 R&S FSH3 Setting and Using the Measurement Functions When OPEN calibration is over, the R&S FSH3 prompts the user to perform SHORT calibration. Connect a short to the measurement input of the bridge. Using CONTINUE start the SHORT calibration. Calibration can be aborted with CANCEL.
- Page 136 5 °C from its temperature when the data set was stored. If the temperature deviation is greater, the R&S FSH3 outputs a (red) dot in front of • Reflection . A precise measurement can then only be made after a calibration.
-
Page 137: Vector Measurement Of Reflection
Vector measurement therefore yields higher dynamic range and thus accuracy. With vector measurements, the R&S FSH3 sets the bandwidths (Res BW and Video BW) to a fixed, unchangeable value. It invariably uses the sample detector as a detector. All other measurement parameters can be set as with scalar measurement. - Page 138 The reflection calibration remains valid until the center frequency or the span is changed on the R&S FSH3. Track Gen Uncal is displayed in the top right-hand corner of the screen when calibration is no longer valid. If the reference level is changed (AMPT key, REF softkey) after calibration, greater measurement uncertainty must be anticipated.
-
Page 139: Cable Measurements
The only inputs required are the cable type and the approximate length. Using these parameters, the R&S FSH3 measures the distance to any faults and the degree of mismatch. It is easy to define the cable characteristics with the supplied "FSH View" software package and to transfer them to the R&S FSH3. - Page 140 If the distance to a cable fault is to be located precisely, it is essential to use the appropriate cable model. If not, the R&S FSH3 will not be able to correctly determine the distance of the fault from the measurement plane and the magnitude of the reflection at the fault.
- Page 141 Setting and Using the Measurement Functions Selecting a cable model from a predefined list: Press the CABLE MODEL softkey. The R&S FSH3 displays the list of cable models. Using the rotary knob or the cursor keys, select the appropriate cable model.
- Page 142 The R&S FSH3 uses the cable length to determine the optimal span for the measurement. The longer the cable under test is, the smaller the span used by the R&S FSH3. The R&S FSH3 also calculates the cable attenuation from the selected cable model and the length setting so that the magnitude of the reflection at the fault is measured correctly.
- Page 143 R&S FSH3 Setting and Using the Measurement Functions If the cable attenuation exceeds 10 dB, the R&S FSH3 outputs a warning indicating that the cable attenuation high. also indicates maximum recommended cable length for obtaining accurate results. Pressing CONTINUE accepts the entry.
- Page 144 Note: Calibration is performed over the entire R&S FSH3 frequency range. This eliminates the need for recalibration when a different cable length is selected. The calibration data are saved in the R&S FSH3's internal memory so that calibration remains effective when switchover is made to another operating mode or the instrument is switched off.
- Page 145 R&S FSH3 Setting and Using the Measurement Functions Alternatively to the return loss, the R&S FSH3 can also show the VSWR of the faults. Pressing the AMPT key switches to the VSWR display. Press the AMPT key. Press the RANGE softkey.
- Page 146 The distance to cable faults or the distance between any two faults can also be read off with the marker. Press the MARKER key. The R&S FSH3 opens the marker menu and places the marker on the fault with the largest reflection. The marker readout gives the distance of the fault from the measurement plane in meters and its return loss.
- Page 147 Setting and Using the Measurement Functions As is the case with spectrum analysis, the R&S FSH3 provides functions to automatically position the marker or the marker offset on the trace. These can all be accessed by pressing the SET MARKER softkey.
- Page 148 Setting and Using the Measurement Functions R&S FSH3 The screenshot on the right shows the fault from the preceding measurement zoomed by the factor 6. Faults mainly at the end of the cable can thus be clearly distinguished. Switch the zoom function off as follows: Press the MARKER MODE softkey in the marker menu.
- Page 149 Setting and Using the Measurement Functions With the MARKER OFFSET function, a new reference plane can be defined for the distance-to-fault measurement. If a marker offset is defined, all distance values output by the R&S FSH3 are referenced to the position of the offset marker.
- Page 150 R&S FSH3 automatically switches the VSWR Bridge R&S FSH-Z2 over to the VSWR measurement mode if REFLECTION has been selected. To indicate that the R&S FSH3 is measuring return loss, DTF refl. cal is displayed in the top right-hand corner of the screen.
-
Page 151: Further Information
2048 = number of pixels included in inverse Fourier transform If, in the case of short cable lengths, the 3 GHz frequency range of the R&S FSH3 is not sufficient to set the span obtained with the above formula, the number of pixels calculated for displaying distance to fault is reduced accordingly. -
Page 152: Using Limit Lines
For instance, the upper limits of permissible spurious or harmonics of a DUT are marked by limit lines. In the R&S FSH3, the upper and lower limit value can be preset by way of limit lines. Thus, a spectrum or level characteristic in the time domain (span = 0 Hz) can be checked either visually on the screen or automatically by verifying limit violations. - Page 153 Depending on the application, press the UPPER LIMIT or LOWER LIMIT softkey. The R&S FSH3 displays a list of available limit lines. If no limit line is switched on, the first value in the list is marked. If a limit line has been switched on, the cursor is on the selected item.
- Page 154 All active limit lines can be switched off together with the LIMITS OFF softkey. Measurements with limit lines During a measurement, the R&S FSH3 checks the trace after each frequency sweep for upper and lower limit violations. If all measured values are within specified limits, PASS is displayed at the top in the center of the diagram.
- Page 155 Data sets containing limit lines: The R&S FSH3 stores data sets together with any limit lines that may have been active for the measurement in question. When such a data set is recalled, the associated limit lines are available too.
-
Page 156: Measuring With Transducer Factors
The unit dB does not change the unit set on the R&S FSH3. It can be used, for instance, to compensate for frequency-dependent loss and gain at the input of the R&S FSH3. The units dBµV/m and dBµA/m convert the output power of an antenna into electric or magnetic field strength. - Page 157 Volt and Watt are not permissible. They are deactivated in the units menu. If the unit of the transducer is dBµV/m or dBµA/m, this unit is also used for the R&S FSH3 level display. This means that both the level axis of the diagram and the level at the marker position are assigned the unit of the transducer.
- Page 158 Frequency range of transducer: If the set frequency range is wider than the span in which a transducer is defined, the R&S FSH3 assumes the transducer values outside the defined range to be zero.
-
Page 159: Saving And Loading Instrument Settings And Measurement Results
Saving and Loading Instrument Settings and Measurement Results The R&S FSH3’s settings and measurement results can be saved to the internal memory and recalled at a later date. Using the R&S FSH View software package, these data sets can also be saved to a PC from the R&S FSH3 or downloaded onto the R&S FSH3 from a PC. -
Page 160: Entering A Data Set Name
The data set name comprises a text section and a numerical extension, which are separated by a full stop. The data set name suggested by the R&S FSH3 is derived from the name of the data set last stored, the numerical extension being incremented by 1 in each case. -
Page 161: Loading Measurement Results
The user can now transfer the data set with ACTIVATE and with this setting return to the associated R&S FSH3 measurement mode, print out the measurement and settings stored in the data set to a printer using PRINT, press EXIT to quit the setting again. -
Page 162: Deleting Saved Data Sets
The data set is cleared from the R&S FSH3’s memory and removed from the list. Deleting all data sets Starting from the DATASET LIST mode, all the data sets in the R&S FSH3’s memory can be completely deleted by pressing the DELETE ALL DATASETS softkey. -
Page 163: Printing Out Measurement Results
Printing out Measurement Results Printing out Measurement Results An R&S FSH3 screenshot can be printed out on a printer. The printer type and the baud rate for the serial connection can be selected in the setup menu using the GENERAL / PRINTER... softkey. -
Page 164: Measurements
Measurements R&S FSH3 Measurements How a spectrum analyzer operates Basically, an RF signal can either be analyzed in the time domain or in the frequency domain. In the time domain, how the signal varies with time can be observed on an oscilloscope, for example. In the frequency domain, a spectrum analyzer can be used to display the frequency components of a signal. - Page 165 The precision attenuator at the input of the R&S FSH3 is adjustable in 10 dB steps from 0 dB to 30 dB and is directly coupled to the reference level setting.
- Page 166 IF filter cannot be resolved. This is why the bandwidth of the IF filter in a spectrum analyzer is referred to as the resolution bandwidth. The R&S FSH3 has resolution bandwidths from 1 kHz to 1 MHz.
- Page 167 The detector comes after the video filter. The detector combines the measured spectrum so that it can be represented as one pixel in the trace. The R&S FSH3 uses 301 pixels to form the trace, i.e. the whole measured spectrum has to be represented using just 301 pixels. Common types of spectrum analyzer detectors are the peak detector (PEAK), the sample detector (SAMPLE) and the RMS detector (RMS).
- Page 168 Measurements R&S FSH3 The Fig. above shows 30 measured values which are represented by a single pixel. The peak detector determines and displays the maximum measured value. The Auto Peak detector takes the maximum and minimum and displays them together. The two values are joined by a vertical line segment. This gives a good indication of the level variation over the measured values represented by a single pixel.
Need help?
Do you have a question about the FSH3 and is the answer not in the manual?
Questions and answers