
Subscribe to Our Youtube Channel
Related Manuals for Rohde & Schwarz R&S FSH Series


Summary of Contents for Rohde & Schwarz R&S FSH Series
- Page 1 Test and Measurement Division Operating Manual Handheld Spectrum Analyzer R&S 1145.5850.03 1145.5850.13 1145.5850.23 1145.5850.06 1145.5850.26 1145.5973.12-11-...
- Page 2 Dear Customer, R&S® is a registered trademark of Rohde & Schwarz GmbH & Co. KG. Trade names are trademarks of the owners. 1145.5973.12-11-...
-
Page 3: Table Of Contents
R&S FSH Contents Contents Specifications Safety Instructions Certificate of Quality EC-Certificate of Conformity Support Center Address List of R&S Representatives 1 Putting into Operation ......................1.1 Front view ............................1.1 Putting into Operation ........................1.2 Unpacking the Instrument......................1.2 Setting up the Instrument ......................1.3 Switching on the Spectrum Analyzer..................1.4 Spectrum Analyzer Connectors....................1.5 Screen Settings ..........................1.7... - Page 4 Contents R&S FSH 2 Getting Started ..........................2.1 Measurements on CW Signals ......................2.1 Level measurement ........................2.1 Setting the Reference Level .......................2.2 Frequency Measurements......................2.3 Harmonic Measurements of a Sinewave Signal.................2.4 Power Measurements Using the Power Sensor ................2.5 Power and Return Loss Measurements with the R&S FSH-Z14 or the R&S FSH-Z44.....2.7 Two-Port Transmission Measurements..................2.9 Measurement of Return Loss ....................
- Page 5 R&S FSH Contents 3 Operation ............................3.1 Screen Layout...........................3.1 Screen layout for spectrum-mode measurements without markers...........3.1 Screen layout when the marker mode is selected ..............3.2 Entering Measurement Parameters....................3.3 Entering values and texts ......................3.3 Entering units..........................3.4 Menu Overview ..........................3.5 Frequency entry........................3.5 Frequency span ........................3.5 Level setting..........................3.5 Bandwidth setting ........................3.5 Sweep ............................3.6...
- Page 6 Contents R&S FSH 4 Instrument Functions .......................4.1 Instrument Default Setup.........................4.1 Status Display...........................4.1 Setting the Frequency........................4.2 Entering the center frequency ....................4.2 Setting a frequency offset......................4.2 Entering the center-frequency step size..................4.3 Entering the start and stop frequency ..................4.4 Working with channel tables.......................4.4 Setting the Span ..........................4.6 Setting the Amplitude Parameters ....................4.7 Setting the reference level......................4.8...
- Page 7 R&S FSH Contents Setting and Using the Measurement Functions................. 4.34 Measuring the channel power of continuously modulated signals......... 4.34 Selecting the standard ......................4.35 Setting the reference level....................... 4.37 Setting the channel bandwidth ....................4.37 Changing the span........................4.38 Power display .......................... 4.39 Power measurements on TDMA signals..................
- Page 8 Contents R&S FSH Using the R&S FSH in receiver mode ..................4.61 Setting the frequency....................... 4.62 Setting the reference level....................... 4.64 Setting the bandwidth ......................4.65 Setting the detector........................4.66 Setting the measurement time....................4.66 Measurement on multiple frequencies or channels (scan)............4.67 Measurements using the power sensor ..................
- Page 9 R&S FSH Contents Cable Measurements ........................4.103 Cable selection ........................4.104 Selecting the frequency range....................4.107 Calibrating the test setup....................... 4.108 Locating cable faults by means of the marker function ............4.111 Measuring spectrum and reflection ..................4.114 Further information ........................ 4.115 Setting the span ......................
- Page 10 ® ® R&S FSH3 and R&S FSH6 Data Sheet Specifications Specifications are valid under the following conditions: 15 minutes warm-up time at ambient temperature, specified environmental conditions met and calibration cycle adhered to. Data without tolerances: typical values. Data designated as "nominal": design parameters, i.e. not tested. ®...
- Page 11 ® ® Data Sheet R&S FSH3 and R&S FSH6 ® ® Specification Condition R&S FSH3 R&S FSH6 Displayed average noise level average value, resolution bandwidth 1 kHz, video bandwidth 10 Hz, reference level ≤ -30 dBm 10 MHz to 3 GHz <-105 dBm, <-105 dBm, typ.
- Page 12 ® ® R&S FSH3 and R&S FSH6 Data Sheet ® ® Specification Condition R&S FSH3 R&S FSH6 Markers Number of markers or delta max. 6 markers Marker functions peak, next peak, minimum, center = marker frequency, reference level = marker level, all markers to peak Marker displays normal (level), noise marker, frequency counter (count)
- Page 13 ® ® Data Sheet R&S FSH3 and R&S FSH6 Accessories ® ® Power Sensors R&S FSH-Z1 and R&S FSH-Z18 Frequency range ® R&S FSH-Z1 10 MHz to 8 GHz ® R&S FSH-Z18 10 MHz to 18 GHz VSWR 10 MHz to 30 MHz <1.15 30 MHz to 2.4 GHz <1.13...
- Page 14 ® ® R&S FSH3 and R&S FSH6 Data Sheet Range of typical measurement error with modulation FM, PM, FSK, GMSK 0 % of measured value (0 dB) ±3 % of measured value (±0.13 dB) AM (80 %) 2 CW carriers with identical ±2 % of measured value (±0.09 dB) *) if standard is selected ®...
- Page 15 ® ® Data Sheet R&S FSH3 and R&S FSH6 Power-handling capacity Dimensions 120 mm x 95 mm x 39 mm, connecting cable 1.5 m Weight 0.65 kg 1145.5973.12 TI.6 E-11...
- Page 16 ® ® R&S FSH3 and R&S FSH6 Data Sheet ® Directional Power Sensor R&S FSH-Z44 Frequency range 200 MHz to 4 GHz Power measurement range 30 mW to 300 W VSWR referenced to 50 Ω <1.07 200 MHz to 3 GHz <1.12 3 GHz to 4 GHz Power-handling capacity...
- Page 17 ® ® Data Sheet R&S FSH3 and R&S FSH6 Measurement uncertainty 18 °C to 28 °C same as for average power plus effect of peak hold circuit Error limits of peak hold circuit for burst signals Duty cycle ≥ 0.1 and video bandwidth 4 kHz ±(3 % of measured value + 0.05 W) starting from a...
- Page 18 ® ® R&S FSH3 and R&S FSH6 Data Sheet Power-handling capacity PEAK (max 10 ms), SWR < 3 1000 AVG -10 °C to 35 °C SWR < 1.5 AVG -10 °C to 35 °C SWR < 3 AVG 35 °C to 50 °C SWR <...
- Page 19 ® ® Data Sheet R&S FSH3 and R&S FSH6 ® ® VSWR Bridge R&S FSH-Z2 / R&S FSH-Z3 ® ® R&S FSH-Z2 R&S FSH-Z3 Frequency range 10 MHz bis 3 GHz 10 MHZ bis 3 GHz Impedance VSWR bridge Directivity 10 MHz to 30 MHz typ.
- Page 20 ® ® R&S FSH3 and R&S FSH6 Data Sheet Return loss > 43 dB > 40 dB, typ. 46 dB > 37 dB, typ. 43 dB Power-handling capacity ® Distance-to-Fault Measurement R&S FSH-B1 ® ® (only with R&S FSH3 models 1145.5850.13, 1145.5850.23 and R&S FSH6 model 1145.5850.26) Display 301 pixels...
- Page 21 ® ® Data Sheet R&S FSH3 and R&S FSH6 ® ® Specification Condition R&S FSH3 R&S FSH6 ® ® Transmission measurements (only with R&S FSH3 models 1145.5850.13, 1145.5850.23 and R&S FSH6 model 1145.5850.26) Frequency range 10 MHz to 3 GHz 10 MHz to 6 GHz Dynamic range 10 MHz to 2.2 GHz...
- Page 22 ® ® R&S FSH3 and R&S FSH6 Data Sheet General data 14 cm (5.7") LC color display Display Resolution 320 x 240 pixels CMOS RAM Memory Settings and traces Environmental conditions Temperature Operating temperature range ® R&S FSH powered from internal battery 0 °C to 50 °C ®...
- Page 23 ® ® Data Sheet R&S FSH3 and R&S FSH6 Order No. ® Handheld Spectrum Analyzer R&S FSH3 1145.5850.03 100 kHz to 3 GHz, with preamplifier ® Handheld Spectrum Analyzer R&S FSH3 1145.5850.13 100 kHz to 3 GHz, with tracking generator ®...
- Page 24 ® ® R&S FSH3 and R&S FSH6 Data Sheet ® ® Carrying Bag for the R&S R&S FSH-Z25 1145.5896.02 ® ® Transit Case for the R&S R&S FSH-Z26 1300.7627.00 ® Spare Combined Short/Open and 50 Ω Load for R&S FSH-Z28 1300.7804.02 VSWR and DTF calibration, DC to 6 GHz ®...
- Page 25 Safety Instructions This unit has been designed and tested in accordance with the EC Certificate of Conformity and has left the manufacturer’s plant in a condition fully complying with safety standards. To maintain this condition and to ensure safe operation, the user must observe all instructions and warnings given in this operating manual.
- Page 26 Safety Instructions 11. The outside of the instrument is suitably 12. Any additional safety instructions given in this manual are also to be observed. cleaned using a soft, lint-free dustcloth. Never use solvents such as thinners, acetone and similar things, as they may damage the front panel labeling or plastic parts.
- Page 27 R&S FSH Certificate of quality Certificate of quality Dear Customer, You have decided to buy a Rohde & Schwarz product. You are thus assured of receiving a product that is manufactured using the most modern methods available. This product was developed, manufactured and tested in compliance with our quality management system standards.
- Page 28 EC Certificate of Conformity Certificate No.: 2002-41 This is to certify that: Equipment type Stock No. Designation FSH3 1145.5850.03/.13/.23 Handheld Spectrum Analyzer FSH6 1145.5850.06/.26 FSH-Z1 1155.4505.02 Average Power Sensor FSH-Z18 1165.1909.02 Average Power Sensor FSH-Z2 1145.5767.02 VSWR Bridge and Power Driver FSH-Z32 1145.5796.02 Spare Batterie Pack...
- Page 29 R&S FSH Support Center Support Center Should you have any technical questions concerning this Rohde & Schwarz product, please contact the hotline of Rohde & Schwarz Vertriebs-GmbH, Support Center. Our hotline team will answer your questions and find solutions to your problems. You can reach the hotline Monday through Friday from 8:00 until 17:00.
- Page 30 Adressen/Addresses FIRMENSITZ/HEADQUARTERS (Tel) Phone Austria Rohde & Schwarz-Österreich Ges.m.b.H. (Tel) +43 (1) 602 61 41-0 (Fax) Fax Am Europlatz 3 (Fax) +43 (1) 602 61 41-14 E-mail Gebäude B rs-austria@rsoe.rohde-schwarz.com 1120 Wien Rohde & Schwarz GmbH & Co. KG (Tel) +49 (89) 41 29-0 Mühldorfstraße 15 ·...
- Page 31 Adressen/Addresses China Rohde & Schwarz China Ltd. (Tel) +86 (28) 86 52 76 06 Germany Zweigniederlassung Büro Bonn (Tel) +49 (228) 918 90-0 Representative Office Chengdu (Fax) +86 (28) 86 52 76 10 Josef-Wirmer-Straße 1-3 · D-53123 Bonn (Fax) +49 (228) 25 50 87 Unit G, 28/F, First City Plaza sophia.chen@rsbp.rohde- Postfach 140264 ·...
- Page 32 Adressen/Addresses Kazakhstan Rohde & Schwarz Kazakhstan (Tel) +7 (32) 72 67 23 54 India Rohde & Schwarz India Pvt. Ltd. (Tel) +91 (22) 26 30 18 10 Representative Office Almaty (Fax) +7 (32) 72 67 23 46 Mumbai Office (Fax) +91 (22) 26 73 20 81 Pl.
- Page 33 Adressen/Addresses Netherlands Rohde & Schwarz Nederland B.V. (Tel) +31 (30) 600 17 00 Saudi Arabia Gentec (Tel) +966 (1) 293 20 35 Perkinsbaan 1 (Fax) +31 (30) 600 17 99 Haji Abdullah Alireza & Co. Ltd. (Fax) +966 (1) 466 16 57 3439 ND Nieuwegein info@rsn.rohde-schwarz.com P.O.Box 43054...
- Page 34 Adressen/Addresses United Rohde & Schwarz UK Ltd. (Tel) +44 (870) 735 16 42 Taiwan Rohde & Schwarz Taiwan (Pvt.) Ltd. (Tel) +886 (2) 28 93 10 88 Kingdom 3000 Manchester Business Park (Fax) +44 (1252) 81 14 77 Floor 14, No. 13, Sec. 2, Pei-Tou Road (Fax) +886 (2) 28 91 72 60 Aviator Way sales@rsuk.rohde-schwarz.com...
-
Page 35: Putting Into Operation
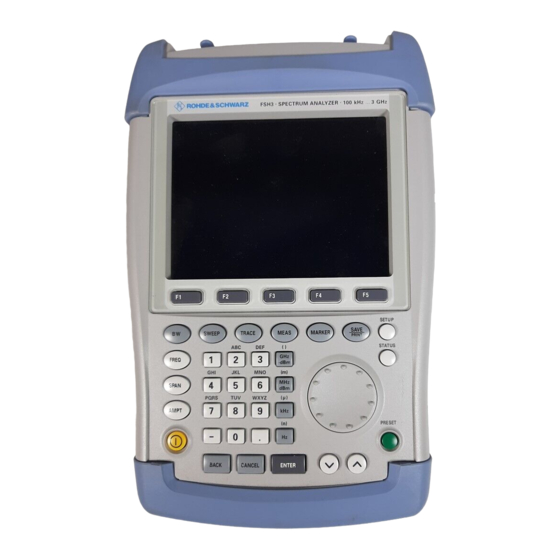
R&S FSH Front view 1 Putting into Operation Front view Connector for External trigger /external power sensor reference input BNC connector Generator output RF input N connector N connector Connector for Connector for headphones AC power supply Display RS-232-C Softkey optical interface labels Softkeys... -
Page 36: Putting Into Operation
Putting into Operation R&S FSH Putting into Operation The following section describes how to put the handheld spectrum analyzer into operation and how to connect external devices, e.g. printers. Section 2 describes the operation of the spectrum analyzer using simple measurements as examples. Unpacking the Instrument The R&S FSH comes in formfitting packaging that consists of upper and lower shells. -
Page 37: Setting Up The Instrument
R&S FSH Putting into Operation Setting up the Instrument The Handheld Spectrum Analyzer R&S FSH has been designed for operation in labs as well as for on- site use for service and maintenance applications. For any application, the R&S FSH can be set up to optimize ease of operation and the viewing angle of the display. -
Page 38: Switching On The Spectrum Analyzer
Putting into Operation R&S FSH Switching on the Spectrum Analyzer The R&S FSH can be powered using either the included power supply unit or internal battery. When fully charged, the built-in nickel metal hydride battery provides an operating time of about four hours. On delivery, the battery in the R&S FSH may be flat. -
Page 39: Spectrum Analyzer Connectors
R&S FSH Putting into Operation Spectrum Analyzer Connectors The R&S FSH has the following connectors: RF input Connect the RF input via a cable with an N connector to the DUT. Make sure that it is not overloaded. The maximum permissible continuous power at the RF input is 20 dBm (100 mW). It can be loaded with up to 30 dBm (1 W) for a maximum of three minutes. - Page 40 Putting into Operation R&S FSH RS-232-C optical interface (on the right-hand side of the R&S FSH; can be accessed by folding out the stand) The RS-232-C optical interface is for connecting a printer or PC. The R&S FSH-Z34 RS-232-C optical cable or the FSH-Z37 USB optical cable R&S is used to make the connection.
-
Page 41: Screen Settings
R&S FSH Putting into Operation Screen Settings The R&S FSH’s screen is a transflective, passive color LCD. Indoors, its brightness depends on the intensity of the backlighting. If light irradiation is strong, the ambient light supports readability. The viewing angle can be optimized by adjusting the contrast. To achieve maximum contrast, the screen can be switched from color display to black-and-white display. - Page 42 Putting into Operation R&S FSH Setting the screen color ! Press the SETUP key. ! Press the DISPLAY softkey. The submenu with the contrast, lighting and color settings opens. ! Using the rotary knob or cursor keys, select TYPE... and confirm with the ENTER key or by pressing the DISPLAY softkey again.
-
Page 43: Country-Specific Settings
R&S FSH Putting into Operation Country-Specific Settings The R&S FSH is “multilingual” and can display text in the language of your choice. The softkey lettering is always in English. The default setting (factory-setting) is also English. Selection ! Press the SETUP key. The R&S FSH displays all default settings. -
Page 44: Setting The Date And Time
Putting into Operation R&S FSH Setting the Date and Time The R&S FSH has an internal clock that can apply a date and time stamp, e.g. for output to a printer or stored data records. The user can reset the date and time. Setting the date ! Press the SETUP key. -
Page 45: Charging The Battery
R&S FSH Charging the Battery Charging the Battery The R&S FSH is fitted with a nickel metal hydride battery. The operating time is approx. four hours at room temperature if the battery is fully charged. Note: The battery in the R&S FSH is not charged when it leaves the factory. It must therefore be charged after delivery. -
Page 46: Selecting The Instrument Default Setup
Selecting the Instrument Default Setup R&S FSH The auto power down mode is set as follows: ! Press the GENERAL key. The R&S FSH opens the submenu with the general settings. The cursor is positioned to POWER DOWN in the menu. ! Confirm the POWER DOWN selection by pressing the ENTER key. -
Page 47: External Reference / External Trigger Switchover
R&S FSH External Reference / External Trigger Switchover The parameters defined in the data set for the default setup are now used as the preset settings. If no user-specific default setup is defined, CUSTOM is inactive and cannot be selected. The data set defined as the user default setup can be viewed using the R&S FSH's recall function. -
Page 48: Controlling The Rf Attenuator
Controlling the RF Attenuator R&S FSH Controlling the RF Attenuator Depending on the selected reference level, the R&S FSH sets the attenuator on the RF input to a suitable value. It offers two modes: one for the highest possible sensitivity (LOW NOISE) and one for the lowest possible intermodulation products (LOW DISTORTION). - Page 49 R&S FSH Using a Preamplifier If the preamplifier is switched on, its use is coupled to the reference level, thus ensuring the optimum dynamic range of the R&S FSH at all times. The table below shows the positions of the RF attenuator and the preamplifier as a function of the reference level.
-
Page 50: Pin Entry
PIN Entry R&S FSH PIN Entry To prevent unauthorized use, the R&S FSH can be protected with a personal identification number (PIN). When the R&S FSH is delivered, the PIN is set to 0000 and PIN entry is disabled when the R&S FSH is switched on. - Page 51 R&S FSH PIN Entry The selected PIN is now activated. The next time you switch on the R&S FSH, you must enter the PIN before you can operate the instrument. If you enter an incorrect PIN , the R&S FSH again prompts you for the PIN code.
-
Page 52: Connecting Printers
Connecting Printers R&S FSH Connecting Printers The R&S FSH can output a screenshot to a printer equipped with an RS-232-C interface. The Serial/Parallel Converter R&S FSH-Z22 is available as an accessory for printers with a parallel interface. A printer with an RS-232-C interface can be directly connected using the R&S FSH-Z34 RS-232-C optical cable. - Page 53 R&S FSH Connecting Printers Note: The R&S FSH-Z22 is designed for a data transmission rate of max. 38 400 baud (= default setting). Therefore, set the baud rate (PRINTER BAUD RATE) in the SETUP menu to 38 400 baud. The baud rates 9600 baud and 19 200 baud can also be set on the R&S FSH-Z22 by opening its housing.
-
Page 54: Setting The Baud Rate For Remote Control
Setting the Baud Rate for Remote Control R&S FSH Setting the Baud Rate for Remote Control The R&S FSH offers different baud rates for remote control. The desired baud rate is set via the setup menu. ! Press the SETUP key. ! Press the GENERAL softkey. -
Page 55: Checking The Installed Options
R&S FSH Checking the Installed Options Checking the Installed Options The R&S FSH displays the installed options in the Setup menu so you can check them: ! Press the SETUP key. ! Using the rotary knob or the cursor keys, scroll the status display downwards. -
Page 56: Getting Started
R&S FSH Measurements on CW Signals 2 Getting Started This section explains the basic operation of the Handheld Spectrum Analyzer R&S FSH using some simple measurements as examples. A more detailed description of operation and functions, such as selecting menus and setting measurement parameters, is provided in section 3 of this manual. Measurements on CW Signals A basic task performed by spectrum analyzers is measuring the level and frequency of sinewave signals. -
Page 57: Setting The Reference Level
Measurements on CW Signals R&S FSH ! Press the FREQ key. ! Enter “100” using the numeric keypad and confirm the entry with the MHz key. ! Press the SPAN key. ! Enter “10” using the numeric keypad and confirm the entry with the MHz key. -
Page 58: Frequency Measurements
R&S FSH Measurements on CW Signals Using markers is also an effective way to shift the trace maximum so that it coincides with the top of the measurement diagram. If the marker is positioned on the trace maximum (as in the example), the reference level can be set to the marker level by entering the following keystrokes: ! Press the MARKER key. -
Page 59: Harmonic Measurements Of A Sinewave Signal
Measurements on CW Signals R&S FSH Harmonic Measurements of a Sinewave Signal Since a spectrum analyzer can resolve different signals in the frequency domain, it is ideal for measuring harmonic levels or harmonic ratios. To speed up these operations, the R&S FSH has marker functions that deliver fast results with only a few keystrokes. -
Page 60: Power Measurements Using The Power Sensor
R&S FSH Measurements on CW Signals Power Measurements Using the Power Sensor For highly accurate power measurements, the R&S FSH provides the Power Sensor R&S FSH-Z1 or R&S FSH-Z18 as options. They measure power in the span 10 MHz to 8 GHz or 10 MHz to 18 GHz, respectively. - Page 61 Measurements on CW Signals R&S FSH ! Press the ZERO softkey. The R&S FSH outputs a message telling you not to apply any signals to the power meter while zeroing is being performed. ! Disconnect the power sensor from any signal sources.
-
Page 62: Power And Return Loss Measurements With The R&S Fsh-Z14 Or The R&S Fsh-Z44
R&S FSH Measurements on CW Signals Power and Return Loss Measurements with the R&S FSH-Z14 or the R&S FSH-Z44 The Directional Power Sensors R&S FSH-Z14 and R&S FSH-Z44 are connected between the source and the load and measure the power flux in both directions, i.e. from the source to the load (forward power) and from the load to the source (reverse power). - Page 63 Measurements on CW Signals R&S FSH The R&S FSH opens the screen and the menu for the power measurement. If no power sensor is connected, no measured value is displayed. If a power sensor is connected, the R&S FSH establishes a connection to the power sensor via the interface and, after a few seconds, displays the connected power sensor type (R&S FSH-Z14 or R&S FSH-Z44) as well as the measured forward power and return loss of the load.
-
Page 64: Two-Port Transmission Measurements
R&S FSH Measurements on CW Signals Two-Port Transmission Measurements (Only for R&S FSH with tracking generator: order no. 1145.5850.13, 1145.5850.23 or 1145.5850.26.) For measurements of the gain or attenuation of two-port devices, the R&S FSH provides a tracking generator which generates a sinewave signal exactly at the receive frequency of the R&S FSH. ! Press the MEAS key. - Page 65 Measurements on CW Signals R&S FSH ! In the main menu for the tracking generator, press the MEAS key. ! Press the TRANSM CAL softkey. The R&S FSH now prompts you to connect the RF input to the tracking generator’s output so that calibration can be carried out.
-
Page 66: Measurement Of Return Loss
R&S FSH Measurements on CW Signals Measurement of Return Loss (Only for R&S FSH with tracking generator: order no. 1145.5850.13, 1145.5850.23 or 1145.5850.26.) For reflection measurements, the VSWR Bridge and Power Divider R&S FSH-Z2 or R&S FSH-Z3 and a short standard (supplied with the R&S FSH-Z2) are needed. The R&S FSH-Z2 or R&S FSH-Z3 is screw-connected to the RF input connector and the generator’s output. - Page 67 Measurements on CW Signals R&S FSH Calibrate the R&S FSH for the return loss measurement. The following example shows a scalar measurement of return loss. If the option R&S FSH-K2 is installed, measurement must first be switched to scalar. ! Press the MEAS key. ! Press the MEAS MODE softkey.
- Page 68 R&S FSH Measurements on CW Signals The transmission calibration remains valid until the R&S FSH’s center frequency or span is changed. If calibration becomes invalid, the R&S FSH displays Track Gen Uncal in the upper right-hand corner of the screen. If the reference is changed after calibration, a larger measurement uncertainty must be anticipated.
-
Page 69: Performing Distance-To-Fault Measurements
Measurements on CW Signals R&S FSH Performing Distance-To-Fault Measurements (Only for the R&S FSH with the tracking generator (order no. 1145.5850.13, 1145.5850.23 or 1145.5850.26), installed option R&S FSH-B1 (distance-to-fault measurement) and VSWR Bridge and Power Divider R&S FSH-Z2 or R&S FSH-Z3). Measurement cable VSWR Bridge... - Page 70 R&S FSH Measurements on CW Signals To perform distance-to-fault cable measurements, the R&S FSH needs to be informed about the type of cable and its approximate length. Frequency-dependent cable models can be generated with the supplied R&S FSH View software for Windows and loaded onto the R&S FSH. The procedure is described in the R&S FSH View manual.
- Page 71 Measurements on CW Signals R&S FSH Please refer to the cable manufacturer's data sheet for the velocity factor (= speed of the wave in the cable relative to the speed of light) and the attenuation of the cable per meter or per foot at the specified frequency.
- Page 72 R&S FSH Measurements on CW Signals Calibration tip: The R&S FSH performs calibration over its entire span. Therefore, recalibration is not necessary after the cable length is changed. The calibration data is stored in the R&S FSH memory. Thus, the calibration is valid after the operating mode is changed or after the instrument is switched off.
- Page 73 Measurements on CW Signals R&S FSH ! Press the MARKER key. The R&S FSH opens the marker menu and places the distance marker on the largest return loss. The marker readout provides the distance of the reflection from the measurement plane in meters and its return loss. ! Change the distance marker by entering a number, adjusting the rotary knob (pixel by pixel) or by using the cursor keys (step = 10 % of the span).
- Page 74 R&S FSH Measurements on CW Signals The R&S FSH measures the return loss over the span that has been selected for the distance-to-fault cable measurement. To indicate that the R&S FSH is measuring return loss, DTF refl. cal is displayed in the upper right-hand corner of the screen.
-
Page 75: Operation In Receiver Mode
Operation in Receiver Mode R&S FSH Operation in Receiver Mode (Available only if the option R&S FSH-K3 is installed.) To provide a means of measuring levels at a specific frequency, the R&S FSH offers the receiver mode as an option (option R&S FSH-K3). With this option, the R&S FSH functions like a receiver that measures the level at a predefined frequency. - Page 76 R&S FSH Operation in Receiver Mode Selecting the frequency step size: The frequency resolution in the receiver mode is 100 Hz. The tuned step size can be changed as required for the application ! Press the FREQ key. ! Press the FREQ STEPSIZE softkey. ! Set the required step size in the selection table.
- Page 77 Operation in Receiver Mode R&S FSH Direct entry of a channel table: ! If the channel display is active (CHANNEL MODE softkey active in the FREQ menu), press the CHANNEL TABLE softkey. ! Press the SELECT USER TAB softkey. The R&S FSH will use the last channel table that was entered directly. ! Press the DEFINE USER TAB softkey.
- Page 78 R&S FSH Operation in Receiver Mode Selecting the bandwidth: The receiver mode provides the same bandwidths as in analyzer operation. In addition, the three bandwidths 200 Hz, 9 kHz and 120 kHz are available for EMI measurements in accordance with CISPR16.
- Page 79 Operation in Receiver Mode R&S FSH Scanning in the receiver mode: In the receiver mode, the R&S FSH can scan across a defined number of frequencies and graphically display the results. It performs a measurement at each frequency for the defined measurement time. ! Press the SPAN softkey.
-
Page 80: Measuring The Carrier-To-Noise Ratio
R&S FSH Measuring the Carrier-to-Noise Ratio Measuring the Carrier-to-Noise Ratio (Available as of firmware version 8.0 or higher.) The R&S FSH offers a carrier/noise measurement for measuring the ratio of carrier power to noise power. It performs the measurement in two steps. First, the carrier power of a transmission channel is measured or a reference power determined which is then used for C/N calculation. -
Page 81: Reference Power/Reference Level
Measuring the Carrier-to-Noise Ratio R&S FSH Reference power/reference level To determine the reference, you need to enter the type of reference measurement, the reference channel and the channel bandwidth of the reference channel. Selecting the reference measurement: Press the SELECT MEASURE softkey. Using the rotary knob or the cursor keys, select the desired measurement method to determine the reference carrier power (Digital Tx, Analog TV or CW Tx) and confirm your choice with the ENTER key or the F1 softkey. -
Page 82: Measuring The Noise Power
R&S FSH Measuring the Carrier-to-Noise Ratio Measuring the noise power Enter an unoccupied transmission channel and its channel bandwidth to determine the noise power. Selecting the result display: Press the SELECT MEASURE softkey. Using the rotary knob or the cursor keys, select the desired result display (C/N or C/N ) and confirm your choice with the ENTER key or the F1 softkey. -
Page 83: Saving And Recalling Settings And Test Results
Saving and Recalling Settings and Test Results R&S FSH Saving and Recalling Settings and Test Results Instrument settings and results can be saved to the R&S FSH’s internal CMOS RAM. Results and settings are always stored together, allowing them to be interpreted in context when recalled. The R&S FSH can store a maximum of 100 data sets, each with a unique name. -
Page 84: Saving Calibration Data
R&S FSH Saving and Recalling Settings and Test Results ! Use the ∨ key to move the cursor to the left. ! Use the ∧ key to move the cursor to the right. ! Insert a new letter or number at the cursor position using the alphanumeric keypad. ! Press the BACK key to delete the letter or digit to the left of the cursor. -
Page 85: Recalling Measurement Results
Saving and Recalling Settings and Test Results R&S FSH Recalling Measurement Results Use the R&S FSH’s recall function to review previously saved measurement results and settings. ! Press the SAVE / PRINT key. ! Press the RECALL softkey. A list of all saved data sets opens. The red selection bar marks the last data set to be saved. - Page 86 R&S FSH Printing Out Measurement Results Printing Out Measurement Results The R&S FSH can send screenshots to a printer equipped with a serial interface. The type of printer and the baud rate of the serial interface can be defined in the setup menu (SETUP key) by using the GENERAL softkey and selecting 'PRINTER BAUD...' and 'PRINTER TYPE...' from the menu.
-
Page 87: Operation
R&S FSH Screen Layout 3 Operation Screen Layout Screen layout for spectrum-mode measurements without markers Trigger Detector Trace mode Parameter uncoupled display display display Display of resolution bandwidth (RBW), Reference video bandwidth (VBW) and level display sweep time (SWT) Invalid-trace symbol Grid Level-axis scale... -
Page 88: Screen Layout When The Marker Mode Is Selected
Screen Layout R&S FSH Screen layout when the marker mode is selected Marker-value Display: readout Setting not coupled Marker Delta marker Selected menu item Softkey menu Softkey activated Softkey function on for entry The colour of the softkey labelling and its background indicate the status of the softkey function in question: Softkey colour Meaning... -
Page 89: Entering Measurement Parameters
R&S FSH Entering Measurement Parameters Entering Measurement Parameters Settings and texts are entered either by directly calling the functions or by entering values, units or texts separately. The R&S FSH has a variety of operating modes. Alphanumeric Rotary knob keypad Unit keys BACK key Cursor keys... -
Page 90: Entering Units
Entering Measurement Parameters R&S FSH Entering units To enter a unit for a value entry, terminate the entry with a unit key. Use the unit keys down the right- hand side of the alphanumeric keypad. These keys have multiple assignments which depend on the unit entry expected by the R&S FSH. -
Page 91: Menu Overview
R&S FSH Menu Overview Menu Overview Frequency entry CENTER START STOP FREQ FREQ FREQ STEPSIZE FREQ FREQ OFFSET 0.1 x SPAN =CENTER MANUAL... Frequency span MANUAL FULL ZERO LAST SPAN SPAN SPAN SPAN SPAN Level setting AMPT RANGE UNIT OFFSET INPUT 10 dB/DIV 5 dB/DIV... -
Page 92: Sweep
Menu Overview R&S FSH Sweep MANUAL AUTO CONT SINGLE SWEEP TRIGGER SWPTIME SWPTIME SWEEP SWEEP FREE RUN VIDEO... EXTERN EXTERN DELAY... Trace setting TRACE TRACE-> SHOW TRACE DETECTOR ZOOM MODE MEMORY MEMORY CLEAR/WRITE AUTO COUPLED AVERAGE AUTO PEAK MIN HOLD MIN PEAK MAX HOLD MAX PEAK... -
Page 93: Measurement Functions
R&S FSH Menu Overview Measurement functions TRANS LIMIT DISPLAY MEAS MEASURE DUCER LINES LINE ANALYZER RECEIVER TRACKING GEN POWER SENSOR CARRIER / NOISE CHANNEL POWER DISTANCE TO FAULT OCCUPIED BW REFLECTION TDMA POWER SPECTRUM DISTANCE TO FAULT ISOTROPIC ANTENNA CABLE CABLE MEAS LIST... - Page 94 Menu Overview R&S FSH Power meter menus Transducer menus TRANS LIMIT DISPLAY MEAS MEASURE DUCER LINES LINE TRANSD TRD'S EXIT TRANSD TRANSD LIST -> SELECT EXIT PRINTER 1145.5973.12 E-11...
- Page 95 R&S FSH Menu Overview Limit line menus TRANS LIMIT DISPLAY MEAS MEASURE DUCER LINES LINE BEEP... MESSAGE... UPPER LOWER LIMITS EXIT OPTIONS LIMIT LIMIT LIMIT LIST -> SELECT EXIT PRINTER VSWR EXIT OPTIONS LIMIT Smith Chart Option FSH-K2 BEEP... MESSAGE... Menus for measurements with isotropic sensor 1145.5973.12 E-11...
-
Page 96: Markers
Menu Overview R&S FSH Markers Analyzer mode: DELTA MARKER MARKER MARKER MARKER MARKER MARKER MODE DEMOD PEAK NORMAL NEXT PEAK NOISE MINIMUM FREQ COUNT CENTER = MRK FREQ TIME... MULTIMARKER REF LVL = MRK LVL VOLUME... ALL MKR TO PEAK Analyzer mode, multimarker switched on: DELTA MARKER... -
Page 97: Save And Print Menu
R&S FSH Menu Overview Save and print menu SAVE/ SCREEN-> SAVE DELETE RECALL PRINT PRINTER DELETE LIST -> DELETE EXIT RECALL PRINTER SCREEN-> EXIT ACTIVATE {Data Set Name} PRINTER Instrument setup LOCAL SETUP -> HARDWARE SETUP GENERAL DISPLAY SETTINGS PRINTER SETUP ACCESSORY SAVE CAL DATA... -
Page 98: Menus In The Receiver Mode (Option R&S Fsh-K3)
Menus in the Receiver Mode (Option R&S FSH-K3) R&S FSH Menus in the Receiver Mode (Option R&S FSH-K3) Main menu: TRANS LIMIT DISPLAY MEAS MEASURE DUCER LINES LINE ANALYZER RECEIVER TRACKING GEN POWER SENSOR CHANNEL POWER OCCUPIED BW TDMA POWER DISTANCE TO FAULT BAND MEAS... - Page 99 R&S FSH Menus in the Receiver Mode (Option R&S FSH-K3) SPAN key Frequency entry: FIXED FREQ SCAN SCAN SCAN SPAN FREQ SCAN START STOP STEP Frequency scan: FIXED FREQ SCAN SCAN SCAN SPAN FREQ SCAN START STOP STEP Channel entry: FIXED CHANNEL FREQ...
- Page 100 Menus in the Receiver Mode (Option R&S FSH-K3) R&S FSH Sweep key MEAS CONT SINGLE SWEEP TRIGGER TIME SCAN SCAN FREE RUN VIDEO... EXTERN EXTERN DELAY... Trace key Measurement at a fixed frequency: TRACE TRACE-> SHOW TRACE TRACE DETECTOR MODE MEMORY MEMORY STYLE...
-
Page 101: Instrument Functions
R&S FSH Instrument Default Setup 4 Instrument Functions Instrument Default Setup When you press the PRESET key, the R&S FSH is set to its default setup or presets. It is best to select the PRESET when you are going to perform a new measurement task. The new settings can then be made on the basis of the more familiar default setup without the old settings affecting the measurement. -
Page 102: Setting The Frequency
Setting the Frequency R&S FSH Setting the Frequency The R&S FSH's frequency is set with the FREQ key. The frequency can be specified in terms of the center frequency (center freq. = frequency at the center of the frequency axis in the measurement diagram) or the start and stop frequency for a particular span. -
Page 103: Entering The Center-Frequency Step Size
R&S FSH Setting the Frequency Press the FREQ key. Press the FREQ OFFSET softkey. The R&S FSH opens the frequency offset entry field. Enter the required frequency offset and terminate with the corresponding unit. The R&S FSH adds the frequency offset to the set center frequency. -
Page 104: Entering The Start And Stop Frequency
Setting the Frequency R&S FSH Entering the start and stop frequency Press the START FREQ softkey. The value entry box for the start frequency opens. The box displays the current frequency. Enter a new start frequency with the number keys and terminate the entry with one of the unit keys Adjust the start frequency with the rotary knob or the cursor keys and terminate the entry with the ENTER key. - Page 105 R&S FSH Setting the Frequency The R&S FSH opens the list of channel tables loaded via R&S FSH View. Select the desired channel table with the rotary knob or the cursor keys and switch it on with the SELECT softkey. The channel number together with the name of the selected channel table (e.g.
-
Page 106: Setting The Span
Setting the Span R&S FSH Setting the Span The span is the frequency range centered on the center frequency which a spectrum analyzer displays on the screen. What span should be selected for a particular measurement depends on the signal to be investigated. -
Page 107: Setting The Amplitude Parameters
R&S FSH Setting the Amplitude Parameters Setting the Amplitude Parameters All R&S FSH settings referred to the level display are made with the AMPT key. The reference level (REF) is the level represented by the uppermost grid line in the measurement diagram. -
Page 108: Setting The Reference Level
Setting the Amplitude Parameters R&S FSH scale with LIN 0-100 %. The level is expressed as a percentage (0 % to 100 %) of the reference level. This mode is useful if you want to display, for example, a carrier being amplitude modulated in the time domain (SPAN = 0 Hz). -
Page 109: Entering The Display Unit
R&S FSH Setting the Amplitude Parameters CHART menu option is available only if option R&S FSH-K2 has been installed and a reflection measurement has been vector-calibrated. If the R&S FSH-K2 option is installed, the ranges VSWR 1-1.5 and VSWR 1-1.1 are available in addition. Entering the display unit Press the AMPT key. -
Page 110: Entering The Input Impedance
Setting the Amplitude Parameters R&S FSH Entering the input impedance Press the AMPT key. Press the RF INPUT softkey. A submenu opens. The two input impedance options “50 ” and “75 ” are displayed. Select the input impedance you want using the rotary knob or the cursor keys and confirm your selection by pressing the ENTER key. -
Page 111: Setting The Bandwidths
R&S FSH Setting the Bandwidths Setting the Bandwidths A key feature of a spectrum analyzer is that it can display the frequency spectrum of a signal. The resolution bandwidth determines how well a spectrum analyzer can separate adjacent frequencies. Spectrum analyzers usually also have switchable video bandwidths. The video bandwidth is determined by the cutoff frequency of the lowpass used to filter the video voltage before it is displayed. - Page 112 Setting the Bandwidths R&S FSH Operating sequence: Press the BW key. Resolution bandwidth Resolution bandwidth The menu for setting the bandwidth opens. If the uncoupled display default setting is activated, the softkey label for automatically setting the bandwidth is highlighted in green.
-
Page 113: Video Bandwidth
R&S FSH Setting the Bandwidths Video bandwidth The video bandwidth smoothes the trace by reducing noise. When the filtered IF signal is envelope- detected, an IF sine signal becomes a DC voltage in the video signal. If the sine signal is amplitude- modulated, a signal whose frequency is the same as the AM frequency is produced in the video signal apart from the DC voltage from the carrier. - Page 114 Setting the Bandwidths R&S FSH Operating sequence: Press the BW key. The menu for setting bandwidths opens. When the default setting has been selected, the softkey label for setting the bandwidth automatically is highlighted in green. Press the MANUAL VIDEO BW softkey. The softkey label is highlighted in red and the video bandwidth value entry box (VBW) indicates the current bandwidth.
-
Page 115: Setting The Sweep
R&S FSH Setting the Sweep Setting the Sweep If the span is > 0, the sweep time is the time the spectrum analyzer takes to traverse the displayed span to measure the spectrum. Certain boundary conditions must be met if a spurious spectrum is not to be displayed. -
Page 116: Sweep Mode
Setting the Sweep R&S FSH Sweep mode When the default settings are activated, the R&S FSH is in the continuous sweep mode, i.e. when one sweep of the span has been completed, the sweep is automatically repeated from the start of the span. The trace is refreshed after each sweep. - Page 117 R&S FSH Setting the Sweep Operating sequence: Press the SWEEP key. Press the TRIGGER softkey. The submenu for setting the trigger opens. If the default setting is selected, FREE RUN is highlighted in red. If span = 0 Hz, any setting can be selected; otherwise the settings VIDEO...
- Page 118 Setting the Sweep R&S FSH The trigger delay resolution depends on the delay selected. The table below lists the values: Trigger delay (DELAY) Resolution 0 to 1 ms 10 Os 1 ms to 10 ms 100 Os 10 ms to 100 ms 1 ms 100 ms to 1 s 10 ms...
-
Page 119: Trace Settings
R&S FSH Trace Settings Trace Settings The R&S FSH provides one measurement trace and a reference trace in memory. Trace mode A variety of display modes can be selected for the trace: • CLEAR/WRITE The R&S FSH clears the old trace during a new sweep. This is the default setting. -
Page 120: Detector
Trace Settings R&S FSH If TRACE MODE AVERAGE is selected, the AVG COUNT entry field opens, which displays the set number of averagings. The following actions can be performed: Confirm the displayed number of averagings with the TRACE softkey or the ENTER key. Using the numeric keypad, enter a new figure between 2 and 999 for specifying the number of averagings and confirm your entry with the TRACE... - Page 121 R&S FSH Trace Settings pixel. The Sample detector should always be used for measurements with span = 0 Hz, as this is the only way of correctly representing the timing of the video signal. The Sample detector can also be used to measure noise power as noise usually has a uniform spectrum with a normal amplitude distribution.
-
Page 122: Trace Memory
Trace Settings R&S FSH Operating sequence: Press the TRACE key. Press the DETECTOR softkey. The submenu for selecting the detector opens. If automatic operation has been selected, the AUTO COUPLED menu item is highlighted in green and the R&S FSH displays the detector that is set to match the trace mode that is set. - Page 123 R&S FSH Trace Settings Note: The memory trace is bit-mapped into the picture memory. Therefore, when the memory trace is recalled, it will not be adapted to any modifications of the reference level or span that may have been made in the meantime. When a stored data set is called, the R&S FSH stores the associated trace in the trace memory.
-
Page 124: Using The Markers
Using the Markers R&S FSH Using the Markers The R&S FSH has a marker and a delta marker to make it easier to read off trace values. The markers cannot leave the trace and indicate the frequency and level of the point they are positioned on. The frequency indicated by a marker is shown by a vertical line which extends from the top to the bottom of the measurement diagram. -
Page 125: Automatic Marker Positioning
R&S FSH Using the Markers Controlling the delta marker: Press the MARKER key. Press the DELTA softkey. The R&S FSH turns on the delta marker and places it on the second largest signal on the trace. The frequency and level displayed at the top of the screen are relative to the main marker, i.e. - Page 126 Using the Markers R&S FSH Operating sequence: Press the MARKER key. Press the SET MARKER softkey. Using the cursor keys or the rotary knob, select the function you want. Confirm your selection with the ENTER key or the SET MARKER softkey. The R&S FSH then performs the action you have selected.
-
Page 127: Using More Than One Marker At A Time (Multimarker Mode)
R&S FSH Using the Markers Deactivating the marker search range: If a marker search range is activated, the LIMIT RANGE menu item in the SEARCH RANGE LIMITS menu is highlighted in green. Press the SET MARKER softkey to deactivate the marker search range. Using the rotary knob or the cursor keys, select SEARCH RANGE LIMITS. - Page 128 Using the Markers R&S FSH Press the MARKER or DELTA softkey. The R&S FSH opens a list for selecting the marker or delta marker to be edited. The markers that are already switched on are highlighted in green. The (delta) marker numbers already allocated to a (delta) marker are deactivated, i.e.
- Page 129 R&S FSH Using the Markers In addition, it is possible to position all activated markers (M1 to M6) at the peak of a trace. In the SET MARKER menu, select ALL MKR TO PEAK and confirm this with the ENTER key or the SET MARKER softkey.
-
Page 130: Marker Functions
Using the Markers R&S FSH Deactivating all markers or delta markers: Press the MARKER or DELTA softkey. Using the rotary knob or the cursor keys, select ALL MARKERS OFF or DELTA OFF. Press the ENTER key or the MARKER or DELTA softkey to deactivate all markers or delta markers. -
Page 131: Measuring The Frequency
R&S FSH Using the Markers when measurements are made on noise or digitally modulated signals. However, valid results are obtained only if the spectrum in the vicinity of the marker has a flat frequency response. The function gives incorrect results if measurements are made on discrete signals. Operating sequence: Press the MARKER key. -
Page 132: Af Demodulation
Using the Markers R&S FSH AF demodulation The R&S FSH has an AM and FM demodulator for audiomonitoring signals. The demodulated AF signal can be listened to with headphones (supplied accessories). The headphones are connected to the 3.5 mm jack on the left-hand side of the carrying handle. As the R&S FSH makes the uncontrolled video voltage audible in the case of AM demodulation, it is advisable to set the reference level so that the level of the signal to be demodulated is near the reference level. -
Page 133: Using The Display Line
R&S FSH Using the Display Line Using the Display Line In addition to the markers, the R&S FSH provides a horizontal line for determining the signal level in the display. Press the MEAS key. Press the DISPLAY LINE softkey. The R&S FSH displays a horizontal line across the entire diagram. -
Page 134: Setting And Using The Measurement Functions
Setting and Using the Measurement Functions R&S FSH Setting and Using the Measurement Functions If you want to perform complex measurements, the R&S FSH provides measurement functions which perform certain measurement tasks with a minimum of keystrokes or, in conjunction with various accessories, will allow you to perform advanced measurements. -
Page 135: Selecting The Standard
R&S FSH Measuring the channel power of continuously modulated signals The R&S FSH displays the softkey menu for setting the channel power measurement. Two vertical lines in the measurement diagram indicate the channel bandwidth. The measured channel power is shown in large letters below the measurement diagram. - Page 136 Measuring the channel power of continuously modulated signals R&S FSH • The RMS detector is recommended. This ensures that the true power is always obtained irrespective of the shape of the signal being investigated. • The sweep time must be set so that the result is stable. If the sweep time is increased, the R&S FSH also increases the integration time for the RMS detector and so ensures more stable measured values.
-
Page 137: Setting The Reference Level
R&S FSH Measuring the channel power of continuously modulated signals Using the R&S FSH View control software, additional standards can be generated and permanently loaded into the R&S FSH. You can also delete the factory-set standards provided in the instrument if you do not need them. -
Page 138: Changing The Span
Measuring the channel power of continuously modulated signals R&S FSH Press the CHAN BW softkey. The value entry box showing the current channel bandwidth setting opens. Using the number keys enter a new channel bandwidth and terminate the entry with the appropriate unit, or Using the rotary knob or the cursor keys, change the channel bandwidth and confirm with the... -
Page 139: Power Display
R&S FSH Measuring the channel power of continuously modulated signals To return to the menu for channel power measurement, press the MEAS key. Measurement of maximum channel power: If signal levels fluctuate significantly, you can define the maximum channel power by using the Max Hold function. - Page 140 Measuring the channel power of continuously modulated signals R&S FSH Unit for power display: The R&S FSH can use different units for power output. The basic unit is dBm. Press the PWR UNIT softkey. The R&S FSH opens the submenu with the units: dBm, dBmV and dBOV.
-
Page 141: Power Measurements On Tdma Signals
R&S FSH Power measurements on TDMA signals Power measurements on TDMA signals When TDMA (time division multiple access) methods are used, e.g. for GSM, several users share a channel. Each user is assigned a period of time or timeslot. The R&S FSH’s TDMA POWER function measures the power over one of these timeslots. - Page 142 Power measurements on TDMA signals R&S FSH Press the STANDARD softkey. Using the rotary knob or the cursor keys, select the USER menu item. Confirm your selection with the ENTER key or the STANDARD softkey. The USER STANDARD settings that have already been stored are set on the R&S FSH.
-
Page 143: Setting The Measurement Time
R&S FSH Power measurements on TDMA signals Setting the measurement time The measurement time (MEAS TIME) is the time over which the R&S FSH performs a power measurement. A value less than or equal to the sweep time can be selected. Press the MEAS TIME softkey. -
Page 144: Power Readout
Power measurements on TDMA signals R&S FSH Power readout The R&S FSH displays the measured power at the bottom of the measurement diagram (Power = nn.n dBm). Usually the trace is not obscured. However, if the trace is in this area of the screen, the power readout can be removed from the screen. -
Page 145: Measuring The Occupied Bandwidth
R&S FSH Measuring the occupied bandwidth Measuring the occupied bandwidth Ensuring the proper operation of a transmission network requires that all transmitters adhere to the bandwidths assigned to them. This is checked by measuring the occupied bandwidth, which is defined as the bandwidth in which a specified percent (99 %) of power is transmitted. -
Page 146: Selecting A Standard
Measuring the occupied bandwidth R&S FSH Selecting a standard The R&S FSH offers a default for measuring the occupied bandwidth for different standards. It is also possible to define and save user-specific configurations. Press the STANDARD softkey. A table with the available standards opens. Using the rotary knob or the cursor keys, select the appropriate standard. -
Page 147: Setting The Reference Level
R&S FSH Measuring the occupied bandwidth Renaming the USER standard: The setting for the USER standard can be assigned a user-defined name. The name entered as the USER standard also appears on the screen, thus making it possible to document the setting along with the measurement. -
Page 148: Setting The Channel Bandwidth
Measuring the occupied bandwidth R&S FSH Press the LEVEL ADJUST softkey. The R&S FSH starts the measurement of the optimal reference level using a resolution bandwidth of 1 MHz, a video bandwidth of 1 MHz and the peak detector. While the measurement is in progress, the R&S FSH outputs the message “Adjusting level for OBW measurement, please wait... -
Page 149: Changing The Span
R&S FSH Measuring the occupied bandwidth Changing the span The span set by the R&S FSH normally yields optimum measurement results. In some cases, however, a larger span needs to be selected. This is the case, for example, when the area outside the span that is automatically set contains signal components that need to be included in the measurement. -
Page 150: Measuring The Carrier-To-Noise Ratio
Measuring the Carrier-to-Noise Ratio R&S FSH Measuring the Carrier-to-Noise Ratio (Available as of firmware version 8.0 or higher.) The R&S FSH offers a carrier/noise measurement for measuring the ratio of carrier power to noise power. The R&S FSH performs the measurement in two steps. First, it measures the carrier power of a transmission channel, or you determine a reference power which is then used for C/N calculation. -
Page 151: Determining The Reference
R&S FSH Measuring the Carrier-to-Noise Ratio The major measurement parameter settings are available directly in the main menu of the carrier/noise measurement entered using corresponding function keys. Determining the reference Before the carrier-to-noise power ratio can be determined, the reference power or the reference level must be specified. -
Page 152: Analog Tv Mode
Measuring the Carrier-to-Noise Ratio R&S FSH ANALOG TV mode In the ANALOG TV operating mode, the maximum power in the reference channel is measured. It is then used as the carrier power (reference) for determining the carrier-to-noise ratio. To measure the peak power of the vision carrier, the settings for span, resolution bandwidth, video bandwidth and sweep time are optimally preset by the R&S FSH. -
Page 153: Manual Reference Mode
R&S FSH Measuring the Carrier-to-Noise Ratio resolution bandwidth. This prevents incorrect results due to the compression of signal peaks by the video filter. • The peak detector is recommended. It ensures that the peak power of the vision carrier is correctly measured. -
Page 154: Setting The Reference Channel Bandwidth
Measuring the Carrier-to-Noise Ratio R&S FSH Press the REF MEASURE softkey. Using the rotary knob or the cursor keys, select the desired entry and confirm your choice with the ENTER key or the F4 softkey. Using the numeric keypad, enter the channel or frequency of the desired reference channel. -
Page 155: Setting The Analyzer Reference Level For The Reference Channel Measurement
R&S FSH Measuring the Carrier-to-Noise Ratio Operating sequence: If the reference measurement is active, press the CHANNEL BW softkey. An entry box showing the current channel bandwidth setting opens. Enter the reference channel bandwidth using the numeric keys and terminate your entry with the appropriate unit key, or Set the channel bandwidth with the rotary knob or the cursor keys. -
Page 156: Units Of The C/N Reference
Measuring the Carrier-to-Noise Ratio R&S FSH Switch off the reference display. Press the REF MEASURE softkey. Using the rotary knob or the cursor keys, select DISPLAY OFF and confirm your choice with the ENTER key or the F4 softkey. Switch the reference display on again. Press the REF MEASURE softkey. -
Page 157: Setting The Noise Channel
R&S FSH Measuring the Carrier-to-Noise Ratio • The span is coupled to the channel bandwidth. When changes are made, the R&S FSH automatically sets the appropriate span. • The resolution bandwidth is coupled to the channel bandwidth. If it is set manually, it should be between 1% and 4% of the channel bandwidth. -
Page 158: Setting The Noise Channel Bandwidth
Measuring the Carrier-to-Noise Ratio R&S FSH Setting the noise channel bandwidth Enter the noise channel bandwidth with the CHANNEL BW softkey. Make the entry after the noise channel measurement has been activated. This is the case when the NOISE MEASURE softkey is highlighted in green. -
Page 159: Selecting The C/N Result Display
R&S FSH Measuring the Carrier-to-Noise Ratio Selecting the C/N result display The R&S FSH either displays the carrier/noise power ratio referenced to the total noise channel power C/N or referenced to the noise power density C/No. It calculates the noise power density from the set noise channel bandwidth. -
Page 160: Changing The Span
Measuring the Carrier-to-Noise Ratio R&S FSH Changing the span The span set by the R&S FSH yields extremely precise measurement results. However, signals in the environment of the measurement channel can now no longer be detected. To give you an overview of the spectrum outside the measurement channel, the span can be changed up to a factor of ten times the channel bandwidth during the channel power measurement. -
Page 161: Using The R&S Fsh In Receiver Mode
R&S FSH Using the R&S FSH in receiver mode Using the R&S FSH in receiver mode (only available if option R&S FSH-K3 is installed) The receiver mode (option R&S FSH-K3) is used for measuring levels on individual frequencies. In this mode, the R&S FSH functions as a receiver and measures the level on a prescribed frequency. -
Page 162: Setting The Frequency
Using the R&S FSH in receiver mode R&S FSH Setting the frequency The frequency is set either in the main menu of the receiver mode or by using the FREQ key. Frequency entry is active immediately after the receiver mode has been called. The receiving frequency can be changed with the rotary knob, the cursor keys or by entering a numeric value. - Page 163 R&S FSH Using the R&S FSH in receiver mode Frequency tuning in channel spacings: For measurement in channel spacings, it is possible to enter a frequency channel instead of the frequency. A simple channel table can be defined directly from the R&S FSH's front panel. Complicated channel tables, e.g.
-
Page 164: Setting The Reference Level
Using the R&S FSH in receiver mode R&S FSH To define a user table, proceed as follows: Press the FREQ key. Press the CHANNEL TABLE softkey. Press the SELECT USER TAB softkey. Press the DEFINE USER TAB softkey. The R&S FSH opens the submenu for entering the different parameters of the channel table. -
Page 165: Setting The Bandwidth
R&S FSH Using the R&S FSH in receiver mode Setting the reference level in the amplitude menu: Press the AMPT key. Press the REF LEVEL softkey. Change the reference level setting with the cursor keys or the rotary knob, or enter a new reference level via the numeric keypad. -
Page 166: Setting The Detector
Using the R&S FSH in receiver mode R&S FSH Setting the detector The following detectors are available in the receiver mode: Peak The peak detector displays the highest level during the set measurement time. Average The average detector displays the linear average of the measurement signal within the selected measurement time. -
Page 167: Measurement On Multiple Frequencies Or Channels (Scan)
R&S FSH Using the R&S FSH in receiver mode Measurement on multiple frequencies or channels (scan) In a scan, the R&S FSH sequentially measures the levels in predefined channels and graphically displays the measurement results. The length of time the scan dwells on a frequency is determined by the measurement time. - Page 168 Using the R&S FSH in receiver mode R&S FSH Press the FREQ key. Press the CHANNEL MODE softkey. Press the SPAN key. Press the CHANNEL SCAN key. The R&S FSH now scans across the channels of the active channel table. The frequency range for the scan is set using the START SCAN and STOP SCAN softkeys.
-
Page 169: Measurements Using The Power Sensor
R&S FSH Measurements using the power sensor Measurements using the power sensor For even more accurate power measurements, the R&S FSH can be used with the Power Sensors R&S FSH-Z1 and R&S FSH-Z18. Their frequency ranges are 10 MHz to 8 GHz and 10 MHz to 18 GHz, respectively. - Page 170 Measurements using the power sensor R&S FSH Operating sequence: Press the MEAS key. Press the MEASURE softkey. The measurement function submenu opens. Using the cursor keys or the rotary knob, select the POWER SENSOR menu item and confirm your selection with the ENTER key or the MEASURE softkey.
-
Page 171: Zeroing The Power Sensor
R&S FSH Measurements using the power sensor Screen layout for power-sensor measurements: Power offset Measurement time Power sensor type in use Reference for relative power measurement Readout of measured power 0 dBm marker for sensor input level Analog readout of measured power Measurement frequency... -
Page 172: Selecting The Unit For The Power Readout
Measurements using the power sensor R&S FSH Press the ZERO softkey. The R&S FSH outputs a message to tell the user not to apply any signals to the power sensor when zeroing is being performed. Disconnect the power sensor from any signal sources. -
Page 173: Setting The Averaging Time
R&S FSH Measurements using the power sensor Press the ->REF softkey. The R&S FSH sets the current measured level as the reference level and from then on displays the measured level relative to the reference level in dB. The unit (UNIT) is automatically set to dB REL..The reference level is shown in the top left-hand corner of the screen (in this case Ref: -10.4 dBm). - Page 174 Measurements using the power sensor R&S FSH Press the AMPT key. Press the REF OFFSET softkey. The value entry box for the reference offset opens. Using the rotary knob, the cursor keys or the number keys enter the offset you want and confirm the entry with the ENTER key.
-
Page 175: Measuring Forward And Reflected Power
R&S FSH Measuring forward and reflected power Measuring forward and reflected power The Directional Power Sensors R&S FSH-Z14 and R&S FSH-Z44 are connected between the source and the load and measure the power flow in both directions, i.e. from the source to the load (forward power) and from the load to the source (reflected power). - Page 176 Measuring forward and reflected power R&S FSH Operating sequence: Press the MEAS key. Press the MEASURE softkey. The measurement functions submenu opens. Using the cursor keys or the rotary knob, select the POWER SENSOR menu item and confirm with the ENTER key or the MEASURE softkey.
-
Page 177: Zeroing The Power Sensor
R&S FSH Measuring forward and reflected power Screen layout for measurements with Directional Power Sensors R&S FSH-Z14/-Z44: Selected transmission Power offset standard Display of the power Reference display sensor type for relative power measurement Readout of matching Readout of forward value (VSWR or return power (dBm, W or loss) -
Page 178: Setting The Power Measurement Weighting
Measuring forward and reflected power R&S FSH Press the ZERO softkey. The R&S FSH outputs a message to inform the user that no signal should be present at the power sensor input while zeroing is being performed. Disconnect the power sensor from any signal sources. -
Page 179: Selecting The Unit For The Power Readout
R&S FSH Measuring forward and reflected power Selecting the unit for the power readout The R&S FSH displays the measured forward power as a logarithmic level value in dBm (relative value) or as a linear value in W or mW (absolute value). Moreover, a reference level can be defined relative to which the R&S FSH indicates the level difference in dB. -
Page 180: Taking Additional Attenuation Into Account
Measuring forward and reflected power R&S FSH Press the ->REF softkey. The R&S FSH accepts the currently measured level as the reference level and displays the measured level difference relative to the reference level in dB. The unit (UNIT) is automatically set to dB REL..The reference level is displayed in the upper left corner of the screen (in this case: Ref: -4.8 dBm). - Page 181 R&S FSH Measuring forward and reflected power Press the AMPT key. Press the REF OFFSET softkey. The value entry box for the reference offset opens. Enter the desired offset using the rotary knob, the cursor keys or the number keys and confirm the entry with the ENTER key.
-
Page 182: Two-Port Measurements With The Tracking Generator
Two-port measurements with the tracking generator R&S FSH Two-port measurements with the tracking generator (Only for R&S FSH with tracking generator: R&S FSH3 order No. 1145.5850.13 and 1145.5850.23, R&S FSH6 order No. 1145.5850.26) The R&S FSH can be supplied with an optional tracking generator to measure the transmission of two- ports or the reflection coefficients of one-ports and two-ports. - Page 183 R&S FSH Two-port measurements with the tracking generator 0 dB reference Tracking generator mode Softkey labeling for tracking generator Softkeys for Softkey for switching Only models Ser. No. transmission & between scalar/vector 100500 or later reflection calibration meas., opt. R&S FSH-K2 When the tracking generator is switched on, the R&S FSH displays Track Gen Uncal.
-
Page 184: Measuring The Transmission Of Two-Ports
Two-port measurements with the tracking generator R&S FSH Setting the tracking generator step attenuator: (Only model 1145.5850.26 with serial number 100500 or later) To measure active DUTs with high gain, you can reduce the output level of the tracking generator by up to 20 dB in 1 dB steps by using the adjustable step attenuator. - Page 185 R&S FSH Two-port measurements with the tracking generator Scalar transmission measurement: Press the MEAS key. Press the TRANSM CAL softkey. The R&S FSH now prompts you to connect its RF input to the tracking generator output so that calibration can be carried out. Connect the RF input of the R&S RSH3 directly to the tracking generator output without the DUT.
- Page 186 Two-port measurements with the tracking generator R&S FSH Connect the DUT between the RF input and the generator's output. The R&S FSH displays the transmission magnitude. Values can be read off with, for example, the markers. The transmission calibration remains valid until the center frequency or the span is changed on the R&S FSH.
-
Page 187: Vector Transmission Measurement
R&S FSH Two-port measurements with the tracking generator Press the AMPT key. Press the REF POSITION softkey. Change the reference position using the rotary knob or the cursor keys, or enter a new reference position via the numeric keypad. Confirm the entry with the ENTER key or the REF POSITION softkey. - Page 188 Two-port measurements with the tracking generator R&S FSH Calibrating the measurement: Before the R&S FSH is calibrated, the desired center frequency and span must be set. If they are set later, the calibration values are lost and the measurement must be recalibrated. Press the MEAS key.
-
Page 189: Transmission Measurement Using The Connected Vswr Bridge R&S Fsh-Z3
R&S FSH Two-port measurements with the tracking generator Connect the DUT between the tracking generator output and the RF input. The R&S FSH displays the magnitude of the transmission of the DUT. Transmission measurement using the connected VSWR Bridge R&S FSH-Z3 Some measurement tasks require that both the transmission and the reflection be determined. -
Page 190: Spectrum Measurements With The Vswr Bridge R&S Fsh-Z3 Or R&S Fsh-Z2 Connected
Two-port measurements with the tracking generator R&S FSH As soon as the control cable has been connected to the R&S FSH, the VSWR Bridge R&S FSH-Z3 is automatically detected and indicated both on the display and the status menu. Automatic detection requires that this feature be activated in the SETUP menu (default setting). -
Page 191: Supplying Dc Voltage To Active Duts
R&S FSH Two-port measurements with the tracking generator Settings for detection of the R&S FSH-Z3 in transmission and spectrum measurements Operation: Press the SETUP key. Select the HARDWARE SETUP softkey. Select ACCESSORY from the menu by using the rotary knob or the cursor keys and confirm the entry with the ENTER key. -
Page 192: Scalar Measurement Of Reflection
Two-port measurements with the tracking generator R&S FSH VSWR Bridge Power Divider Test port R&S FSH-Z2 Control cable R&S FSH with the VSWR Bridge R&S FSH-Z3 R&S FSH with the VSWR Bridge R&S FSH-Z2 Scalar measurement of reflection The test setup must be calibrated before any measurements are made. This is done with a short and an open at the point were the reflection measurement is to be made. - Page 193 R&S FSH Two-port measurements with the tracking generator During calibration, the R&S FSH outputs the message "Calibrating SHORT, please wait...". Calibration can be aborted with the CANCEL softkey. When calibration is over, the R&S FSH outputs the message "Reflect. calibrated" for 3 seconds. Reflection is displayed in the top right-hand corner of the measurement diagram to indicate that the R&S FSH is calibrated for reflection measurements.
-
Page 194: Vector Measurement Of Reflection
Two-port measurements with the tracking generator R&S FSH Confirm the selection by pressing the ENTER key or the RANGE softkey. The R&S FSH displays the reflection coefficient of the DUT. Reflection calibration remains valid until the R&S FSH’s center frequency or span is changed. If calibration becomes invalid, the R&S FSH displays Track Gen Uncal in the top right-hand corner of the screen. - Page 195 R&S FSH Two-port measurements with the tracking generator calibration with open circuit and short circuit, calibration with a 50 termination is necessary. Thus, the characteristics of the VSWR bridge (directivity and impedances) no longer affect the measurement result. Rather, the decisive factor is the quality of the calibration parameters open circuit, short circuit and 50 termination.
-
Page 196: Display Of Reflection In Vector Measurement
Two-port measurements with the tracking generator R&S FSH In the third step of calibration, terminate the measurement port into a 50 termination. Terminate the measurement input of the bridge or the end of the measurement cable into a termination. Start termination calibration by pressing the first or second softkey (CONTINUE). - Page 197 R&S FSH Two-port measurements with the tracking generator Press the AMPT key. Press the RANGE softkey. Using the cursor keys or rotary knob, select SMITH CHART from the menu. Confirm your selection with the ENTER key or by pressing the RANGE softkey again. The R&S FSH displays the reflection of the DUT in the Smith chart.
- Page 198 Two-port measurements with the tracking generator R&S FSH and whose radius is determined by the VSWR value. All values within the circle have a VSWR value that is smaller than the VSWR value defined by the circle. To activate the VSWR limit value: If starting from the main menu for the tracking generator, press the MEAS key.
- Page 199 R&S FSH Two-port measurements with the tracking generator Zooming in on parts of the Smith chart: To gain a better look at the measurement results, you can use the zoom function to enlarge any part of the Smith chart. To activate the zoom function: Press the TRACE key.
-
Page 200: Spectrum Measurements With The Vswr Bridge R&S Fsh-Z3 Or R&S Fsh-Z2 Connected
Two-port measurements with the tracking generator R&S FSH To shift in the y direction: Press the MOVE Y softkey. Set a value from -50% to +50% by using the rotary knob or cursor keys or by entering a numeric value. Confirm the selection with the ENTER key or the MOVE Y softkey. -
Page 201: Settings For Detection Of The R&S Fsh-Z2 And R&S Fsh-Z3
R&S FSH Two-port measurements with the tracking generator Settings for detection of the R&S FSH-Z2 and R&S FSH-Z3 Operation: Press the SETUP key. Select the HARDWARE SETUP softkey. Select ACCESSORY from the menu by using the rotary knob or the cursor keys and confirm the entry with the ENTER key. -
Page 202: One-Port Measurement Of Cable Loss
One-Port Measurement of Cable Loss R&S FSH One-Port Measurement of Cable Loss (Available only if the option R&S FSH-K2 is installed.) When measuring return loss at the end of short-circuited or open-circuit cables, cable loss can be calculated on the basis of the following aspect: A short circuit or an open circuit at the end of the cable completely reflects the traversing wave. -
Page 203: Cable Measurements
R&S FSH Cable Measurements Cable Measurements (Only for R&S FSH with tracking generator (R&S FSH3 order No. 1145.5850.13 or 1145.5850.23, R&S FSH6 order No. 1145.5850.26) and with option R&S FSH-B1 (Distance-To-Fault Measurements) installed). Measurements to determine the characteristics of cables to the antenna are key tasks when transmission equipment is being installed or maintained. -
Page 204: Cable Selection
Cable Measurements R&S FSH Calling the function: Press the MEAS key. Press the MEASURE softkey. The measurement function submenu opens. Using the cursor keys or the rotary knob, select the DISTANCE TO FAULT menu item and confirm your selection with the ENTER key or the MEAS softkey. - Page 205 R&S FSH Cable Measurements Selecting a cable model from a predefined list: Press the CABLE MODEL softkey. The R&S FSH displays the list of cable models. Using the rotary knob or the cursor keys, select the appropriate cable model. Using the softkey, activate the cable model you have selected.
- Page 206 Cable Measurements R&S FSH Press the DEFINE USER MOD softkey. Select ATTENUATION... and confirm with the ENTER key. The current cable attenuation is displayed in the value entry box in dB/m or dB/ft, depending on the unit of length selected in the setup menu. Confirm the current cable attenuation with the ENTER key or enter a new cable attenuation and confirm with the ENTER key or the DEFINE USER...
-
Page 207: Selecting The Frequency Range
R&S FSH Cable Measurements If the cable attenuation exceeds 10 dB, the R&S FSH outputs a warning indicating that the cable attenuation high. also indicates maximum recommended cable length for obtaining accurate results. Pressing CONTINUE accepts the entry. Selecting the frequency range In the default setting, the R&S FSH automatically selects the frequency range around the set center frequency on the basis of the cable length and cable model. -
Page 208: Calibrating The Test Setup
Cable Measurements R&S FSH Press the FREQ key. Using either the numeric keys, the cursor keys or the rotary knob, set the desired frequency. Confirm the entry with the ENTER key or the CENTER FREQ softkey. Calibrating the test setup The test setup must be calibrated before any measurements are performed. - Page 209 R&S FSH Cable Measurements When calibration is over, the R&S FSH displays DTF CAL in the top right-hand corner of the screen. The REFLECT CAL softkey label is highlighted in green to indicate that calibration has been successfully completed. The trace displays cable reflections versus distance from the measurement plane.
- Page 210 Cable Measurements R&S FSH To select the display unit: Press the AMPT key. Press the RANGE softkey. The R&S FSH will open the menu for selecting the display ranges. The following display units are available for distance-to-fault measurements: return loss in dB, linear in %, standing wave ration (VSWR), reflection coefficient (REFL COEFF (ROH)) and reflection coefficient (REFL COEFF (mROH)).
-
Page 211: Locating Cable Faults By Means Of The Marker Function
R&S FSH Cable Measurements Press the ENTER key or the LIST VIEW softkey again. The R&S FSH displays a table listing all the reflections that are above the threshold sorted according to distance from the measurement plane. To change the threshold for the table display, press the THRESHOLD softkey and enter the new value. - Page 212 Cable Measurements R&S FSH The reference plane to which the distance of a reflection is referred can be redefined using the marker offset. To define a new reference plane for the marker, press the MARKER OFFSET softkey. The R&S FSH turns on the distance marker (OFFSET) and places it on the start of the trace.
- Page 213 R&S FSH Cable Measurements Set the marker on the cable fault to be examined. Press the MARKER MODE softkey. Using the rotary knob or the cursor keys, select the ZOOM ON menu item. Confirm with the ENTER key. The R&S FSH zooms the display of the cable fault by the factor 2.
-
Page 214: Measuring Spectrum And Reflection
Cable Measurements R&S FSH The following options are possible: Select the highlighted marker as the active marker by pressing the ENTER key. Select another marker by means of the rotary knob or the cursor keys and confirm your selection with the ENTER key. -
Page 215: Further Information
R&S FSH Cable Measurements When SPECTRUM is selected, the R&S FSH turns off the tracking generator and displays the spectrum over the frequency range of the DTF measurement. To indicate that the R&S FSH is in the spectrum mode, DTF Spectrum is displayed in the top right-hand corner of the screen. -
Page 216: Selecting The Center Frequency
Cable Measurements R&S FSH only as many points as permitted by the span that has been set. Thus, the length resolution decreases and the span is reduced. The following two screenshots show the measurements of the faults of a 22 m cable at a set cable length of 25 meters, measured once with automatic setting of the span and once with the span reduced to 400 MHz. -
Page 217: Measurement
R&S FSH Cable Measurements Measurement The R&S FSH performs a sweep over 1024 test points to measure the sum signal of forward and reflected waveform. It transforms the sum signal in the frequency domain into the time domain by means of the inverse FFT (IFFT). The IFFT has a length of 2048 points. The data set is zero-padded to 2048 points and evaluated by means of a Hamming window before performing the IFFT. -
Page 218: Using Limit Lines
Using Limit Lines R&S FSH Using Limit Lines Limit lines are used to set limits for level characteristics versus time or versus frequency on the screen; they must not be exceeded. For instance, the upper limits of permissible spurious or harmonics of a DUT are marked by limit lines. - Page 219 R&S FSH Using Limit Lines Depending on the application, press the UPPER LIMIT or LOWER LIMIT softkey. The R&S FSH displays a list of available limit lines. If no limit line is switched on, the first value in the list is marked.
-
Page 220: Measurements With Limit Lines
Using Limit Lines R&S FSH After a limit line has been switched on, the R&S FSH returns to the menu and the selected line is displayed in the diagram. The name and type of the limit line are also marked (UPPER for an upper limit line and LOWER for a lower line). -
Page 221: Definition Range Of Limit Lines
R&S FSH Using Limit Lines Definition range of limit lines If a limit line is not defined in the entire frequency range or displayed span, a check is not performed outside the definition range. Data sets containing limit lines The R&S FSH stores data sets together with any limit lines that may have been active for the measurement in question. -
Page 222: Measuring With Transducer Factors
Measuring with Transducer Factors R&S FSH Measuring with Transducer Factors The frequency-dependent transducer factor of transducers and antennas can be directly considered in the measurement result. A transducer factor consists of a numeric values and a unit. The R&S FSH corrects the level values of the trace by the values of the transducer. - Page 223 R&S FSH Measuring with Transducer Factors Operating sequence: Press the MEAS key. Press the TRANSDUCER softkey. The softkey menu for operation of transducer factors is displayed on the screen. N.B : Transducer factors are not available for measurements with the tracking generator and the Power Sensor R&S FSH-Z1.
-
Page 224: Unit For Measurements With Transducers
Measuring with Transducer Factors R&S FSH If a transducer is switched on, TRD is displayed in the top right-hand corner of the diagram on the R&S FSH. The complete name of the selected transducer is displayed in the status line (press the STATUS key and scroll downward in the list), or in the list of transducer factors (entry highlighted in red). -
Page 225: Frequency Range Of Transducer
R&S FSH Measuring with Transducer Factors Frequency range of transducer If the set frequency range is wider than the span in which a transducer is defined, the R&S FSH assumes the transducer values outside the defined range to be zero. Data sets containing transducer factors The R&S FSH stores data sets together with any transducer factors that may have been active for the measurement in question. -
Page 226: Field-Strength Measurement With Isotropic Antenna
Field-Strength Measurement with Isotropic Antenna R&S FSH Field-Strength Measurement with Isotropic Antenna When used together with the R&S TS-EMF isotropic antenna (Order No. 1158.9295.13), the R&S FSH3 can determine the resultant field strength in the frequency range from 30 MHz to 3 GHz. The antenna has three orthogonal elements for measuring the resultant field strength. - Page 227 R&S FSH Field-Strength Measurement with Isotropic Antenna To use transducer factors for the isotropic antenna: Press the MEAS key. The R&S FSH will display the softkey menu for controlling the transducer factors. Note: The TRANSD softkey enables you to activate the three transducer factors for the X, Y, and Z axes individually.
- Page 228 Field-Strength Measurement with Isotropic Antenna R&S FSH Do the following to compensate the antenna extension cable: Select the TRANSD dB softkey from the Transducer menu. The R&S FSH will display the list of transducer factors available in the instrument with the unit dB. Select the appropriate transducer factor for the antenna by using the rotary knob or cursor keys and activate with the SELECT softkey.
- Page 229 R&S FSH Field-Strength Measurement with Isotropic Antenna bandwidth. By applying the narrow resolution bandwidth, it simulates a steep channel filter to prevent emissions from outside the channel from affecting the measurement result. The R&S FSH offers default settings for the 3 GPP WCDMA, cdmaOne and CDMA2000 1x transmission systems that free you from having to enter analyzer settings.
- Page 230 Field-Strength Measurement with Isotropic Antenna R&S FSH Selecting the standard: The R&S FSH offers a default channel power measurement setting for various standards. In addition, you can define and store your own configuration. Press the STANDARD softkey. The R&S FSH will open the table with available standards.
- Page 231 R&S FSH Field-Strength Measurement with Isotropic Antenna Renaming the USER standards: You can assign a user-defined name for the USER standard. This makes the standard being used by the R&S FSH immediately clear. The name entered for the USER standard will also appear on the screen, enabling you to document the setting when you document the measurement, for example.
- Page 232 Field-Strength Measurement with Isotropic Antenna R&S FSH Setting the reference level: When selecting the reference level, be sure not to overload the R&S FSH. Since the power is measured using a resolution bandwidth that is smaller than the signal bandwidth, the R&S FSH can be overloaded even though the trace is within the measurement diagram.
- Page 233 R&S FSH Field-Strength Measurement with Isotropic Antenna Changing the frequency span: The frequency span set by the R&S FSH yields the most accurate measurement results. However, signals near the measurement channel will no longer be detected. To provide an overview of the spectrum outside the measurement channel, the frequency span can be changed up to a value ten times the channel bandwidth during the channel power measurement.
- Page 234 Field-Strength Measurement with Isotropic Antenna R&S FSH Displaying the resultant field strength: The R&S FSH displays the resultant field strength at the bottom of the measurement diagram (Level = nn.nn dBµV/m). It usually does not overlap the trace. However, if this occurs, you can hide the display. Operation: To deactivate the power display: Press the POWER DISPLAY softkey.
-
Page 235: Saving And Loading Instrument Settings And Measurement Results
R&S FSH Saving and Loading Instrument Settings and Measurement Results Saving and Loading Instrument Settings and Measurement Results The R&S FSH’s settings and measurement results can be saved to the internal memory and recalled at a later date. Using the R&S FSH View software package, these data sets can also be saved to a PC from the R&S FSH or downloaded onto the R&S FSH from a PC. -
Page 236: Saving Results
Saving and Loading Instrument Settings and Measurement Results R&S FSH Press the SAVE / PRINT key. The R&S FSH opens the SAVE / PRINT menu where the functions for saving, clearing and loading data sets are displayed for selection. A screenshot can also be output to a printer. Saving results Press the SAVE softkey. -
Page 237: Entering A Data Set Name
R&S FSH Saving and Loading Instrument Settings and Measurement Results Entering a data set name A new name can be entered with the numeric keypad. The letter assignment for the keypad is the same as that for a mobile phone Alphanumeric keypad BACK key... -
Page 238: Deleting Saved Data Sets
Saving and Loading Instrument Settings and Measurement Results R&S FSH Using the rotary knob or the cursor keys select a data set. Load the data set by pressing the RECALL softkey. The R&S FSH displays the contents of the selected data set as a graph on the screen but the settings are not activated on the R&S FSH. -
Page 239: Deleting All Data Sets
R&S FSH Saving and Loading Instrument Settings and Measurement Results Deleting all data sets Starting from the DATASET LIST mode, all the data sets in the R&S FSH’s memory can be completely deleted by pressing the DELETE ALL DATASETS softkey. Press the DELETE ALL DATASETS softkey. -
Page 240: Printing Out Measurement Results
Printing out Measurement Results R&S FSH Printing out Measurement Results An R&S FSH screenshot can be printed out on a printer. The printer type and the baud rate for the serial connection can be selected in the setup menu using the GENERAL / PRINTER... softkey. Press the SAVE / PRINT key. -
Page 241: Measurements
R&S FSH Measurements Measurements How a spectrum analyzer operates Basically, an RF signal can either be analyzed in the time domain or in the frequency domain. In the time domain, how the signal varies with time can be observed on an oscilloscope, for example. In the frequency domain, a spectrum analyzer can be used to display the frequency components of a signal. - Page 242 Measurements R&S FSH The block diagram below shows how a spectrum analyzer works. Envelope Video Input precis. Detector IF filter detector filter attenuator Mixer RF input Y deflection Screen Local oscillator X deflection Sawtooth generator (for sweep) The precision attenuator at the input of the spectrum analyzer adjusts the level of the measurement signal to the level range that the mixer can handle without overdriving it.
- Page 243 R&S FSH Measurements Input frequency range Input Intermediate Image 0 Hz Local Frequency frequency frequency frequency oscillator image The first local oscillator is tuned with a sawtooth which simultaneously acts as the x deflection voltage for the display. In practice, synthesizer technology is used to generate the frequency of the first local oscillator and for a digital display.
- Page 244 Measurements R&S FSH The video filter comes after the envelope detector. The filter is a lowpass with an adjustable cutoff frequency which limits the bandwidth of the video signal. It is particularly useful when sine signals are to be measured in the vicinity of the spectrum analyzer’s intrinsic noise. The sine signal produces a video signal that is a DC voltage.
- Page 245 R&S FSH Measurements The Fig. above shows 30 measured values which are represented by a single pixel. The peak detector determines and displays the maximum measured value. The Auto Peak detector takes the maximum and minimum and displays them together. The two values are joined by a vertical line segment. This gives a good indication of the level variation over the measured values represented by a single pixel.
Need help?
Do you have a question about the R&S FSH Series and is the answer not in the manual?
Questions and answers