Tektronix RSA3308A Manuals
Manuals and User Guides for Tektronix RSA3308A. We have 5 Tektronix RSA3308A manuals available for free PDF download: User Manual, Service Manual, Instructions Manual
Tektronix RSA3308A User Manual (448 pages)
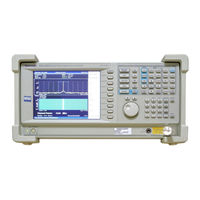
3 GHz & 8 GHz Real-Time Spectrum Analyzers
Brand: Tektronix
|
Category: Measuring Instruments
|
Size: 6 MB
Table of Contents
Advertisement

Tektronix RSA3308A User Manual (383 pages)
3 GHz & 8 GHz Real-Time Spectrum Analyzers
Brand: Tektronix
|
Category: Measuring Instruments
|
Size: 6 MB
Table of Contents

Tektronix RSA3308A Service Manual (284 pages)
3 GHz & 8 GHz Real-Time Spectrum Analyzers
Brand: Tektronix
|
Category: Measuring Instruments
|
Size: 4 MB
Table of Contents
Advertisement

Tektronix RSA3308A Service Manual (264 pages)
3 GHz & 8 GHz Real-Time Spectrum Analyzers
Brand: Tektronix
|
Category: Measuring Instruments
|
Size: 4 MB
Table of Contents

Tektronix RSA3308A Instructions Manual (18 pages)
IQ Input Function
Portable Wireless Communication Analyzer
Real-Time Spectrum Analyzers
Brand: Tektronix
|
Category: Measuring Instruments
|
Size: 0 MB