Tektronix RSA3303A User Manual
3 ghz & 8 ghz real-time spectrum analyzers
Hide thumbs
Also See for RSA3303A:
- User manual (383 pages) ,
- Service manual (264 pages) ,
- Instructions manual (18 pages)

Related Manuals for Tektronix RSA3303A


Summary of Contents for Tektronix RSA3303A
- Page 1 User Manual RSA3303A & RSA3308A 3 GHz & 8 GHz Real-Time Spectrum Analyzers 071-1409-05 This document applies to firmware version 3.30 and above. www.tektronix.com...
- Page 2 Copyright © Tektronix. All rights reserved. Licensed software products are owned by Tektronix or its subsidiaries or suppliers, and are protected by national copyright laws and international treaty provisions. Tektronix products are covered by U.S. and foreign patents, issued and pending. Information in this publication supercedes that in all previously published material.
- Page 3 End User License Agreement for Microsoft Software You have acquired a device (“DEVICE”) that includes software licensed by Tektronix Japan, Ltd. (“TJ”) from Microsoft Licensing Inc. or its affiliates (“MS”). Those installed software products of MS origin, as well as associated media, printed materials, and “online”...
- Page 4 LIMITATIONS ON REVERSE ENGINEERING, DECOMPILATION, AND DISASSEMBLY. You may not reverse engineer, decompile, or disassemble the SOFTWARE, except and only to the extent that such activity is expressly permitted by applicable law notwithstanding this limitation. SOFTWARE TRANSFER ALLOWED BUT WITH RESTRICTIONS. You may permanently transfer rights under this EULA only as part of a permanent sale or transfer of the Device, and only if the recipient agrees to this EULA.
- Page 5 Tektronix, with shipping charges prepaid. Tektronix shall pay for the return of the product to Customer if the shipment is to a location within the country in which the Tektronix service center is located.
- Page 7 Service Options Tektronix provides service to cover repair under warranty as well as other services that are designed to meet your specific service needs. Advancing technology has brought incredible change to the power of measurement instruments. Manufac- turing methods and calibration techniques have been revolutionized, making the service challenge tougher than ever. By using Tektronix as your service provider you make use of our technology and product knowledge, our world-wide logistics infrastructure, and our ISO9000 approved service centers.
-
Page 9: Table Of Contents
........... . . 1- - 2 Difference Between RSA3303A and RSA3308A ..... . . - Page 10 ..........3- - 169 Synchronous Operation with External Instruments ..... . 3- - 170 RSA3303A & RSA3308A User Manual...
- Page 11 ..........3- - 257 RSA3303A & RSA3308A User Manual...
- Page 12 ..........E- - 3 Glossary Index RSA3303A & RSA3308A User Manual...
- Page 13 ........2- -14 Figure 2- -12: Example menu item display ..... . 2- -16 RSA3303A & RSA3308A User Manual...
- Page 14 ........2- -56 RSA3303A & RSA3308A User Manual...
- Page 15 Figure 3- -30: Specifying the analysis range using the mouse ..3- -32 Figure 3- -31: FFT processing range setting on the overview ..3- -33 RSA3303A & RSA3308A User Manual...
- Page 16 Figure 3- -68: CCDF multi-view ......3- -90 viii RSA3303A & RSA3308A User Manual...
- Page 17 3- -151 Figure 3- -106: Trigger menu structure ......3- -153 RSA3303A & RSA3308A User Manual...
- Page 18 ....3- -201 Figure 3- -141: EVM, magnitude and phase error displays ..3- -202 Figure 3- -142: Constellation view and error vectors in 1/4π QPSK 3- -203 RSA3303A & RSA3308A User Manual...
- Page 19 Figure 3- -181: Print menu structure ......3- -261 RSA3303A & RSA3308A User Manual...
-
Page 20: Figure 2- -11: Menu Keys
........C- -1 Figure C- -2: Symbol mapping: 256QAM ..... . . C- -2 RSA3303A & RSA3308A User Manual... - Page 21 ....3- -188 Table 3- -28: Front panel keys for online help ....3- -233 xiii RSA3303A & RSA3308A User Manual...
- Page 22 Table E- -3: Optional accessories ......E- -3 RSA3303A & RSA3308A User Manual...
-
Page 23: General Safety Summary
Symbols and Terms Terms in this Manual. These terms may appear in this manual: WARNING. Warning statements identify conditions or practices that could result in injury or loss of life. RSA3303A & RSA3308A User Manual... - Page 24 WARNING indicates an injury hazard not immediately accessible as you read the marking. CAUTION indicates a hazard to property including the product. Symbols on the Product. The following symbols may appear on the product: Protective Ground CAUTION (Earth) Terminal Refer to Manual RSA3303A & RSA3308A User Manual...
-
Page 25: Preface
Preface This is the user manual for the RSA3303A and RSA3308A Real-Time Spectrum Analyzers. It covers the following information: H Describes the capabilities of the analyzer and how to install it H Explains how to operate the analyzer: how to control acquisition of,... -
Page 26: Conventions
Preface H RSA3303A and RSA3308A Programmer Manual (standard accessory) contains an alphabetical listing of the programming commands and other information related to controlling the analyzer over the GPIB interface. H RSA3303A and RSA3308A Service Manual (optional accessory) describes how to verify the characteristics of, adjust, disassemble, assemble, and troubleshoot the analyzer, and contains the information required for repair, including module replacement, and calibration. -
Page 27: Getting Started
Getting Started... -
Page 29: Product Overview
Product Overview The RSA3303A and RSA3308A are portable real-time spectrum analyzers with RF measurement capability up to 3 GHz (RSA3303A) and 8 GHz (RSA3308A). The real-time spectrum analyzer has a vastly different architecture from traditional tools, and is uniquely capable of capturing continuous, intermittent, or random signals with equal ease. -
Page 30: Application
H General purpose digital modulation vector signal analysis (Option) H Spectrum monitoring H Radar measurements Difference Between RSA3303A and RSA3308A The RSA3303A and the RSA3308A have the same functions except for their measurement frequency ranges: RSA3303A .. -
Page 31: Real-Time Analysis
NOTE. An intermittent signal, such as a burst phenomenon, will not be detected unless it is present at the exact moment that the filter is being swept past it. Sweep start stop Figure 1- 2: Sweep of resolution filter 1- 3 RSA3303A & RSA3308A User Manual... -
Page 32: Figure 1- 3: Concept Of The Real-Time Spectrum Analyzer
2 RF input Display Resolution Detector 3 filter 3 Resolution Detector N filter N Figure 1- 3: Concept of the real-time spectrum analyzer Concurrent acquisition start stop Figure 1- 4: Concurrent acquisition 1- 4 RSA3303A & RSA3308A User Manual... -
Page 33: Figure 1- 5: Frame Acquisition
The RSA3303A and the RSA3308A are equipped with a 51.2 MHz A/D converter to analyze the spectrum by single scanning for spans up to 15 MHz. -
Page 34: Architecture
(optional) Data memory Memory controller 64 MB (standard) 256 MB (optional) Local bus PCI bridge Windows Front panel key Display board PC Mass Storage Devices External interface GPIB Figure 1- 6: Block diagram 1- 6 RSA3303A & RSA3308A User Manual... - Page 35 Converts the RF signal, input through the front-panel INPUT connector, into a Down Converter 20 MHz IF signal. This converter processes signals up to 3 GHz for RSA3303A and 8 GHz for RSA3308A by IF conversions in three stages. A 10 MHz oscillator provides a high-accuracy reference for all stages of IF conversion.
- Page 36 8.4 inch XGA TFT-LCD module. The standard analyzer has the following external interfaces: H USB (for mouse, keyboard, and/or printer) H LAN (Ethernet 10/100BASE-T) H GPIB H VGA (for an external monitor) 1- 8 RSA3303A & RSA3308A User Manual...
-
Page 37: Installation
3. It is recommended to keep the box and packing materials. You may need them to send this product to Tektronix for calibration or repair. CAUTION. The analyzer has exhaust fans on the side panel. Leave a space of at least 5 cm (2 in) on both sides for proper air circulation. -
Page 38: Applying Power
1. Plug the power cord into the AC input on the rear panel. Cord AC input Figure 1- 7: AC Input (rear panel) 2. Connect the plug of the power cord to a properly grounded outlet. 1- 10 RSA3303A & RSA3308A User Manual... -
Page 39: Figure 1- 8: Principal Power Switch (Rear Panel)
When you turn on the analyzer, Windows XP boots up. After several minutes, the analyzer application starts up. The initial screen appears as shown in Figure 1- -10. The displayed spectrum represents the noise floor of the analyzer. 1- 11 RSA3303A & RSA3308A User Manual... -
Page 40: Figure 1- 10: Initial Screen
RF INPUT connector. If you exceed this input rating, you can permanently damage the analyzer. (The RF INPUT connector is shown in Figure 1- -11.) RF INPUT connector Max +30 dBm AC + DC Figure 1- 11: RF INPUT connector 1- 12 RSA3303A & RSA3308A User Manual... -
Page 41: Setting Up The Stand
To set up the stand, place the analyzer on a table. Lift the front of the analyzer and pull out the stand until it is perpendicular to the analyzer. Stand Figure 1- 12: Setting up the stand 1- 13 RSA3303A & RSA3308A User Manual... -
Page 42: Functional Check
Check that “INPUT: CAL” and “FREE RUN” are displayed in the status indicator at the upper right of the screen (see Figure 1- -13). Status indicator Marker readout Marker Figure 1- 13: Spectrum of the calibration signal (50 MHz, about - 20 dBm) 1- 14 RSA3303A & RSA3308A User Manual... -
Page 43: Figure 1- 14: Setup Display
20 kHz 100 kHz 500 Hz 1 kHz 20 Hz d. Using the numeric keypad, set the span back to 15 MHz. (Press 1 → 5 → MHz, in that order, on the keypad.) 1- 15 RSA3303A & RSA3308A User Manual... -
Page 44: Figure 1- 15: Reference Level Setting And A/D Overflow Indicator
Figure 1- 15: Reference level setting and A/D overflow indicator e. Using the numeric keypad, set the reference level back to 0 dBm. (Press 0 → ENTER, in that order, on the keypad.) 1- 16 RSA3303A & RSA3308A User Manual... -
Page 45: Figure 1- 16: Spectrogram Display
Press the RUN/STOP key on the front panel to stop data acquisition. Confirm that the trace display freezes and PAUSE is displayed in the status indicator at the top right of the screen. Status indicator Spectrogram Figure 1- 16: Spectrogram display 1- 17 RSA3303A & RSA3308A User Manual... -
Page 46: Powering Off The Analyzer
Turning off the principal power switch turns off the front-panel LED. When you do not use the analyzer for a long time or in case of emergency, you should unplug the power cord. 1- 18 RSA3303A & RSA3308A User Manual... -
Page 47: Restart
(dots that never turn on) or stuck pixels (dots that always stay on). This is neither a malfunction nor a defect, and not a cause for repair or exchange. 1- 19 RSA3303A & RSA3308A User Manual... -
Page 48: Backing Up User Files
Word, Excel, and Outlook, on the analyzer. If you install an external application, you do so at your own risk, keeping in mind that it may lower the performance of the analyzer. 1- 20 RSA3303A & RSA3308A User Manual... -
Page 49: Calibration
Calibration Perform these routines to optimize the analyzer performance: H Gain calibration H Center offset calibration H DC offset calibration H Display brightness adjustment Each item is explained in this section. 1- 21 RSA3303A & RSA3308A User Manual... -
Page 50: Cal Menu
The default setting is On. Service... This menu item is only to be used by qualified personnel for repair and calibration. Refer to the RSA3303A and RSA3308A Service Manual (optional accessory) for details. If you want to perform all possible calibration operations together, press the Calibrate All side key. -
Page 51: Calibrating Gain
To run the gain calibration, do the following: 1. Press the CAL key on the front panel. 2. Press the Calibrate Gain side key. The calibration runs. It takes several seconds to complete the process. 1- 23 RSA3303A & RSA3308A User Manual... -
Page 52: Calibrating Center Offset
To run the center offset calibration, do the following: 1. Press the CAL key on the front panel. 2. Press the Calibrate Center Offset side key. The calibration runs. It takes several seconds to complete the process. 1- 24 RSA3303A & RSA3308A User Manual... -
Page 53: Calibrating Dc Offset
To run the DC offset calibration, do the following: 1. Press the CAL key on the front panel. 2. Press the Calibrate DC Offset side key. The calibration runs. It takes several seconds to complete the process. 1- 25 RSA3303A & RSA3308A User Manual... -
Page 54: Adjusting Display Brightness
3. Turn the general purpose knob to adjust the brightness. The setting range is 0 to 100. Confirming Performance The electrical characteristics described in the RSA3303A Technical Reference can be checked only by our service personnel. If you need any service, contact your local Tektronix representative. -
Page 55: Operating Basics
Operating Basics... -
Page 57: Interface Maps
H Using a mouse and keyboard H Display screen H Elements of the display H Status display H Front panel key lock H Setup display For the analyzer specifications, refer to Appendix A: Specifications. 2- 1 RSA3303A & RSA3308A User Manual... -
Page 58: Controls And Connectors
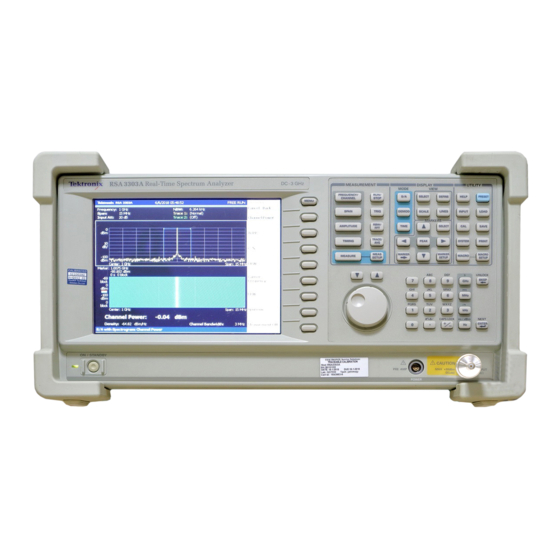
Controls and Connectors Figures 2- -1 through 2- -3 on the following pages show the controls and connec- tors on the front, the side, and the rear panels. Figure 2- 1: Front panel 2- 2 RSA3303A & RSA3308A User Manual... - Page 59 Refer to page 2- -18 for changing a setting using the general purpose knob or the up/down keys. 9. Power switch (ON/STANDBY). Refer to page 1- -10 for applying power. 10. LED. Green on operating, orange on standby. 2- 3 RSA3303A & RSA3308A User Manual...
-
Page 60: Figure 2- 2: Rear Panel
4. TRIG IN/OUT connector. A 50 Ω BNC connector for trigger signal input/output. Refer to page A- -12 for specifications. 5. GPIB connector. Used to control the analyzer from an external controller. Refer to the RSA3303A and RSA3308A Programmer Manual for GPIB control. 6. AC input. Connect AC power cable. -
Page 61: Figure 2- 3: Side Panel
NOTE. The Windows XP default network settings are done when the instrument is shipped from the factory. Contact your system administrator for information about setting network parameters in your LAN. For using Windows XP on the analyzer, refer to page 2- -26. 2- 5 RSA3303A & RSA3308A User Manual... -
Page 62: Figure 2- 4: Connecting Usb Devices
You can connect the devices any time, with no setup (plug & play), to either or both ports. You can also connect a mouse to a USB port on a keyboard (see Figure 2- -4). Figure 2- 4: Connecting USB devices 2- 6 RSA3303A & RSA3308A User Manual... -
Page 63: Figure 2- 5: Operation With Mouse And Keyboard
Alphanumeric input micro (10 ). Press ENTER to complete entry of the value. - - 9 N or n key Alphanumeric input nano (10 ). Press ENTER to complete entry of the value. 2- 7 RSA3303A & RSA3308A User Manual... -
Page 64: Display Screen
Interface Maps Display Screen Figure 2- -6 shows the elements of the display screen. Figure 2- 6: Display screen configuration 2- 8 RSA3303A & RSA3308A User Manual... - Page 65 3- -27 Time Analysis (Time mode) page 3- -81 Setting Views page 3- -191 8. Measurement function display area. Displays the measurement function currently in use (the settings of the Mode and Measure menus). 2- 9 RSA3303A & RSA3308A User Manual...
-
Page 66: Figure 2- 7: Status Display
Thereafter, it is stored in the post-trigger region (see Figure 2- -8). Data memory Pre-trigger region Post-trigger region Time Trigger point Figure 2- 8: Pre- and post-trigger regions 2- 10 RSA3303A & RSA3308A User Manual... -
Page 67: Figure 2- 9: Key Lock Display
To cancel the key lock, the following two methods can be used: H Use the :SYSTEM:KLOCK command to cancel. H Turn off the power and then on. Refer to the RSA3303A and RSA3308A Programmer Manual for information about the GPIB commands. 2- 11... -
Page 68: Figure 2- 10: Setup Display
Indicates time interval between FFT frames. Refer to FFT Start Point on page 3- - 174. Acquisition Length Indicates time to acquire a block of data. Demod and Time It can be set in the Timing menu. 2- 12 RSA3303A & RSA3308A User Manual... -
Page 69: Functional Overview
H MODE. Selects a measurement mode. H VIEW. Selects a view content and scales a measurement graph. H MARKERS. Controls markers. H UTILITY Provides system initialization, waveform storage facilities, instrument calibration, screen hard copy, and miscellaneous other functions. 2- 13 RSA3303A & RSA3308A User Manual... -
Page 70: Table 2- 4: Menu Key Summary
Trigger (page 3- - 145) RBW/FFT Sets RBW and FFT parameters. FFT and RBW (page 3- - 171) TRACE/AVG Controls trace display and average function. Trace Comparison Display and Average Function (page 3- - 181) 2- 14 RSA3303A & RSA3308A User Manual... - Page 71 Prints the screen image. Screen Copy (page 3- - 261) MACRO Shows a menu listing all macros. For installing macros, contact your local Tektronix sales office. MACRO SETUP Shows a menu to configure macros. 2- 15 RSA3303A & RSA3308A User Manual...
-
Page 72: Menu Operations
Returns to the last displayed menu or cancels a partial numeric entry from the keypad. Opens a menu. Figure 2- 12: Example menu item display NOTE. When the setting is prohibited or is not available, the item is displayed in gray. 2- 16 RSA3303A & RSA3308A User Manual... - Page 73 (▲B) keys, or by entering a value using the keypad. Numeric input field Figure 2- 14: Numeric setting menu 2- 17 RSA3303A & RSA3308A User Manual...
- Page 74 H For the up and down keys, the step size is set with the Step Size side key. Refer to Changing the Step Size on page 2- -20 for the detail. The changed value is immediately reflected on the analyzer settings and displays. 2- 18 RSA3303A & RSA3308A User Manual...
- Page 75 3. Confirm the input by pressing the unit key or ENTER key. The confirmed value is immediately reflected to the analyzer settings and display. Press the Cancel - Back side key to cancel the change. 2- 19 RSA3303A & RSA3308A User Manual...
- Page 76 Sets the center frequency step size to the same value as the center frequency. Sets the center frequency step size to the same value as the span. Figure 2- 19: Changing the step size to the predetermined values 2- 20 RSA3303A & RSA3308A User Manual...
-
Page 77: Measurement Basics
3- - 81 page 3- - 81 Pulse Measurements Pulse characteristics analysis Signal Source Analysis Signal source analysis (Option 21) Contains optional analysis functions. Refer to Appendix E: Options and Accessories for optional software. 2- 21 RSA3303A & RSA3308A User Manual... - Page 78 H Pressing the PRESET key returns the instrument settings to the factory defaults for the current measurement mode. H Pressing SYSTEM → Reset All to Factory Defaults sets all parameters for all measurements and modes to the default values. 2- 22 RSA3303A & RSA3308A User Manual...
-
Page 79: Setting System Parameters
Reset All to Factory Defaults. Sets all parameters for all measurements and modes to the default values. Remote Setup... Sets GPIB parameters. Refer to the RSA3303A Programmer Manual for details. Versions and Installed Options. Displays the current versions of all standard and optional software, and any third party software licenses. - Page 80 H Not Present: Indicates that you cannot use the option. For information about how to remove the protection and use the option, refer to Enabling the Option. 3. To exit the version display, press any front-panel key. 2- 24 RSA3303A & RSA3308A User Manual...
- Page 81 Functional Overview Enabling the Option. 1. Contact your local Tektronix office to order the option. You will receive an option key (alphanumeric code). 2. Press the Option Key side key (see Figure 2- -24) and enter the option key using the alphanumeric keypad on the front panel.
-
Page 82: Using Windows Xp
2. Use a mouse to move the pointer to the bottom of screen (see Figure 2- -25). The task bar appears. 3. Locate the pointer on the RSA3303A or RSA3308A icon in the task bar and right-click. A menu appears. - Page 83 Functional Overview When you move the mouse pointer to the bottom of the screen, the task bar appears. Task bar RSA icon Figure 2- 25: Displaying the Windows XP accessory menu 2- 27 RSA3303A & RSA3308A User Manual...
- Page 84 Functional Overview 2- 28 RSA3303A & RSA3308A User Manual...
-
Page 85: Tutorial
H Using averaging and comparison displays H Displaying spectrogram H Spectrum analysis H Modulation analysis H Shutting off the power You must complete the installation procedures (starting on page 1- -9) before performing any of the following steps. 2- 29 RSA3303A & RSA3308A User Manual... -
Page 86: Preparations
... Modulation source ..Internal 10 kHz Modulation depth ..2- 30 RSA3303A & RSA3308A User Manual... - Page 87 Figure 2- 27: Principal power switch (rear panel) 3. Turn on the power switch (ON/STANDBY) on the front panel, as shown in Figure 2- -28. Power switch Figure 2- 28: Power switch (ON/STANDBY) 2- 31 RSA3303A & RSA3308A User Manual...
- Page 88 The initial screen shown in Figure 2- -29 appears after Windows XP starts up (the background color is in white on this manual to make figures more viewable). Figure 2- 29: Initial screen 2- 32 RSA3303A & RSA3308A User Manual...
- Page 89 This tutorial starts with the factory default settings. Perform the following steps to restore the factory default settings: 1. Press the SYSTEM key. SYSTEM key 2. Press the Reset All to Factory Defaults side key. The instrument is now ready to take measurements. 2- 33 RSA3303A & RSA3308A User Manual...
-
Page 90: Displaying Spectrum
The center frequency is set to 1.5 GHz, and span is set to 15 MHz when you and Span power on the analyzer. Change the settings of center frequency and span to display the waveform around 100 MHz. 1. Press the FREQUENCY/CHANNEL key on the front panel. FREQUENCY/CHANNEL key 2- 34 RSA3303A & RSA3308A User Manual... - Page 91 The unit keys also function as enter keys. When you press any of these keys, the numeric value you enter will be set immediately with the unit. Accepts the inputs. Numeric keys Figure 2- 32: Numeric value entry keypad 2- 35 RSA3303A & RSA3308A User Manual...
- Page 92 The next step is to set the span. It is currently set to 15 MHz as the default value. Change the setting to 20 kHz. 3. Press the SPAN key on the front panel. SPAN key 2- 36 RSA3303A & RSA3308A User Manual...
- Page 93 The hardware is set with the selected value immediately. The spectrum waveform is displayed on the screen as shown in Figure 2- -34. Figure 2- 34: Center frequency of 100 MHz, span of 20 kHz 2- 37 RSA3303A & RSA3308A User Manual...
- Page 94 1. Press the Amplitude key on the front panel. AMPLITUDE key The Amplitude menu is displayed on the right side of the screen. Notice that the Ref Level item is available for entering amplitude (see Figure 2- -36). 2- 38 RSA3303A & RSA3308A User Manual...
- Page 95 0 dBm or higher, a blue standard line is displayed indicating 0 dBm. 3. Set the Ref Level back to 0 dBm after confirming the amplitude operation. 0 dBm reference line Figure 2- 37: Reference level of 10 dBm 2- 39 RSA3303A & RSA3308A User Manual...
- Page 96 3. Press the Repeat... side key again and select Continuous to return to the continuous mode. When acquisition starts, “READY” is displayed in the status indicator, indicating that the analyzer is ready for trigger. 2- 40 RSA3303A & RSA3308A User Manual...
-
Page 97: Using Markers And Peak Search
The marker (V) appears at center on the waveform. 3. The Marker X Position menu item is selected by default. Turn the general purpose knob to move the marker to a measurement point (see Figure 2- -39). 2- 41 RSA3303A & RSA3308A User Manual... - Page 98 This means that Marker 1 is the active marker. 4. The Marker X Position menu item is selected. Using the general purpose knob or the numeric input keypad, move the marker to a reference point (see Figure 2- -40). 2- 42 RSA3303A & RSA3308A User Manual...
- Page 99 The difference between the two marker positions is indicated in the upper left part of the screen: 7. Press the Markers side key to select Single. The analyzer returns to the single marker mode. 2- 43 RSA3303A & RSA3308A User Manual...
- Page 100 5. Press the marker left key (A) to move the marker to the next signal peak to the left. Try it several times. 6. Using the marker left or right key, put the marker to the measurement peak. 2- 44 RSA3303A & RSA3308A User Manual...
- Page 101 (see Figure 2- -41). Peak value at the selected marker Marker 1 Peak difference Marker 2 Figure 2- 41: Searching for the peak 7. Press the Markers side key to select Off. Both markers disappear. 2- 45 RSA3303A & RSA3308A User Manual...
-
Page 102: Using Averaging And Comparison Displays
In this example, enter 64 with the numeric keypad. Press 6 4 ENTER in order. 4. Press the RUN/STOP key on the front panel to acquire waveform. 2- 46 RSA3303A & RSA3308A User Manual... - Page 103 Average count Trace 1 Type Selects the type of processing for the selected trace. Figure 2- 42: Averaging a waveform 5. Press the Reset Average side key to restart averaging. 2- 47 RSA3303A & RSA3308A User Manual...
- Page 104 Trace 1 (Yellow): currently acquired waveform. Trace 2 (Green): averaged waveform. Figure 2- 43: Comparison display with averaged waveform 7. Press the Trace 2 Type... side key again and select Off to remove Trace 2. 2- 48 RSA3303A & RSA3308A User Manual...
-
Page 105: Displaying A Spectrogram
3. If no waveform is displayed, press the RUN/STOP key to acquire data. The spectrum and spectrogram are displayed concurrently (see Figure 2- -44). Spectrum Spectrogram Figure 2- 44: Concurrent display of spectrum and spectrogram 2- 49 RSA3303A & RSA3308A User Manual... - Page 106 VIEW: DEFINE key Modifies display format. b. Press the View Orientation side key to select Tall. Figure 2- 45: Tall display of spectrum and spectrogram c. Press the View Orientation side key to select Wide. 2- 50 RSA3303A & RSA3308A User Manual...
- Page 107 Amplitude is represented in color. Default scale is from Red (0dBm) to Blue (- - 100dBm). Frequency Figure 2- 46: Spectrogram view c. Press the Show Views side key again to return to Multi. 2- 51 RSA3303A & RSA3308A User Manual...
-
Page 108: Spectrum Analysis
Measuring Channel Power 1. Press the MEASURE key on the front panel. MEASURE key Selects a measurement item Measurement items are displayed in the menu on the right side of the screen. 2- 52 RSA3303A & RSA3308A User Manual... - Page 109 A band power marker, indicating measurement range, is displayed on the spectrum waveform. The measurement result is displayed below the waveform (see Figure 2- -47). Select Channel Power here Band power marker Measurement results Figure 2- 47: Channel power measurement 2- 53 RSA3303A & RSA3308A User Manual...
- Page 110 40 kHz for example. See the display in Figure 2- -48. Channel Bandwidth Sets the measurement bandwidth. Channel Bandwidth = 40 kHz Figure 2- 48: Channel power measurement (Channel Bandwidth = 40 kHz) 2- 54 RSA3303A & RSA3308A User Manual...
- Page 111 2. Press the Carrier Frequency side key. The measurement result is displayed at the bottom of the screen (see Figure 2- -49). Carrier frequency measurement result: measured accurately with counter function. Figure 2- 49: Carrier frequency measurement 2- 55 RSA3303A & RSA3308A User Manual...
-
Page 112: Modulation Analysis
The measurement procedures for modulation analysis and the time analysis are similar. Select the analog modulation analysis here: 1. Press the DEMOD key on the front panel. 2. Press the Analog Demod side key. 2- 56 RSA3303A & RSA3308A User Manual... - Page 113 FFT-processed and displayed in the subview. The data in the range indicated by the green underline is analyzed and displayed in the main view. Main view Figure 2- 51: AM signal measurement 2- 57 RSA3303A & RSA3308A User Manual...
- Page 114 For example, enter 32 ms using the numeric keypad. 4. Press the Analysis Offset side key and specify the starting point of the range. For example, enter 24 ms using the numeric keypad. 2- 58 RSA3303A & RSA3308A User Manual...
- Page 115 Specifies the time length of the The main view shows the waveform and analysis range. measurement result for the analysis range. Analysis Offset Specifies the start point of the analysis range. Figure 2- 52: Analysis range settings 2- 59 RSA3303A & RSA3308A User Manual...
- Page 116 The number of frames in a block is 64÷32 = 2. 2. Press the Acquisition Length side key to change the value. For example, set 256 ms by turning the knob (see Figure 2- -54). 2- 60 RSA3303A & RSA3308A User Manual...
- Page 117 In this case, Acquisition Length is 256 ms and Spectrum Length 32 ms, so the data is displayed in the overview for 256÷32 = 8 frames (8192 points). The green underline indicating the analysis range gets narrower than the previous setting: one block = 2 frames. 2- 61 RSA3303A & RSA3308A User Manual...
- Page 118 Only the main view is displayed, with the size enlarged on the screen. Show Views Select Single to show only the selected view with the size enlarged. Figure 2- 55: Single view display 2- 62 RSA3303A & RSA3308A User Manual...
- Page 119 1. Press the MEASURE key on the front panel. 2. Press the Measurement Off side key. The display returns to the spectrum view. However, the analysis mode is still in the Demod mode. 2- 63 RSA3303A & RSA3308A User Manual...
-
Page 120: Turning Off The Power
1. Press the ON/STANDBY switch at the lower left of the front panel. The shutdown process of Windows XP runs and the power source goes to standby state, with the orange LED on. 2. Turn off the signal generator. You have now completed the tutorial. 2- 64 RSA3303A & RSA3308A User Manual... -
Page 121: Reference
Reference... -
Page 123: Spectrum Analysis (S/A Mode)
H Real Time S/A with Zoom. Performs real-time spectrum analysis with zoom function. Refer to page 3- -24 for details. H Standard..Performs spectrum analysis according to a communication standard. No function is included currently. 3- 1 RSA3303A & RSA3308A User Manual... -
Page 124: Measurement Screen Layout
The spectrum waveform and measurement results are displayed. You can display the spectrum and the spectrogram at the same time. Refer to Spectrogram Display on page 3- -18. Spectrum Measurement result Measurement item Figure 3- 2: S/A measurement screen 3- 2 RSA3303A & RSA3308A User Manual... -
Page 125: Figure 3- -3: "Flex" Grid Style 3
Flex. Displays the graticule with the horizontal scale (per division) in a 1-2-5 sequence. The horizontal scale is set to 50 kHz/div for span of 300 kHz in the “Flex” grid style. Figure 3- 3: “Flex” grid style 3- 3 RSA3303A & RSA3308A User Manual... -
Page 126: Spectrum Analysis
Set the span by pressing the SPAN key on the front panel. d. Set the amplitude by pressing the AMPLITUDE key on the front panel. 4. Set the following Measurement Setup controls by pressing the MEAS SETUP key on the front panel. 3- 4 RSA3303A & RSA3308A User Manual... -
Page 127: Figure 3- -4: Channel Power Measurement Band Power Markers 3
H Root Nyquist Rolloff Ratio. Enters rolloff ratio when Nyquist or Root Nyquist filter is selected. Range: 0.0001 to 1 (default value: 0.5). Integration Bandwidth Figure 3- 4: Channel power measurement band power markers 3- 5 RSA3303A & RSA3308A User Manual... -
Page 128: Figure 3- -5: Channel Power Measurement 3
Spectrum Analysis (S/A Mode) An example of the channel power measurement is shown in Figure 3- -5. Figure 3- 5: Channel power measurement 3- 6 RSA3303A & RSA3308A User Manual... -
Page 129: Figure 3- -6: Acpr Measurement Band Power Markers 3
Range: 0.0001 to 1 (default value: 0.5). Lower3 Lower2 Lower1 Main Upper1 Upper2 Upper3 Main Chan Bandwidth Adj Chan Bandwidth Adj Chan Bandwidth Chan Spacing Figure 3- 6: ACPR measurement band power markers 3- 7 RSA3303A & RSA3308A User Manual... -
Page 130: Figure 3- -7: Example Of Acpr Measurement 3
Spectrum Analysis (S/A Mode) Figure 3- -7 shows an example of the ACPR measurement. Figure 3- 7: Example of ACPR measurement 3- 8 RSA3303A & RSA3308A User Manual... -
Page 131: Figure 3- -8: C/N Measurement Band Power Markers 3
Rolloff Ratio. Enters rolloff ratio when Nyquist or Root Nyquist filter is selected. Range: 0.0001 to 1 (default value: 0.5). Carrier Bandwidth Noise Bandwidth Offset Figure 3- 8: C/N measurement band power markers 3- 9 RSA3303A & RSA3308A User Manual... -
Page 132: Figure 3- -9: Example Of C/N Measurement 3
Spectrum Analysis (S/A Mode) Figure 3- -9 shows an example of the C/N measurement. Figure 3- 9: Example of C/N measurement 3- 10 RSA3303A & RSA3308A User Manual... -
Page 133: Figure 3- -10: Obw Measurement Band Power Marker 3
OBW (see Figure 3- -10). The default setting is 99% as defined in T- -53 or IS- -95 standard. Range: 80 to 99.99%. Power Ratio = (Cp/Sp)¢100 Cp: Power of carrier region Sp: Power of span region Figure 3- 10: OBW measurement band power marker 3- 11 RSA3303A & RSA3308A User Manual... -
Page 134: Figure 3- -11: Example Of Obw Measurement 3
Spectrum Analysis (S/A Mode) Figure 3- -11 shows an example of the OBW measurement. Figure 3- 11: Example of OBW measurement 3- 12 RSA3303A & RSA3308A User Manual... -
Page 135: Figure 3- -12: Carrier Frequency Measurement 3
Range: 1 mHz to 1 MHz in a tenfold sequence (default: 1 Hz). Figure 3- -12 shows an example of the carrier frequency measurement. Carrier frequency measurement value Figure 3- 12: Carrier frequency measurement 3- 13 RSA3303A & RSA3308A User Manual... -
Page 136: Figure 3- -13: Ebw Measurement Band Power Markers 3
Measurement Level. Specifies how far down from the peak level the bandwidth is measured (see Figure 3- -13). Range: - -100 to - -1 dB (default: - -30 dB). Emission bandwidth Measurement Level Figure 3- 13: EBW measurement band power markers 3- 14 RSA3303A & RSA3308A User Manual... -
Page 137: Figure 3- -14: Ebw Measurement 3
Spectrum Analysis (S/A Mode) Figure 3- -14 shows an example of the EBW measurement. Figure 3- 14: EBW measurement 3- 15 RSA3303A & RSA3308A User Manual... -
Page 138: Figure 3- -15: Setting Up Spurious Signal Measurement 3
Scroll Table. Horizontally scrolls the spurious table displayed in the lower part of the screen. Up to 20 spurious signals are displayed. Ignore Region Standard signal peak Signal Threshold Spurious Threshold Excursion Normal signal Spurious signal Figure 3- 15: Setting up spurious signal measurement 3- 16 RSA3303A & RSA3308A User Manual... -
Page 139: Figure 3- -16: Example Of Spurious Signal Measurement 3
Detected spurious signals are assigned markers, numbered in descending order by amplitude. The frequency difference (deltaF) and the amplitude ratio (Ratio) in relation to the standard signal are shown in the table in the lower part of the screen. 3- 17 RSA3303A & RSA3308A User Manual... -
Page 140: Spectrogram Display
2. Press the S/A with Spectrogram side key. The spectrum and spectrogram are displayed on the same screen as shown in Figure 3- -17. Spectrum Spectrogram Figure 3- 17: Spectrum and spectrogram concurrent display 3- 18 RSA3303A & RSA3308A User Manual... -
Page 141: Figure 3- -18: View Orientation 3
4. Press the Show Views side key and select Single as shown in Figure 3- -19. Single display Displays the selected view on one screen. Figure 3- 19: Single display Refer to Setting Views on page 3- -191 for details. 3- 19 RSA3303A & RSA3308A User Manual... -
Page 142: Real-Time Analysis
The block size specified with the Timing menu (one frame = 1024 points fixed) Time Real-time mode Frame - - N Frame - - 2 Frame - - 1 Frame 0 Figure 3- 20: Difference between normal and real-time modes 3- 20 RSA3303A & RSA3308A User Manual... -
Page 143: Table 3- 2: Features Of The Real-Time Mode
100 Hz to 10 MHz (1-2-5 sequence) and 15 MHz Baseband 100 Hz to 20 MHz (1-2-5 sequence) Baseband: DC to 20 MHz; RF: 15 MHz to 3 GHz (RSA3303A) / 8 GHz (RSA3308A) 3- 21 RSA3303A & RSA3308A User Manual... - Page 144 Press the MARKER SETUP key. c. Press the Go to page 2 → Marker X Vertical side key. d. Set the frame number by turning the general purpose knob or using the numeric keypad. 3- 22 RSA3303A & RSA3308A User Manual...
-
Page 145: Figure 3- -21: Real-Time Mode 3
Refer to Spectrogram Display on page 3- -18. NOTE. In real-time mode, you cannot turn on or off the spectrogram in the View: Define menu. 3- 23 RSA3303A & RSA3308A User Manual... -
Page 146: Zoom Function
Frequency Center. Sets the frequency of the center of zoomed area. Frequency Width. Sets the frequency width of the zoomed area. Refer to Setting Timing Parameters on page 3- -139. 3- 24 RSA3303A & RSA3308A User Manual... -
Page 147: Figure 3- -23: Zoom Domain Settings Using The Timing Menu 3
6. Move the marker to the lower right point of the zoomed area using the Marker X Position and Marker X Vertical side keys. [Mouse] Move the mouse pointer to the lower right point of the zoomed area and left-click to put the marker on it. 3- 25 RSA3303A & RSA3308A User Manual... -
Page 148: Figure 3- -24: Zoomed Area Settings Using The Marker 3
So, a large zoom ratio may cause the skirt shape of the spectrum to differ from that of the spectrum without zoom. However, it does not affect carrier power measurement results. 3- 26 RSA3303A & RSA3308A User Manual... -
Page 149: Modulation Analysis (Demod Mode)
H Digital Demod. Option 21 Only. Performs digital modulation analysis. Refer to page 3- -43 for details. H Standard... Performs modulation analysis according to a communication standard. For RFID analysis, refer to page 3- -60. 3- 27 RSA3303A & RSA3308A User Manual... -
Page 150: Measurement Screen Layout
Timing indicator “T” indicates a trigger point. The main view displays the measurement result and waveform for the range indicated by the green horizontal line. Main view Figure 3- 26: Demod mode screen 3- 28 RSA3303A & RSA3308A User Manual... -
Page 151: Figure 3- -27: Analysis Range Setting In The Overview 3
5. Specify the start point of the analysis range by pressing the Analysis Offset side key. Analysis Offset Acquisition History Analysis Length Overview Acquisition Length Figure 3- 27: Analysis range setting in the overview 3- 29 RSA3303A & RSA3308A User Manual... -
Page 152: Figure 3- -28: Markers Keys 3
4. Press the MARKER ➡ key on the front panel and then press the Analysis Time = Marker Time side key. The green line resizes to the specified range. MARKER ➡ key MARKER SETUP key Figure 3- 28: MARKERS keys 3- 30 RSA3303A & RSA3308A User Manual... -
Page 153: Figure 3- -29: Specifying The Range With The Marker And The Reference Cursor 3
Analysis Time = Marker Time side key. The green line resizes to the specified range. Overview Reference Cursor Marker The analysis range specified with the marker and the reference cursor Figure 3- 29: Specifying the range with the marker and the reference cursor 3- 31 RSA3303A & RSA3308A User Manual... -
Page 154: Figure 3- -30: Specifying The Analysis Range Using The Mouse 3
2. Set the end point: Left-click to put the marker. 3. Set the analysis range: Press MARKER➡ → Analysis Time = Marker Time Figure 3- 30: Specifying the analysis range using the mouse 3- 32 RSA3303A & RSA3308A User Manual... -
Page 155: Figure 3- -31: Fft Processing Range Setting On The Overview 3
1. Press the VIEW: DEFINE key on the front panel. 2. Press the Overview Content... side key and select the overview: H Waveform (Amplitude versus Time, default display) H Spectrogram The overview displays all data in one acquisition block. 3- 33 RSA3303A & RSA3308A User Manual... -
Page 156: Figure 3- -32: Changing The Overview And Subview 3
The subview content depends on measurement. Refer to each measurement description. Overview: Spectrogram Subview: Eye diagram VIEW: DEFINE menu Overview Content... Selects an overview display. Subview Content... Selects a subview display. Figure 3- 32: Changing the overview and subview 3- 34 RSA3303A & RSA3308A User Manual... -
Page 157: Figure 3- -33: One-View Display 3
3. Press the Show Views side key to select Single. Figure 3- -33 shows the one view display. Single The selected view is surrounded by a white box. One-view display Figure 3- 33: One-view display 3- 35 RSA3303A & RSA3308A User Manual... -
Page 158: Analog Modulation Analysis
Refer to page 3- -29 for information about setting the analysis range. 6. Set the measurement parameters by pressing the MEAS SETUP key on the front panel. For the Meas Setup menu, refer to the following sections. 3- 36 RSA3303A & RSA3308A User Manual... - Page 159 The following pages show examples for each measurement item. Refer to page 3- -191 for information about setting scale and formatting each view. Refer to page 3- -33 for information about changing the overview and subview. 3- 37 RSA3303A & RSA3308A User Manual...
-
Page 160: Figure 3- -34: Am Demod Measurement 3
Measurement results From the top: G Positive peak AM value G Negative peak AM value G Total AM value = (peak-peak AM value) / 2 Modulation factor variation Figure 3- 34: AM demod measurement 3- 38 RSA3303A & RSA3308A User Manual... -
Page 161: Figure 3- -35: Fm Demod Measurement 3
G Peak-to-peak frequency deviation G (Peak-to-peak frequency deviation) / 2 G Positive peak frequency deviation G Negative peak frequency deviation G RMS frequency deviation Frequency deviation variation Figure 3- 35: FM demod measurement 3- 39 RSA3303A & RSA3308A User Manual... -
Page 162: Figure 3- -36: Pm Demod Measurement 3
Overview: Power versus Time Subview: Spectrum Main view: Phase deviation variation Figure 3- 36: PM demod measurement You can select degree or radian for the angular unit by pressing SYSTEM → Instrument Setup...→ Angular Units. 3- 40 RSA3303A & RSA3308A User Manual... -
Page 163: Figure 3- -37: Iq Versus Time Measurement 3
The IQ level measurement has no Meas Setup menu items. Overview: Power versus Time Subview: Spectrum Main view: I/Q voltage versus Time (I and Q are indicated in yellow and green, respectively) Figure 3- 37: IQ versus time measurement 3- 41 RSA3303A & RSA3308A User Manual... -
Page 164: Figure 3- -38: Pulse Spectrum Measurement 3
The pulse spectrum measurement has no Meas Setup menu items. Overview: Power versus Time Subview: Spectrum Main view: Pulse spectrum (FFT for the analysis range specified in the overview) Figure 3- 38: Pulse spectrum measurement 3- 42 RSA3303A & RSA3308A User Manual... -
Page 165: Digital Modulation Analysis (Option 21 Only)
H Eye Diagram page 3- -54 H AM/AM page 3- -55 H AM/PM page 3- -57 H CCDF page 3- -58 H PDF page 3- -59 Refer to Appendix C for digital demodulation symbol mapping. 3- 43 RSA3303A & RSA3308A User Manual... -
Page 166: Table 3- 4: Communication Standard And Parameters
Table 3- 5: Modulation type and available measurement item Measurement item 1/4πQPSK PSK/QAM GMSK GFSK OQPSK P25_C4FM Constellation IQ/Frequency versus Time Power versus Time Symbol Table Eye Diagram AM/AM AM/PM CCDF Includes BPSK, QPSK, 8PSK, 16QAM, 32QAM, 64QAM, 128QAM, and 256QAM. 3- 44 RSA3303A & RSA3308A User Manual... - Page 167 H On. Default. Automatically calculates the modulation depth for the analysis range and displays the value in the Modulation Depth side key. H Off. Sets the modulation depth using the Modulation Depth side key. 3- 45 RSA3303A & RSA3308A User Manual...
- Page 168 H 0. Does not shift Q data (default). H - -. Shifts Q data by half a symbol in the negative direction on the time axis. This function is available in the following views: 3- 46 RSA3303A & RSA3308A User Manual...
-
Page 169: Figure 3- -39: Process Flow For Digitally-Modulated Signals 3
The Constellation, Symbol table, and Eye diagram displays are based on measurement data, and the EVM, AM/AM, AM/PM, CCDF, and PDF displays are based on the comparison of the measurement data and the reference data. 3- 47 RSA3303A & RSA3308A User Manual... - Page 170 The following pages show examples for each measurement item. Refer to page 3- -191 for information about setting scale and formatting each view. Refer to page 3- -33 for information about changing the overview and subview. 3- 48 RSA3303A & RSA3308A User Manual...
-
Page 171: Figure 3- -40: Constellation Analysis 3
P25 C4FM modulation only Modulation fidelity measurement results from the top: G RMS error magnitude (normalized by the deviation) G Carrier frequency offset G Frequency deviation G Symbol length Figure 3- 40: Constellation analysis 3- 49 RSA3303A & RSA3308A User Manual... -
Page 172: Figure 3- -41: Evm Measurement 3
G Origin offset NOTE. “Origin offset” is also called “IQ feedthrough”. Figure 3- 41: EVM measurement You can select degree or radian for the angular unit by pressing SYSTEM → Instrument Setup...→ Angular Units. 3- 50 RSA3303A & RSA3308A User Manual... -
Page 173: Figure 3- -42: Iq/Frequency Versus Time Measurement 3
G RMS error magnitude (normalized by the deviation) G Carrier frequency offset The red dots indicate the symbol points. G Frequency deviation G Symbol length Figure 3- 42: IQ/Frequency versus time measurement 3- 51 RSA3303A & RSA3308A User Manual... -
Page 174: Figure 3- -43: Power Variance Measurement 3
For the Meas Setup menu, refer to page 3- -44. For setting views, refer to page 3- -191. Overview: Power versus Time Subview: Spectrum Main view: Power versus Time Figure 3- 43: Power variance measurement 3- 52 RSA3303A & RSA3308A User Manual... -
Page 175: Figure 3- -44: Symbol Table Analysis 3
For the Meas Setup menu, refer to page 3- -44. For setting views, refer to page 3- -191. Overview: Power versus Time Subview: Spectrum Main view: Symbol table Figure 3- 44: Symbol table analysis 3- 53 RSA3303A & RSA3308A User Manual... -
Page 176: Figure 3- -45: Eye Diagram Analysis 3
Overview: Power versus Time Subview: Spectrum Main view: Eye diagram Figure 3- 45: Eye diagram analysis You can select degree or radian for the angular unit by pressing SYSTEM → Instrument Setup...→ Angular Units. 3- 54 RSA3303A & RSA3308A User Manual... -
Page 177: Figure 3- -46: Setting Linear Signal Region 3
The polynomial is expressed as follows (n: Max 15): f (x) = a + ... + a The values of are shown in the main view (see Figure 3- -47 on page 3- -56). 3- 55 RSA3303A & RSA3308A User Manual... -
Page 178: Modulation Analysis 2
(Refer to Maximum Coefficient on page 3- - 55) coefficient coefficient Red points: Measurement points Yellow lines: Measurement lines Blue line: Reference line Pink line: Best-fit line Oblique lines: Linear signal region Figure 3- 47: AM/AM measurement 3- 56 RSA3303A & RSA3308A User Manual... -
Page 179: Figure 3- -48: Am/Pm Measurement 3
AM/PM distortion graph (Refer to Maximum Coefficient on page 3- - 55) coefficient coefficient Red points: Measurement points Yellow lines: Measurement lines Blue line: Reference line Pink line: Best-fit line Figure 3- 48: AM/PM measurement 3- 57 RSA3303A & RSA3308A User Manual... -
Page 180: Figure 3- -49: Ccdf Measurement 3
NOTE. The reference line is displayed in the Yellow line: Measurement line CCDF graph when the subview content is Green line: Recovered reference line AM/AM or AM/PM. Blue line: Gaussian line Figure 3- 49: CCDF measurement 3- 58 RSA3303A & RSA3308A User Manual... -
Page 181: Figure 3- -50: Pdf Measurement 3
NOTE. The reference line is displayed in Yellow line: Measurement line the PDF graph when the subview content Green line: Recovered reference line is AM/AM or AM/PM. Blue center line: Average power Figure 3- 50: PDF measurement 3- 59 RSA3303A & RSA3308A User Manual... -
Page 182: Rfid Analysis (Option 21 Only)
Logical Communication Interface Specification Recommended Standard, Version 1.0.0 H C0G1 (EPCglobal Gen1 Class0). Auto-ID Center Draft protocol specifica- tion for a 900 MHz Class 0 Radio Frequency Identification Tag NOTE. This instrument does not support ISO/IEC 18000-4 Mode-2. 3- 60 RSA3303A & RSA3308A User Manual... -
Page 183: Table 3- 6: Measurement Items For Rfid Analysis
G Constellation Power G Eye diagram G Symbol table Power on Power down Tag-to-Interrogator signaling (response) Interrogator-to-Tag signaling (command) G Carrier G Spurious Time G ACPR Figure 3- 51: RFID waveform and measurement items 3- 61 RSA3303A & RSA3308A User Manual... - Page 184 6. Press the MEAS SETUP key and set the measurement parameters. Refer to Meas Setup Menu in each measurement description. 7. Press the Analyze side key and carry out the analysis. (It is not necessary in the spurious and ACPR measurements.) 3- 62 RSA3303A & RSA3308A User Manual...
- Page 185 Range: - -100 to 100 dB (default: 0 dB). Channel Bandwidth. Sets the channel bandwidth for the maximum EIRP measurement. Range: 0 to Span (default: 0 Hz). Figure 3- -52 shows an example of the carrier measurement. 3- 63 RSA3303A & RSA3308A User Manual...
-
Page 186: Figure 3- -52: Carrier Measurement 3
H Zoom (Spectrogram with the zoom function) Selects Waveform or Zoom while selecting the analysis range. Refer to Zoom Function on page 3- -24 for setting the analysis area on the spectrogram with the zoom function. 3- 64 RSA3303A & RSA3308A User Manual... -
Page 187: Figure 3- -53: Spurious Measurement 3
S/A mode (refer to page 3- -16). Video filter indicator displayed when On. The spurious detection range is displayed in blue. Spurious marker Measurement table (Up to 20 spurious signals displayed) Figure 3- 53: Spurious measurement 3- 65 RSA3303A & RSA3308A User Manual... - Page 188 VBW. Sets the frequency bandwidth of the video filter. Range: 1 Hz to 1 GHz. The setting value may be limited by the sweep time setting. Sweep Time for VBW. Sets the sweep time to scan a set span. Range: 1 µs to 100 s. 3- 66 RSA3303A & RSA3308A User Manual...
-
Page 189: Figure 3- -54: Acpr Measurements 3
Adjacent channel channel selected with Scroll Table Measurement table. The channel selected by the Scroll Table side key is indicated by the red band-power cursor with the waveform. Figure 3- 54: ACPR measurements 3- 67 RSA3303A & RSA3308A User Manual... -
Page 190: Table 3- 7: Standard Settings
Miller (M_2 / M_4 / M_8) 14443-2-A Interrogator to Tag Modified Miller / NRZ 105.9375 kbps Tag to Interrogator Subcarrier OOK Manchester / NRZ 105.9375 kbps Subcarrier BPSK NRZ-L (4 periods) 211.875 kbps NRZ-L (2 periods) 423.75 kbps 3- 68 RSA3303A & RSA3308A User Manual... - Page 191 Refer to the ISO/IEC and EPCglobal documents listed in Compatible Standards on page 3- -60 for details on the encoding/decod- ing formats except the modified Miller code illustrated in Figure 3- -55. 3- 69 RSA3303A & RSA3308A User Manual...
-
Page 192: Figure 3- -55: Modified Miller Code 3
See Figure 3- -56. Range: 1 to 50% (default: 10%) Higher Threshold. Sets a higher threshold value for measuring the rise/fall time of the pulse. See Figure 3- -56. Range: 50 to 99% (default: 90%) 3- 70 RSA3303A & RSA3308A User Manual... -
Page 193: Parameters 3
Settling Error Width Overshoot 100% Undershoot Higher Threshold Lower Threshold Off level (Average level below the lower threshold) Settling time Time Rise time Fall time Figure 3- 56: Transmission power on/down measurement parameters 3- 71 RSA3303A & RSA3308A User Manual... - Page 194 5. Press the Bit Rate side key and set the bit rate, or press the Tari side key and set the Tari. Enter a value near the true value (within about ±20% of the true value). 6. Press the Auto Bit Rate or Auto Tari side key to select On. 3- 72 RSA3303A & RSA3308A User Manual...
-
Page 195: Figure 3- -57: Power On/Down Measurements 3
3- - 71) Measurement table G Rise/Fall time G Settling time G Overshoot G Undershoot G Off level Edge number (selected by VIEW: DEFINE → Edge #) Figure 3- 57: Power on/down measurements 3- 73 RSA3303A & RSA3308A User Manual... - Page 196 VIEW: SCALE → Unit. NOTE. The measurement table in the main view always displays the results for waveform data with the default unit of W. Selecting the unit does not affect the table contents. 3- 74 RSA3303A & RSA3308A User Manual...
-
Page 197: Table 3- 8: Details Of The Rf Envelope Measurement Table
Duty cycle (=(On-width)/(Period)) On-ripple / Off-ripple Ripple of on-time or off-time Slope 1, 2, and 3 Rise/Fall time of slope 1, 2, and 3 (Slope 3 is Slope 1 of the envelope on the right) 3- 75 RSA3303A & RSA3308A User Manual... -
Page 198: Figure 3- -59: Rf Envelope Measurement Parameters 3
* (Duty cycle) = (On-width)/(Period) Figure 3- 59: RF envelope measurement parameters You can save the measurement table to a file (*.csv) by SAVE → Save Table. For file operations, refer to page 3- -237. 3- 76 RSA3303A & RSA3308A User Manual... - Page 199 Display Area. Valid for the constellation and the eye diagram views. Sets the percentage of area in the selected burst to display from the beginning. Range: 0.1 to 100% (default: 100%). 100% represents the whole burst. 3- 77 RSA3303A & RSA3308A User Manual...
-
Page 200: Figure 3- -60: Constellation, Eye Diagram, And Symbol Table Main View) 3
Constellation Measurement results (refer to Table 3- - 10) Eye diagram Display Area setting (refer to page 3- - 77) Symbol table Figure 3- 60: Constellation, eye diagram, and symbol table (main view) 3- 78 RSA3303A & RSA3308A User Manual... -
Page 201: Table 3- 9: Symbol Value Definition
G Estimated symbol rate G Estimated symbol rate (duration of a data-0) G Subcarrier jitter (rms) G Estimated Tari data-1 G Frequency offset (duration of a data-1) Set in the Meas Setup menu. 3- 79 RSA3303A & RSA3308A User Manual... -
Page 202: Figure 3- -61: Definition Of The Modulation Depth And Index 3
Figure 3- -61 shows the definition of the modulation depth and index. Voltage Modulation depth = (A- - B)/A Modulation index = (A- - B)/(A+B) Time Figure 3- 61: Definition of the modulation depth and index 3- 80 RSA3303A & RSA3308A User Manual... -
Page 203: Time Analysis (Time Mode)
The measurement screen layout in the time analysis (Time mode) is the same as in the modulation analysis (Demod mode). Refer to Measurement Screen Layout on page 3- -28 for the view functions, setting an analysis range, and changing the view content. 3- 81 RSA3303A & RSA3308A User Manual... -
Page 204: Time Variation Measurement
The following pages show the examples for each measurement item. Refer to page 3- -191 for information about setting scale and formatting each view. Refer to page 3- -33 for information about changing the overview. 3- 82 RSA3303A & RSA3308A User Manual... -
Page 205: Figure 3- -63: Iq Versus Time Measurement 3
I/Q voltage versus time. I and Q are indicated in yellow and green, respectively. Overview: Power vs. Time Subview: Spectrum Main view: I/Q voltage vs. Time (I and Q waveform are displayed in yellow and green, respectively) Figure 3- 63: IQ versus Time measurement 3- 83 RSA3303A & RSA3308A User Manual... -
Page 206: Figure 3- -64: Power Variance Measurement 3
Observes signal power change over time. Figure 3- -64 shows an example. The Measurement main view displays power level versus time. Overview: Power vs. Time Subview: Spectrum Main view: Power vs. Time Figure 3- 64: Power variance measurement 3- 84 RSA3303A & RSA3308A User Manual... -
Page 207: Figure 3- -65: Frequency Measurement 3
Observes signal frequency change over time. Figure 3- -65 shows an example. Measurement The main view displays the frequency deviation from the center frequency versus time. Overview: Power vs. Time Subview: Spectrum Main view: Frequency deviation vs. Time Figure 3- 65: Frequency measurement 3- 85 RSA3303A & RSA3308A User Manual... -
Page 208: Ccdf Measurement
1. Measure the amplitude of the input signal over time. 2. Determine the amplitude distribution. 3. Obtain CCDF using the above formula. Amplitude CCDF Max. Crest factor Average Time Amplitude Amplitude (Average) Average Max. Figure 3- 66: CCDF calculation process 3- 86 RSA3303A & RSA3308A User Manual... - Page 209 MEAS SETUP key on the front panel. Single Acquisition. In single acquisition mode, you can set the total number of accumulated data points with TRACE/AVG → Maximum Points, ranging from 2048 to 10 3- 87 RSA3303A & RSA3308A User Manual...
- Page 210 CCDF Scale. Sets the full-scale of the horizontal axis of CCDF graph display when CCDF Auto Scaling is Off. Range: 1 to 100 dB. Threshold. Sets the threshold which defines the samples to be included in the CCDF calculation. Range: - -250 to 130 dBm. 3- 88 RSA3303A & RSA3308A User Manual...
-
Page 211: Figure 3- -67: Ccdf Single View 3
Gaussian line (blue) Reference line (red) Vertical line at the crest factor Measurement results CCDF values in G Peak amplitude the CCDF curve G Average amplitude G Crest factor Figure 3- 67: CCDF single view 3- 89 RSA3303A & RSA3308A User Manual... -
Page 212: Figure 3- -68: Ccdf Multi-View 3
Figure 3- -68 shows an example of the CCDF multi-view. Overview: Power versus Time Subview: Spectrum Maximum value (red line) Average (blue line) Peak amplitude Average amplitude Crest factor CCDF measurement results Main view: CCDF Figure 3- 68: CCDF multi-view 3- 90 RSA3303A & RSA3308A User Manual... -
Page 213: Pulse Measurements
S/A (Spectrum Analysis) mode. Channel Power page 3- -5 page 3- -11 page 3- -14 The frequency deviation measurement is based on the Frequency versus Time measurement in the Transient mode. Refer to page 3- -85. 3- 91 RSA3303A & RSA3308A User Manual... -
Page 214: Figure 3- -69: Definition Of Pulse Characteristics 3
You can set it by using Detection Threshold in the Meas Setup menu (refer to page 3- -98). Pulse-on The maximum peak Threshold Pulse-off Figure 3- 70: Definition of pulse-on/off 3- 92 RSA3303A & RSA3308A User Manual... - Page 215 By default, only the pulse-width measurement result is displayed on screen. 7. Press the MEAS SETUP key on the front panel to set the measurement parameters. Refer to page 3- -98 for the Meas Setup menu. 3- 93 RSA3303A & RSA3308A User Manual...
- Page 216 In this case, change the span. H Message: Too long repetition interval. Indicates that the number of data samples of a pulse repetition interval exceeds about 260,000. In this case, change the span. 3- 94 RSA3303A & RSA3308A User Manual...
- Page 217 View Results For... described below. 0 (zero) represents the most current pulse while larger negative numbers represent subsequent pulses. NOTE. The main view shows the measurement results for up to 1000 pulses (the pulse number of - -999 to 0). 3- 95 RSA3303A & RSA3308A User Manual...
-
Page 218: Figure 3- -71: Setting For View Results For 3
H Adaptive. Default. Adjusts the horizontal scale for each pulse to fit the pulse width to the subview. H Max. Adjusts the horizontal scale to fit the maximum pulse width in the analysis range to the subview. 3- 96 RSA3303A & RSA3308A User Manual... -
Page 219: Figure 3- -72: Setting The View Define Menu 3
Displayed Measurement... Figure 3- 72: Setting the View Define menu You can save the measurement table to a file (*.csv) by SAVE → Save Table. For file operations, refer to page 3- -237. 3- 97 RSA3303A & RSA3308A User Manual... - Page 220 Filter Bandwidth. Sets the bandwidth for the Gaussian measurement filter. Range: Span/10 to full span (default: 3.6 MHz) Filter Parameter. Sets the α/BT value for the Gaussian measurement filter. Range: 0.0001 to 1.0 (default: 0.35) 3- 98 RSA3303A & RSA3308A User Manual...
- Page 221 (bold lines in Figure 3- -73 on page 3- -100) indicating the measurement points. Also, the pulse detection threshold (MEAS SETUP → Detection Threshold) is shown with the green arrow. These guidelines can be turned on or off by VIEW: DEFINE → Guidelines. 3- 99 RSA3303A & RSA3308A User Manual...
-
Page 222: Figure 3- -73: Waveform Display In The Subview 3
The green arrow indicates the pulse detection threshold (MEAS SETUP → Detection Threshold) Pulse ripple Repetition interval On/Off ratio Pulse-pulse phase Channel power Duty cycle Frequency deviation Figure 3- 73: Waveform display in the subview 3- 100 RSA3303A & RSA3308A User Manual... -
Page 223: Signal Source Analysis (Option 21 Only)
H Random jitter H Periodic jitter Spurious Spurious Real-Time Spurious Frequency versus Time Frequency settling time For the “Real-Time” concept, refer to: Real-Time Analysis page 1- -3 Features of the Real-Time Mode page 3- -20 3- 101 RSA3303A & RSA3308A User Manual... - Page 224 1. Press the SYSTEM key on the front panel. 2. Press the Instrument Setup... side key. 3. Press the Angular Units side key to select degrees or radians. 3- 102 RSA3303A & RSA3308A User Manual...
- Page 225 NOTE. The integrated phase noise and random jitter will be calculated if the frequency range from Rj Start Offset Frequency to Rj Stop Offset Frequency is within the range from Minimum Offset Frequency to Maximum Offset Frequency. 3- 103 RSA3303A & RSA3308A User Manual...
-
Page 226: Figure 3- -74: Phase Noise Measurement Parameters 3
Random jitter measurement range Lower view Offset frequency Current trace Averaged trace Periodic jitter (displayed in green) by the Median filter (displayed in yellow) Max Pj Threshold Figure 3- 74: Phase noise measurement parameters 3- 104 RSA3303A & RSA3308A User Manual... -
Page 227: Figure 3- -75: Phase Noise Measurement 3
H Reference. When loaded as Trace 2, displays the waveform as the reference, which has been saved using Save Trace 1. H Off. Displays no waveform. 3- 105 RSA3303A & RSA3308A User Manual... -
Page 228: Table 3- 12: Phase Noise Measurement Frequency Band
1 kHz to 10 kHz 2.4414 Hz 10 kHz to 100 kHz 19.531 Hz 100 kHz to 1 MHz 195.31 Hz 1 MHz to 10 MHz 1.5625 kHz 10 MHz to 100 MHz 12.5 kHz 3- 106 RSA3303A & RSA3308A User Manual... -
Page 229: Table 3- 14: The Number Of Waveform Points
H On. Default. Carrier tracking is executed. The measurement is conducted with the carrier frequency always positioned centrally. H Off. Carrier tracking is not executed. The measurement is conducted with the central frequency that was set using FREQUENCY → Center Freq. 3- 107 RSA3303A & RSA3308A User Manual... -
Page 230: Figure 3- -76: Spurious Measurement 3
SAVE → Save Table. For file operations, refer to page 3- -237. Spurious detection range is displayed in blue. Spurious marker Measurement table (Up to 20 spurious signals displayed) Figure 3- 76: Spurious measurement 3- 108 RSA3303A & RSA3308A User Manual... - Page 231 C/N Settling Threshold. Enabled when C/N versus Time is displayed in the subview. Sets the threshold value for obtaining the phase noise settling time. Setting range: - -200 to 0 dBc/Hz (default: 0 dBc/Hz). 3- 109 RSA3303A & RSA3308A User Manual...
-
Page 232: Figure 3- -77: Real-Time Phase Noise Measurement Parameters 3
VIEW: DEFINE → Subview Content... The main view is the same as in the phase noise measurement (see Figure 3- -75 on page 3- -105), except that this main view is real time. 3- 110 RSA3303A & RSA3308A User Manual... -
Page 233: Figure 3- -78: Real-Time Phase Noise Measurement 3
See Figure 3- -79. The random jitter settling time is also indicated. H Integrated Phase Noise vs Time H C/N vs Time See Figure 3- -79. The C/N settling time is also indicated. 3- 111 RSA3303A & RSA3308A User Manual... -
Page 234: Figure 3- -79: Settling Time Displayed In The Subview 3
In this case, lower Carrier Threshold Level in the Meas Setup menu. H Message: Out of Span. In this case, decrease Carrier Bandwidth in the Meas Setup menu, or match the carrier frequency with the center frequency. 3- 112 RSA3303A & RSA3308A User Manual... - Page 235 Figure 3- -80 shows an example of the real-time spurious measurement. The main view is the same as the spurious measurement (refer to page 3- -107), except that this main view is real time. 3- 113 RSA3303A & RSA3308A User Manual...
-
Page 236: Figure 3- -80: Real-Time Spurious Measurement 3
This is like a spectrogram except that the color axis represents C/N in dBc/Hz. H C/N vs Offset Freq This is the same as the main view in the real-time phase noise measurement (see Figure 3- -78 on page 3- -111). 3- 114 RSA3303A & RSA3308A User Manual... -
Page 237: Figure 3- -81: Frequency Versus Time Measurement Parameters 3
Frequency settling time Frequency Freq Settling Mean value Mean value Freq Settling Threshold on the bottom on the top Threshold Settling time from trigger Trigger Time Figure 3- 81: Frequency versus Time measurement parameters 3- 115 RSA3303A & RSA3308A User Manual... -
Page 238: Figure 3- -82: Frequency Versus Time Measurement 3
Overview: Power versus Time Subview: Spectrum Main view: Frequency vs. Time Measurement result: Frequency settling time Figure 3- 82: Frequency versus Time measurement 3- 116 RSA3303A & RSA3308A User Manual... -
Page 239: Setting Frequency And Span
This section describes frequency and span, which are fundamental settings for observing the spectrum. These items are set using the general purpose knob and the numeric input keypad. You can also use the marker peak search function to set frequency. 3- 117 RSA3303A & RSA3308A User Manual... -
Page 240: Frequency And Span Setting Menu
Sets frequency or channel. Center Freq. Sets the center frequency. Numeric entry field. Range: 0 Hz to 3 GHz (RSA3303A), 0 Hz to 8 GHz (RSA3308A) Start Freq. Sets the minimum value (left edge) of the horizontal axis. Numeric entry field. -
Page 241: Figure 3- -83: Setting Frequency And Span 3
Start Freq. Same as Start Freq on page 3- -118. Stop Freq. Same as Stop Freq on page 3- -118. Span Start Freq Center Freq Stop Freq Figure 3- 83: Setting frequency and span 3- 119 RSA3303A & RSA3308A User Manual... -
Page 242: Using The Channel Table
FL: Forward link; RL: Reverse link; UL: Uplink; DL: Downlink 3. Press the Channel side key and select a channel number. For example, when selecting channel 10551 in the W-CDMA downlink table, the center frequency is automatically set to 2.1102 GHz. 3- 120 RSA3303A & RSA3308A User Manual... -
Page 243: Using The Marker And Peak Search
Refer to Setting the Analysis Range on page 3- -29 for details. In the overview of spectrogram or the subview of spectrum, you can use the Center Freq = Marker Freq side key as in the S/A mode described above. 3- 121 RSA3303A & RSA3308A User Manual... -
Page 244: Frequency Setting Range
DC to 20 MHz 50 Hz to 20 MHz (1-1.2-1.5-2-2.5-3-4-5-6-8 sequence) (RSA3303A) 15 MHz to 3 GHz (RSA3308A) 15 MHz to 3.5 GHz 50 H t 3 GH (1 1 2 1 5 2 2 5 3 4 5 6 8 50 Hz to 3 GHz (1-1.2-1.5-2-2.5-3-4-5-6-8 sequence) -
Page 245: Figure 3- -85: Relationship Between The Frequency And Span Settings 3
Center frequency A part of the trace is not displayed in these two settings: Not displayed Set span Center frequency Not displayed Set span Figure 3- 85: Relationship between the frequency and span settings 3- 123 RSA3303A & RSA3308A User Manual... -
Page 246: Vector Span
Physical frame (Scan data) Logical frame (Display data) Frame 0 Frame 1 Frame 2 Frame 0 Frame N Frame 0 Frame 1 Frame 2 Frame 1 Frame N Figure 3- 86: Vector mode and scalar mode 3- 124 RSA3303A & RSA3308A User Manual... -
Page 247: Setting Amplitude
Ref Level Auto Level RF Atten/Mixer Auto / RfAtt / Mixer RF Att ( RF Atten/Mixer = Rf Att) Mixer Level (RF Atten/Mixer = Mixer) Corrections... Amplitude Offset Figure 3- 87: Amplitude menu structure 3- 125 RSA3303A & RSA3308A User Manual... -
Page 248: Table 3- 16: Reference Level Setting Range
Auto Level will force the analyzer to acquire new data, which will overwrite the existing data. To scale the existing displayed waveform, do not use Auto Level. Instead, use the View: Scale menu. Ref Level Vertical Scale Figure 3- 88: Setting the amplitude 3- 126 RSA3303A & RSA3308A User Manual... -
Page 249: Table 3- 17: Rf Attenuation Level Setting
Use the default value in most cases. This level can be increased up to - -5 dBm when a high dynamic range is required for measurements such as the ACPR (Adjacent Channel Leakage Power Ratio) measurement. 3- 127 RSA3303A & RSA3308A User Manual... -
Page 250: Table 3- 19: Vertical Scale Setting Range
Use the Vertical Units side key to select the unit. 6. To apply amplitude correction, press the Corrections... side key to set the parameters. Refer to Amplitude Correction on page 3- -130 for details. 3- 128 RSA3303A & RSA3308A User Manual... -
Page 251: Over-Voltage Input
“A/D OVERFLOW” may be displayed for a moment and then turned off immediately. When a single high-level signal is applied under a setting using one physical frame in one scan, the same phenomenon may be observed. 3- 129 RSA3303A & RSA3308A User Manual... -
Page 252: Amplitude Correction
Corrected display Amplitude +20 dB - -60dBm correction Input signal - - 20 dB - - 80 dBm - -80dBm Preamplifier 1 GHz 1 GHz 1 GHz Figure 3- 90: The amplitude correction concept 3- 130 RSA3303A & RSA3308A User Manual... - Page 253 H Ampl Interpolation. Selects the vertical scale for interpolating correction data: Linear or dB. Load Table. Reads an amplitude correction table from a file. Save Table. Writes a created correction table to a file. 3- 131 RSA3303A & RSA3308A User Manual...
-
Page 254: Figure 3- -91: Amplitude Correction Example 3
= (Input waveform) - - (Correction value) Correction Display range 10 dB value Linear 5 dB interpolation 0 dB Frequency 10 MHz 100 MHz 1 GHz Correction range Figure 3- 91: Amplitude correction example 3- 132 RSA3303A & RSA3308A User Manual... - Page 255 H Do not use a space in a numeric value; however, you can space before and after “=”. Correct: 10M = 10 (A space is inserted before and after “=”.) Incorrect: 10 M=10 (A space is inserted between “10” and “M”.) 3- 133 RSA3303A & RSA3308A User Manual...
- Page 256 Repeat step c to enter the frequency and amplitude correction values for all points. e. Press the Done Editing Table side key. The input is accepted and a new row is added. 3- 134 RSA3303A & RSA3308A User Manual...
-
Page 257: Figure 3- -92: Amplitude Correction Data Input 3
H To delete a row, press the Delete Point side key. H To delete all data in the table, press the Clear Table side key. 7. Repeat steps 5 through 6 as needed. 3- 135 RSA3303A & RSA3308A User Manual... - Page 258 Press the Corrections... side key. c. Press the Save Table side key to specify the save file. Refer to page 3- -237 for file handling. For information about performing amplitude correction, refer to page 3- -138. 3- 136 RSA3303A & RSA3308A User Manual...
-
Page 259: Figure 3- -93: Amplitude Offset 3
AMPLITUDE → Corrections...→ Frequency Offset menu item. Correction range specified Correction range after the in the correction table frequency offset Frequency 1 GHz 2 GHz Frequency offset (1 GHz in this example) Figure 3- 94: Frequency offset 3- 137 RSA3303A & RSA3308A User Manual... -
Page 260: Figure 3- -95: Amplitude Correction Setup Display 3
The analyzer automatically saves the correction data in use when it is powered down. The data will be erased when you press these keys: H AMPLITUDE → Corrections...→ Edit Table...→ Clear Table H PRESET 3- 138 RSA3303A & RSA3308A User Manual... -
Page 261: Setting Timing Parameters
Analysis Length Analysis Offset Frequency Center Frequency Width DEMOD and Time modes Acquisition Length Acquisition History Spectrum Length Spectrum Offset Analysis Length Analysis Offset Output Trigger Indicator Figure 3- 96: Timing menu structure 3- 139 RSA3303A & RSA3308A User Manual... - Page 262 M is the number of frames in a block. One frame acquisition length is determined by span internally. For details, refer to Specifications in the RSA3303A Technical Reference. Acquisition History. Specifies the number of the block to display and analyze.
-
Page 263: Figure 3- -97: Timing Parameters 3
Acquisition Length. Same as in the Demod and Time modes. Spectrum Offset. Specifies the number of the frame in the spectrogram to display the spectrum. The latest frame is number zero. Older frames have larger negative numbers. 3- 141 RSA3303A & RSA3308A User Manual... -
Page 264: Figure 3- -98: Timing Parameters In The Zoom Mode 3
Frequency Width. Sets the frequency width of the analysis area. Trigger output point Frequency Analysis Offset Time Analysis area Analysis Length Frequency Width Frequency Center Figure 3- 98: Timing parameters in the zoom mode 3- 142 RSA3303A & RSA3308A User Manual... -
Page 265: Seamless Acquisition
When the span is set greater than 15 MHz, one display frame is reproduced from multiple acquired frames and the frame cycle becomes meaningless. Refer to Vector Span on page 3- -124 for details. 3- 143 RSA3303A & RSA3308A User Manual... - Page 266 Setting Timing Parameters 3- 144 RSA3303A & RSA3308A User Manual...
-
Page 267: Trigger
NOTE. The trigger functions vary according to the product serial numbers (the serial number is labeled on the bottom-right corner of the rear panel). The following descriptions are marked with the appropriate serial number if necessary. 3- 145 RSA3303A & RSA3308A User Manual... -
Page 268: Trigger Menu (S/N B020000 And Above)
Insert New Point Set All Points to Maximum Set All Points to Minimum Reset Mask to Default In / Out / In and Out / Out and In Figure 3- 101: Trigger menu structure 3- 146 RSA3303A & RSA3308A User Manual... -
Page 269: Table 3- 20: How To Acquire A Waveform
Press this key again to stop acquisition. Single Press RUN/STOP to acquire one waveform. Triggered Continuous Press RUN/STOP to acquire data every trigger event. Single Press RUN/STOP to acquire one waveform every trigger event. 3- 147 RSA3303A & RSA3308A User Manual... -
Page 270: Figure 3- -102: Trigger Position 3
For example, if you set the trigger position to 50%, the trigger occurs at the center of the block, as shown in Figure 3- -102. Range: 0 to 100% in 1% step. 1 block Time Position setting Trigger occurs Acquisition completed Figure 3- 102: Trigger position 3- 148 RSA3303A & RSA3308A User Manual... -
Page 271: Table 3- 21: Trigger Level Setting Range
Define Mask... Option 02 only. Creates a trigger mask when the trigger mode is set to Triggered and the source is set to Freq Mask. The trigger mask is created in the spectrum view. Refer to page 3- -163 for details on creating a trigger mask. 3- 149 RSA3303A & RSA3308A User Manual... -
Page 272: Figure 3- -104: Trigger Level And Slope 3
In and Out alternate at each block acquisition. Use the acquisition history control to view alternate In/Out blocks. Trigger level Trigger occurs Rise Fall Figure 3- 104: Trigger level and slope 3- 150 RSA3303A & RSA3308A User Manual... -
Page 273: Figure 3- -105: Acquiring And Displaying Data By Trigger And Repeat Modes 3
Triggered / Single Data acquisition Display Data acquisition Display … Time Press the Trigger Press the Trigger RUN/STOP key RUN/STOP key Figure 3- 105: Acquiring and displaying data by Trigger and Repeat modes 3- 151 RSA3303A & RSA3308A User Manual... - Page 274 Save Count Limit. Sets a limit on the number of times that data is saved. This setting is enabled when the above-mentioned Save Count is On. Setting range: 1 to 16383 (default: 100) 3- 152 RSA3303A & RSA3308A User Manual...
-
Page 275: Trigger Menu (S/N Below B020000 And J300100 And Above)
In / Out / In and Out / Out and In Source = External Slope... Rise / Fall / Rise and Fall / Fall and Rise Position Figure 3- 106: Trigger menu structure 3- 153 RSA3303A & RSA3308A User Manual... -
Page 276: Table 3- 22: How To Acquire A Waveform
Press this key again to stop acquisition. Single Press RUN/STOP to acquire one waveform. Triggered Continuous Press RUN/STOP to acquire data every trigger event. Single Press RUN/STOP to acquire one waveform every trigger event. 3- 154 RSA3303A & RSA3308A User Manual... -
Page 277: Table 3- 23: Trigger Level Setting Range
- - 40 to 0 dBfs in 1 dBfs steps (in time domain) For the external trigger, the trigger level is fixed internally. For specifications of the external trigger, refer to page A- -12. 3- 155 RSA3303A & RSA3308A User Manual... -
Page 278: Figure 3- -107: Trigger Level And Slope 3
H Out and In. The analyzer triggers with Out to acquire the first block, and In to acquire the second. In and Out alternate at each block acquisition. Use the acquisition history control to view alternate In/Out blocks. 3- 156 RSA3303A & RSA3308A User Manual... -
Page 279: Figure 3- -108: Trigger Position 3
For example, if you set the trigger position to 50%, the trigger occurs at the center of the block, as shown in Figure 3- -108. Range: 0 to 100% in 1% step. 1 block Time Position setting Trigger occurs Acquisition completed Figure 3- 108: Trigger position 3- 157 RSA3303A & RSA3308A User Manual... -
Page 280: Figure 3- -109: Acquiring And Displaying Data By Trigger And Repeat Modes 3
Triggered / Single Data acquisition Display Data acquisition Display … Time Press the Trigger Press the Trigger RUN/STOP key RUN/STOP key Figure 3- 109: Acquiring and displaying data by Trigger and Repeat modes 3- 158 RSA3303A & RSA3308A User Manual... - Page 281 Save Count Limit. Sets a limit on the number of times that data is saved. This setting is enabled when the above-mentioned Save Count is On. Setting range: 1 to 16383 (default: 100) 3- 159 RSA3303A & RSA3308A User Manual...
-
Page 282: If Trigger (S/N Below B020000 And J300100 And Above)
- -5 - -10 - -15 Amplitude (dB) - -20 - -25 - -30 - -35 - -40 Trigger level (%) Figure 3- 110: Trigger level vs. Amplitude (reference level = +3 dBm) 3- 160 RSA3303A & RSA3308A User Manual... -
Page 283: Figure 3- -111: Waveforms In Time Domain And In Frequency Domain 3
Figure B: Added waveform of 1 Hz, 3 Hz, and 5 Hz sine waves Amplitude 9 10 Frequency (Hz) Figure C: Spectrum of Figure B Figure 3- 111: Waveforms in time domain and in frequency domain 3- 161 RSA3303A & RSA3308A User Manual... -
Page 284: Figure 3- -112: If Trigger Detection Range 3
1 MHz of span activates the IF trigger even if no signal exceeds the trigger level within the range of 1 MHz of span. Trigger level 15 MHz (IF trigger detection range) 1 MHz span Figure 3- 112: IF trigger detection range 3- 162 RSA3303A & RSA3308A User Manual... -
Page 285: Creating A Trigger Mask (Option 02 Only)
(subview in the Demod and Time modes). The trigger occurs when the input signal exits or enters the area. Real Time S/A mode Trigger mask Demod and Time modes (upper screen) Trigger mask Figure 3- 113: Trigger mask 3- 163 RSA3303A & RSA3308A User Manual... -
Page 286: Figure 3- -114: Filling Operation For Creating A Mask 3
Reset Mask to Default. Displays the default mask. See Figure 3- -114. Set All Points to Maximum Set All Points to Minimum 60 dB Reset Mask to Default 60 dB Figure 3- 114: Filling operation for creating a mask 3- 164 RSA3303A & RSA3308A User Manual... -
Page 287: Figure 3- -115: Example Mask 3
Press the Show Views side key and select Single. 4. Press the TRIG key on the front panel. 5. Press the Define Mask... side key. The default setting is for the whole area to fill with blue on the graticule. 3- 165 RSA3303A & RSA3308A User Manual... -
Page 288: Figure 3- -116: Default Mask 3
Press the Set Selected Point X side key and set the horizontal position of Point A to two divisions from the left edge (see Figure 3- -117). Figure 3- 117: Changing the position of Point A 3- 166 RSA3303A & RSA3308A User Manual... -
Page 289: Figure 3- -118: Changing The Position Of Point B 3
Press the Set Selected Point Y side key and set the vertical position of Point C to four divisions from the top edge (see Figure 3- -119). Point C Figure 3- 119: Adding Point C The trigger mask is stored in the internal memory. 3- 167 RSA3303A & RSA3308A User Manual... - Page 290 S/A: Real Time S/A, DEMOD: Analog Demod, Digital Demod, TIME: Transient, and CCDF. When you press the PRESET key on the front panel, the instrument settings are reset to the default only for the currently active mode. 3- 168 RSA3303A & RSA3308A User Manual...
-
Page 291: Trigger Point Indicator
To connect the trigger output to other instruments, use the TRIG OUT connector on the rear panel (see Rear Panel on page 2- -4). The output specification is: H level >2.0 V, L level <0.4V, and output current <1 mA. 3- 169 RSA3303A & RSA3308A User Manual... -
Page 292: Synchronous Operation With External Instruments
By synchronizing two or more analyzers, you can acquire multiple signals in different span keeping the time correlation. Figure 3- -121 shows an example of two RSA3303A/RSA3308A analyzers performing IMT2000 signal analysis. One analyzer is used as a master to acquire an uplink (or forward link) signal and the other is used as a slave to acquire a downlink (or reverse link) signal. -
Page 293: Fft And Rbw
S FFT start point S Roll-off ratio * FFT points is normally set automatically with the RBW setting. RBW is normally set automatically with the span setting. Figure 3- 122: FFT and RBW process 3- 171 RSA3303A & RSA3308A User Manual... -
Page 294: Rbw/Fft Menu
FFT Window... side keys. The result of FFT processing is displayed as is, without RBW processing. When RBW/FFT is set to Man. RBW. Sets RBW when Man is selected in RBW/FFT. Range: 2 kHz to 2 MHz (the default is 80 kHz) 3- 172 RSA3303A & RSA3308A User Manual... -
Page 295: Figure 3- -124: Process Flow When Rbw/Fft = Fft 3
(see Figure 3- -124). Frequency domain data Time domain data after A/D conversion Measurement and display When RBW/FFT is set to FFT Figure 3- 124: Process flow when RBW/FFT = FFT 3- 173 RSA3303A & RSA3308A User Manual... -
Page 296: Figure 3- -125: Fft Overlap 3
For the window type, refer to Table 3- -25 on page 3- -178. The default is Blackman-Harris 4B. Time-domain data Time Frame 1 Frame 2 Frame 3 S S S Start Point Overlap 1024 points Figure 3- 125: FFT overlap 3- 174 RSA3303A & RSA3308A User Manual... -
Page 297: Fft Points
Increasing the number of FFT points causes the noise floor to go down and occasionally display spurious signals. Spurious signal Figure 3- 126: Generating spurious signals by increasing the number of FFT points 3- 175 RSA3303A & RSA3308A User Manual... -
Page 298: Fft Window
Hanning. different. Blackman-Harris H Suitable for amplitude measurement but not H Signal that has one-frequency ruling when a high suitable for frequency measurement. order harmonic is detected. 3- 176 RSA3303A & RSA3308A User Manual... -
Page 299: Figure 3- -127: Windowing Process Of Time Domain Data 3
For ordinal measurements, select the window capable of separating the desired frequency component. Such a window maximizes the accuracy of measuring amplitude levels and minimizes leakage error while separating each frequency component. 3- 177 RSA3303A & RSA3308A User Manual... -
Page 300: Table 3- 25: Fft Window And Bandpass Filter
--- 60 --- 80 --- 100 --- 120 Blackman-Harris 0 dB 4 sample B type --- 20 (Default) --- 40 1.898 - - 92 dB 2.004353 --- 60 --- 80 --- 100 --- 120 3- 178 RSA3303A & RSA3308A User Manual... - Page 301 0 dB --- 20 1.15 - - 21 dB 1.197677 --- 40 --- 60 --- 80 Sine Lobe 0 dB --- 20 1.186 - - 23 dB 1.233702 --- 40 --- 60 --- 80 3- 179 RSA3303A & RSA3308A User Manual...
- Page 302 Flat Top 0 dB --- 20 --- 40 3.182 - - 51 dB 3.196927 --- 60 --- 80 --- 100 Rectangular 0 dB --- 20 0.886 - - 13 dB --- 40 --- 60 3- 180 RSA3303A & RSA3308A User Manual...
-
Page 303: Trace Comparison Display And Average Function
Figure 3- 128: Comparison display of Trace 1 and 2 The main topics in this section are: H Trace/Avg menu H Displaying Trace 1 and 2 H Averaging waveform H Saving/Loading waveform data H Trace compression display 3- 181 RSA3303A & RSA3308A User Manual... -
Page 304: Trace/Avg Menu
Select Trace. Selects the trace to control: trace 1 or 2. Trace 1/2. Controls the selected trace. H On. Turns on the selected trace. H Freeze. Freezes display of the selected trace. H Off. Turns off the selected trace. 3- 182 RSA3303A & RSA3308A User Manual... -
Page 305: Table 3- 26: Averaging Method
H Min. Displays the minimum value of data corresponding to each pixel. The analyzer performs RMS detection using the linear A/D converter regardless of the Display Detection setting. Refer to page 3- -188 for details on compression of waveform display data. 3- 183 RSA3303A & RSA3308A User Manual... -
Page 306: Displaying Trace 1 And 2
4. Press the Trace 1 (or 2) Type... side key to select the trace type: Normal, Average, MaxHold or MinHold (refer to Trace 1/2 Type on page 3- -183). 5. Repeat steps 2 through 4 for Trace 1 and 2. 3- 184 RSA3303A & RSA3308A User Manual... -
Page 307: Averaging The Waveform
, Min Hold. Displays only the minimum value at each data point. X(p) = x(p) for : n = 1 for : n ≧ 2 X(p) = min(X(p) x(p) n–1 , 3- 185 RSA3303A & RSA3308A User Manual... -
Page 308: Figure 3- -130: Displaying An Averaged Waveform 3
Selects the display method. Trace 1 (or 2) Type Selects the trace type (Average here). Number of Averages Sets how many traces are accumulated. Reset Average Restart averaging. Figure 3- 130: Displaying an averaged waveform 3- 186 RSA3303A & RSA3308A User Manual... -
Page 309: Figure 3- -131: Compared Display 3
Max Hold waveform. Trace 2: averaged waveform (This figure shows an example of Max Hold) Trace 1: ordinary spectrum waveform (This figure shows an example of a digitally- modulated signal) Figure 3- 131: Compared display 3- 187 RSA3303A & RSA3308A User Manual... -
Page 310: Saving/Loading Waveform Data
Table 3- -27. Table 3- 27: Number of bins (FFT points: 1024) Span Number of bins 2 MHz or less 5 MHz 10 MHz 15 MHz 20 MHz (Baseband only) 3- 188 RSA3303A & RSA3308A User Manual... -
Page 311: Figure 3- -132: Relationships Between Frame, Bin, And Pixel 3
3. Press the Display Detection... side key and select Max, Min, or Max-Min. NOTE. Display Detection determines how to deal with data between spectrum display points. The analyzer performs RMS detection using the linear A/D converter regardless of the Display Detection setting. 3- 189 RSA3303A & RSA3308A User Manual... -
Page 312: Figure 3- -133: Compression Method For Displaying The Waveform . . 3
Pixel data on screen Max-Min Acquired data points Acquires the minimum and maximum values of data points corresponding to each pixel. Pixel data on screen Figure 3- 133: Compression method for displaying the waveform 3- 190 RSA3303A & RSA3308A User Manual... -
Page 313: Setting Views
H Symbol table H Eye diagram H AM/AM view H AM/PM view H PDF view H Noisogram view For information on views specific to the other optional analyses, refer to each user manual. 3- 191 RSA3303A & RSA3308A User Manual... -
Page 314: View Menu
Sets the horizontal and vertical axes for the view selected with the SELECT key. VIEW: SELECT VIEW: DEFINE selects a view defines the view VIEW: SCALE scales the view Figure 3- 134: View keys 3- 192 RSA3303A & RSA3308A User Manual... -
Page 315: Basic Procedure
Press the VIEW: DEFINE key. b. Press the Show Views side key to select Multi. Refer to page 3- -33 for information about changing the overview and the subview using the Define menu. 3- 193 RSA3303A & RSA3308A User Manual... -
Page 316: Spectrum View Setting
Vertical Stop. Sets the maximum value (top) of the vertical axis. Full Scale. Sets the scale of the vertical axis to the default full-scale value. Vertical Stop Vertical Scale Horizontal Scale Horizontal Start Figure 3- 135: Setting the scale in spectrum view 3- 194 RSA3303A & RSA3308A User Manual... -
Page 317: Spectrogram View Setting
Step to Analysis Window. Vertical Start is automatically set so that the frame analyzed and displayed in the main view appears on the spectrogram. Step to Trigger. Vertical Start is automatically set so that the frame at the trigger position appears on the spectrogram. 3- 195 RSA3303A & RSA3308A User Manual... -
Page 318: Figure 3- -136: Scale And Format Settings In Spectrogram View 3
Setting Views Color Stop Color Scale Vertical Size Vertical Start Horizontal Scale Horizontal Start Figure 3- 136: Scale and format settings in spectrogram view 3- 196 RSA3303A & RSA3308A User Manual... -
Page 319: Time Domain View Setting
Available when the vertical axis represents: AM modulation factor FM frequency deviation PM phase deviation IQ voltage. Full Scale. Sets the scale of the vertical axis to the default full-scale value. 3- 197 RSA3303A & RSA3308A User Manual... -
Page 320: Figure 3- -137: Setting The Scale In Time Domain View 3
Vertical axis: AM modulation factor, FM frequency deviation, PM phase deviation, or IQ level (AM modulation factor shown) Vertical Offset Vertical Scale Horizontal Scale Horizontal Start Figure 3- 137: Setting the scale in time domain view 3- 198 RSA3303A & RSA3308A User Manual... -
Page 321: Ccdf View Setting
Full Scale. Sets the scale of the vertical axis to the default full-scale value. Sub Grid. Time mode only. Determines whether to display the sub-grid. Vertical Stop Vertical Start Horizontal Scale Horizontal Start Figure 3- 138: Setting the scale in CCDF view 3- 199 RSA3303A & RSA3308A User Manual... -
Page 322: Constellation View Setting (Option 21 Only)
H Constellation. Selects the constellation display. It is the same as the vector display, except that only symbols of the measurement signal are indicated in red, and the locus between symbols is not displayed. Vector display Constellation display Figure 3- 139: Vector and constellation displays 3- 200 RSA3303A & RSA3308A User Manual... -
Page 323: Evm View Setting (Option 21 Only)
Vertical axis: EVM (An example of magnitude error below) Vertical Vertical Vertical Scale Scale Offset Vertical Start Horizontal Scale Horizontal Scale Horizontal Start Horizontal Start Figure 3- 140: Setting the scale in EVM view 3- 201 RSA3303A & RSA3308A User Manual... -
Page 324: Figure 3- -141: Evm, Magnitude And Phase Error Displays 3
Magnitude error display Phase error display Figure 3- 141: EVM, magnitude and phase error displays You can select degree or radian for the angular unit by pressing SYSTEM → Instrument Setup...→ Angular Units. 3- 202 RSA3303A & RSA3308A User Manual... -
Page 325: Figure 3- -142: Constellation View And Error Vectors In 1/4Π Qpsk . 3
(Phase Error) θ +3/4π movement (10) - - 3/4π movement (11) - - 1/4π movement (01) +1/4π movement (00) Assumed position before movement Figure 3- 142: Constellation view and error vectors in 1/4π QPSK 3- 203 RSA3303A & RSA3308A User Manual... -
Page 326: Symbol Table Setting (Option 21 Only)
You can display this diagram in the eye diagram analysis in the digital modulation analysis (refer to page 3- -54). 3- 204 RSA3303A & RSA3308A User Manual... -
Page 327: Figure 3- -144: Eye Diagram View 3
Eye Length. Sets the number of symbols displayed on the horizontal axis. The time required for movement between symbols is defined as 1 (one). Range: 1 to 16 (the default is 2) Trellis Figure 3- 144: Eye diagram view 3- 205 RSA3303A & RSA3308A User Manual... -
Page 328: Am/Am View Setting (Option 21 Only)
Vertical Start. Shows the minimum value (bottom) of the vertical axis (not settable). Equal to the Horizontal Start value. Vector display Dot display Vertical Start Horizontal Start Figure 3- 145: Vector and dot displays for AM/AM view 3- 206 RSA3303A & RSA3308A User Manual... -
Page 329: Am/Pm View Setting (Option 21 Only)
Vertical Scale. Sets the vertical full-scale value to expand the graph vertically. Range: The initial maximum value × 0.05 to the maximum value Vector display Dot display Vertical Scale Horizontal Start Figure 3- 146: Vector and dot displays for AM/PM view 3- 207 RSA3303A & RSA3308A User Manual... -
Page 330: Pdf View Setting (Option 21 Only)
You can change the scale of the horizontal and vertical axes within these full-scale values. Vertical Stop Vertical Scale Horizontal Scale Horizontal Start Figure 3- 147: Setting the scale in PDF view 3- 208 RSA3303A & RSA3308A User Manual... -
Page 331: Noisogram View Setting (Option 21 Only)
Color Stop. Sets the maximum value (top) of the color axis. Range: [70 - - (Color Scale)] to 70 dBc/Hz. Full Scale. Sets the maximum value of the color axis to 0 and the height to 100 dBc/Hz. 3- 209 RSA3303A & RSA3308A User Manual... -
Page 332: Figure 3- -148: Setting The Scale In Noisogram View 3
Setting Views Color Stop Vertical Size Color Scale Vertical Start Horizontal Start Horizontal Stop Figure 3- 148: Setting the scale in noisogram view 3- 210 RSA3303A & RSA3308A User Manual... -
Page 333: Display Line
NOTE. The display line is available only in the S/A (spectrum analysis) mode. Vertical line Horizontal line Figure 3- 149: Display line This section provides these two topics: H Display Line Operation (Other than Real Time S/A) H Multi Display Lines (Real Time S/A Only) 3- 211 RSA3303A & RSA3308A User Manual... -
Page 334: Display Line Operation (Other Than Real Time S/A)
Line 1. Sets the position of the first line. Line 2. Sets the position of the second line. Delta. Sets the difference between the first line and the second: (Value of Line 2) - - (Value of Line 1) 3- 212 RSA3303A & RSA3308A User Manual... -
Page 335: Figure 3- -151: Two Horizontal Lines 3
(value of Delta) = (value of line 2) - - (value of line 1) H To turn off the horizontal line: Press the Number Of Line side key to select None. Values at line positions Horizontal line (Dual) Figure 3- 151: Two horizontal lines 3- 213 RSA3303A & RSA3308A User Manual... -
Page 336: Figure 3- -152: Two Horizontal And Two Vertical Lines 3
(value of Delta) = (value of line 2) - - (value of line 1) H To turn off the vertical line: Press the Number Of Line side key to select None. Figure 3- 152: Two horizontal and two vertical lines 3- 214 RSA3303A & RSA3308A User Manual... -
Page 337: Multi Display Lines (Real Time S/A Only)
Amplitude reference line (red) Amplitude display lines (blue) Lines readout Time display lines (blue) Time reference line (red) Frequency reference line (red) Frequency display lines (blue) Figure 3- 153: Multi display lines (Real Time S/A mode) 3- 215 RSA3303A & RSA3308A User Manual... -
Page 338: Figure 3- -154: Lines Menu Structure (Real Time S/A) 3
Time Line Time Line Offset Time Line Interval Frequency Line Off / On Frequency Line Offset Frequency Line Interval View Lines Readout Off / On Figure 3- 154: Lines menu structure (Real Time S/A) 3- 216 RSA3303A & RSA3308A User Manual... - Page 339 Range: 0 second minimum. The maximum value depends on acquired data quantity. The other menu items (Frequency Line, Frequency Line Offset, Frequency Line Interval, and View Lines Readout) are the same as the spectrum view. 3- 217 RSA3303A & RSA3308A User Manual...
- Page 340 Display Line 3- 218 RSA3303A & RSA3308A User Manual...
-
Page 341: Marker Operation And Peak Search
Two markers (called Marker 1 and 2) indicated by “V” and “Z” move on a waveform. “V” and “Z” represent an active and a fixed marker, respectively. They are used to measure relative values. 3- 219 RSA3303A & RSA3308A User Manual... -
Page 342: Markers Menu
Demod and Time (Transient) modes only Peak Search Hor. Threshold Reference Cursor to Trigger Reference Cursor to Trigger Output Time (CCDF) mode only Peak Search Hor. Threshold Figure 3- 156: Markers menu structure 3- 220 RSA3303A & RSA3308A User Manual... - Page 343 The definition of “next” can be set in the Marker Setup menu, using Peak Search Freq. Threshold or Hor. Threshold. Refer to Setting the Minimum Jump of the Marker on page 3- -229. 3- 221 RSA3303A & RSA3308A User Manual...
- Page 344 Reference Cursor to Trigger Output. Demod and Time modes only. Enables the reference cursor at the same position as the trigger output in the overview. 3- 222 RSA3303A & RSA3308A User Manual...
-
Page 345: Using Markers
Marker 1 numeric keypad. Markers Enables one, two, or no markers. Single is selected, enabling marker 1 only. Figure 3- 157: Measurement with a single marker 3- 223 RSA3303A & RSA3308A User Manual... -
Page 346: Figure 3- -158: Using The Delta Marker To Take Measurements 3
= (Marker 1 readout) - - (Marker 2 readout) Select Marker Selects the active marker. Markers Marker 1 Here selects Delta to enable Marker 1 and 2. Marker 2 Figure 3- 158: Using the delta marker to take measurements 3- 224 RSA3303A & RSA3308A User Manual... -
Page 347: Figure 3- -159: Measurement With The Reference Cursor 3
Marker 1 Marker 2 Reference Cursor to Marker X Enables the reference cursor. Reference Cursor Off Turns off the reference cursor. Reference cursor Figure 3- 159: Measurement with the reference cursor 3- 225 RSA3303A & RSA3308A User Manual... -
Page 348: Figure 3- -160: Changing The Trace 3
The marker moves to another trace Assign Marker X to Trace with the same horizontal position. Selects the trace to place the marker. Trace 1 Trace 2 Figure 3- 160: Changing the Trace 3- 226 RSA3303A & RSA3308A User Manual... -
Page 349: Figure 3- -161: Interlocked Markers 3
Conversely, if you move the marker on the spectrogram to the left, the marker on the spectrum moves to the left. Markers interlock Figure 3- 161: Interlocked markers 3- 227 RSA3303A & RSA3308A User Manual... -
Page 350: Peak Search
Moves the marker higher in amplitude to Moves the marker lower in amplitude to the next signal. the next signal. Figure 3- 162: Functions of the peak search keys 3- 228 RSA3303A & RSA3308A User Manual... -
Page 351: Figure 3- -163: Setting The Minimum Frequency Jump 3
3. Press either of the following side keys depending on the measurement mode and then set the minimum jump: H Peak Search Freq. Threshold in the S/A mode H Peak Search Hor. Threshold in the Demod and Time modes 3- 229 RSA3303A & RSA3308A User Manual... - Page 352 Marker Operation and Peak Search 3- 230 RSA3303A & RSA3308A User Manual...
-
Page 353: Using The Online Help
H View Front Panel Button Help. Provides descriptions of the front-panel keys. H View Online User Manual. Displays the analyzer user manual, formatted for online use. H View Online Programmer Manual. Displays the analyzer programmer manual, formatted for online use. 3- 231 RSA3303A & RSA3308A User Manual... -
Page 354: Figure 3- -164: Online Help For The Front Panel Key 3
Manual: Using the front panel keys listed in Table 3- -28, select the topic from the contents window on screen (see Figure 3- -165). The key functions are different in the contents (left) window than in the descrip- tions (right) window. 3- 232 RSA3303A & RSA3308A User Manual... -
Page 355: Table 3- 28: Front Panel Keys For Online Help
ENTER Accepts the selection and displays the corresponding content. Select the topic from the contents. Figure 3- 165: Online user manual 4. To exit the help system, press the Cancel-Back (top) side key. 3- 233 RSA3303A & RSA3308A User Manual... -
Page 356: Using A Mouse And Keyboard
Refer to Side-Panel Interface on page 2- -5 on connecting a USB mouse and keyboard to the analyzer. Enter a search word with the keyboard Figure 3- 166: Word search using the keyboard 3- 234 RSA3303A & RSA3308A User Manual... -
Page 357: Selecting Input Source
Calibrating Center Offset on page 1- -24.) H Cal. Uses the internal 50 MHz calibration signal as the signal source. Refer to Functional Check on page 1- -14 for using the cal signal to check the system performance. 3- 235 RSA3303A & RSA3308A User Manual... - Page 358 H Ext. Uses the 10 MHz sine wave of - -10 to +6 dBm from the REF IN connector on the rear panel when you want to synchronize the analyzer with other instrument(s). The reference clock is available from the REF OUT connector on the rear panel. 3- 236 RSA3303A & RSA3308A User Manual...
-
Page 359: File Operations
A file used in the S/A (Spectrum Analysis) mode to save an amplitude correction table. The data in this file is loaded when the amplitude correction is performed. Refer to page 3- -130 for the amplitude correction. 3- 237 RSA3303A & RSA3308A User Manual... -
Page 360: Load/Save Menu
IQData for an IQ data file All Blocks / Current Block / Current Area Save Data... Trace for a trace file Corr for a correction file Bitmap for a bitmap file Figure 3- 168: Load/Save menu structure 3- 238 RSA3303A & RSA3308A User Manual... - Page 361 Save Trace 1. Saves data for Trace 1 of a graph. Save Trace 2. Saves data for Trace 2 of a graph. Save Correction. Saves a correction table of Frequency/Amplitude pairs used for adjusting amplitude values. 3- 239 RSA3303A & RSA3308A User Manual...
-
Page 362: Saving And Loading Files
All Blocks Data of all blocks Current Block Data of the block currently displayed Current Area Data currently shown in the main view 3. To enter a new file name, skip to step 5. 3- 240 RSA3303A & RSA3308A User Manual... -
Page 363: Figure 3- -169: Save To The Preset File (Lower Right Of The Screen) 3
TraceA, TraceB, TraceC Correction (.cor) CorrA, CorrB, CorrC The data is saved to the file with that name in the C:\My Documents folder. The file extension is automatically added according to the file type. 3- 241 RSA3303A & RSA3308A User Manual... -
Page 364: Figure 3- -170: Selecting The Folder 3
After selecting the folder, press the Done side key to accept it. The list of files in the selected folder appears, displaying only files with the same extension as the file to be stored. 3- 242 RSA3303A & RSA3308A User Manual... -
Page 365: Figure 3- -171: Save To File Menu 3
The data is saved to the specified file. Filename Enters a file name. Save File Now Stores the data to the specified file. Folder... Shows the selected directory (“C:\My Documents” here). Figure 3- 171: Save to File menu 3- 243 RSA3303A & RSA3308A User Manual... -
Page 366: Figure 3- -172: Load From The Preset File (Lower Right Of The Screen) . 3
“File name not found” appears on the bottom left of the screen. Loads data from the preset file (trace file in this example) Figure 3- 172: Load from the preset file (lower right of the screen) 3- 244 RSA3303A & RSA3308A User Manual... -
Page 367: Figure 3- -173: Load From File Menu 3
Therefore, when you save all the blocks to a file and then load the file, the waveform does not appear at first. If you have acquired multiple blocks, select an old block to display the waveform. 3- 245 RSA3303A & RSA3308A User Manual... -
Page 368: Entering A File Name
Deletes a character just before the cursor. These keys are not available for entering a file name. Enter/Next key Accepts the input character. CAPS LOCK key (+ and - - are not available) Figure 3- 174: Alphanumeric keypad 3- 246 RSA3303A & RSA3308A User Manual... - Page 369 If you want to restart from the beginning, press the Cancel - Back (top) side key. You can also move the insertion cursor using the general purpose knob or up/down keys. 3- 247 RSA3303A & RSA3308A User Manual...
-
Page 370: Deleting A File
You can make or delete a directory using Windows, but not using the analyzer menu. Refer to page 2- -26 for information about using Windows on the analyzer. Refer to Windows documentation for additional information about operating Windows. 3- 248 RSA3303A & RSA3308A User Manual... -
Page 371: File Format
If you examine the file size and find the date and time at the end, use them in place of DateTime in the file header. Refer to DateTime on page 3- -252 for the format of date and time. 3- 249 RSA3303A & RSA3308A User Manual... - Page 372 In the preceding example: Number of bytes of the file header = 1 + 4 + 0416 = 421 The number of bytes is therefore 421. Data starts from the 422 byte. 3- 250 RSA3303A & RSA3308A User Manual...
-
Page 373: Figure 3- -176: Adding Dummy Frames 3
It is necessary only when the analyzer reloads the data. MemoryMode. Shows the memory mode that was set when the analyzer acquired the data. It is necessary only when the analyzer reloads the data. 3- 251 RSA3303A & RSA3308A User Manual... - Page 374 100 MHz. MultiAddr. Shows the last frame address in the multi-frame mode. The range is 0 to MultiFrames - -1. MultiFrames - -1 indicates that the data ends just at the end of scans. 3- 252 RSA3303A & RSA3308A User Manual...
-
Page 375: Figure 3- -177: Data Block 3
{ short reserved1; short validA; short validP; short validI; short validQ; short bins; short reserved2; short triggered; short overLoad; short lastFrame; unsigned long ticks; Descriptions of the frame header items follow. 3- 253 RSA3303A & RSA3308A User Manual... -
Page 376: Table 3- -32: Combinations Of Valida, P, I And Q 3
H 0. Indicates that the frame is not the last in the block. H - -1. Indicates that the frame is the last in the block. unsigned long ticks. Shows a time stamp using UnitPeriod in the file header (not FramePeriod) as a unit time. 3- 254 RSA3303A & RSA3308A User Manual... - Page 377 = i - - IOffset q = q - - QOffset IQScale = Sqrt(Power(10, (GainOffset + MaxInputLevel + LevelOffset) / 10) / 20 * 2) I = i * IQScale [V] Q = q * IQScale [V] 3- 255 RSA3303A & RSA3308A User Manual...
- Page 378 Definition of Bin. The bin is defined by the following structure: struct apBin_st { short a; short p; Definition of Frame. The frame is defined by the following structure: struct apFrame1024_st { struct apBin_st ap[1024]; 3- 256 RSA3303A & RSA3308A User Manual...
-
Page 379: Trace File Format
- - 96.7588947616 - - 98.5946571418 - - 101.68696219 - - 97.8503895777 Data block - - 100.806522438 - - 100.274828469 - - 95.8906131833 - - 97.9340093534 - - 101.366985559 Figure 3- 179: Trace file example 3- 257 RSA3303A & RSA3308A User Manual... - Page 380 RBW (Resolution Bandwidth) when setting RBW parameters. YMiddleUnit. Represents the unit of the vertical axis scale. Specify dB when YUnit is dBm. For all other values of YUnit, the YUnit value is used. 3- 258 RSA3303A & RSA3308A User Manual...
-
Page 381: Figure 3- -180: Data Block 3
0. Mask Value. The mask value represents whether to display the data. H 0. Indicates that the data is displayed. H - -1. Indicates that the data is not displayed. 3- 259 RSA3303A & RSA3308A User Manual... - Page 382 File Format 3- 260 RSA3303A & RSA3308A User Manual...
-
Page 383: Screen Copy 3
For file operations, refer to page 3- -237. Background color. Selects the background color for printing. H Black. Prints the background of screen in black. H White. Reverses the background of screen to white. Printer... Selects a destination printer. 3- 261 RSA3303A & RSA3308A User Manual... -
Page 384: Printing A Screen Copy 3
4. Press the Printer... side key and select a destination printer. 5. Press the Print now side key to start printing. If the printer driver displays a message during printing, follow the instructions. 3- 262 RSA3303A & RSA3308A User Manual... -
Page 385: Creating A File 3
.BMP is automatically assigned. When you have finished entering the name, press the Save File Now side key to store the copy in the file. After the screen copy is saved in the file, the screen returns to the original waveform display. 3- 263 RSA3303A & RSA3308A User Manual... - Page 386 Screen Copy 3- 264 RSA3303A & RSA3308A User Manual...
- Page 387 Appendices...
-
Page 389: Appendix A: Specifications
This appendix lists the electrical, physical, and environmental characteristics of the analyzer, and specifies the performance requirements for those characteris- tics. The specifications are common to RSA3303A and RSA3308A, unless otherwise noted. Unless otherwise stated, the following tables of electrical characteristics and features apply to the analyzer after a 20 minute warm-up period (within the environmental limits) and after all calibration procedures have been carried out. -
Page 390: Electrical Characteristics
2 × 10 (within one year after calibration) Reference output level >0 dBm External reference input 10 MHz, - - 10 to +6 dBm, Spurious level <- - 80 dBc within 100 kHz offset A- 2 RSA3303A & RSA3308A User Manual... - Page 391 - - 108 dBc/Hz 20 kHz - - 108 dBc/Hz 30 kHz - - 115 dBc/Hz 100 kHz - - 135 dBc/Hz 1 MHz - - 138 dBc/Hz 5 MHz - - 138 dBc/Hz 7 MHz A- 3 RSA3303A & RSA3308A User Manual...
- Page 392 +30 dBm (RF, RF1 to 3, RF attenuation≥10 dB) Input attenuator RF/Baseband attenuator 0 to 50 dB (2 dB step in RF/RF1/Baseband; 10 dB step in RF2/RF3) I/Q attenuator 0 to 30 dB (10 dB step) A- 4 RSA3303A & RSA3308A User Manual...
- Page 393 3rd order intermodulation distortion (Reference level = +5 dBm, RF attenuation = Adjusted, Total signal power = - - 7 dBm) Center frequency = 2 GHz - - 74 dBc 100 MHz to 3 GHz - - 74 dBc 3 GHz to 8 GHz (RSA3308A only) - - 72 dBc A- 5 RSA3303A & RSA3308A User Manual...
- Page 394 Residual response (Reference level = - - 30 dBm, RBW = 100 kHz) Baseband, 1 to 20 MHz - - 93 dBm (Span = 20 MHz) RF, 0.5 to 3 GHz (RSA3303A) - - 90 dBm (Span = 2.5 GHz) RF1, 0.5 to 3.5 GHz (RSA3308A) - - 90 dBm (Span = 3 GHz) RF2, 3.5 to 6.5 GHz (RSA3308A)
- Page 395 10 kHz span 16 ksps 5 kHz span 8 ksps 2 kHz span 3.2 ksps 1 kHz span 1.6 ksps 500 Hz span 800 sps 200 Hz span 320 sps 100 Hz span 160 sps A- 7 RSA3303A & RSA3308A User Manual...
- Page 396 GMSK, GFSK, ASK and FSK Measurement filter Root cosine Reference filter Cosine, Gauss Filter parameter α/BT: 0.0001 to 1, 0.0001 step Maximum symbol rate 12.8 Msps Standard setup PDC, PHS, NADC, TETRA, GSM, CDPD, and Bluetooth A- 8 RSA3303A & RSA3308A User Manual...
- Page 397 Center frequency = 3 GHz 0.7% 100 kHz 0.7% 1 MHz 1.5% 4 MHz 2.9% 10 MHz Center frequency = 5 GHz 0.7% 100 kHz (RSA3308A only) 0.7% 1 MHz 1.5% 4 MHz 3.0% 10 MHz A- 9 RSA3303A & RSA3308A User Manual...
- Page 398 ±2% (- - 10 dBfs input at center, 10 to 60% modulation depth) PM demodulation ±3° (- - 10 dBfs input at center) FM demodulation ±1% of span (- - 10 dBfs input at center) A- 10 RSA3303A & RSA3308A User Manual...
- Page 399 10 kHz span 10 Hz 5 kHz span 5 Hz 2 kHz span 2 Hz 1 kHz span 1 Hz 500 Hz span 1 Hz 200 Hz span 1 Hz 100 Hz span 1 Hz A- 11 RSA3303A & RSA3308A User Manual...
- Page 400 Mask resolution 1 bin Trigger level 0 to - - 60 dBfs Real-time event detection bandwidth 5 MHz (1024 point FFT, 50% overlapping) Time domain Trigger level 0 to - - 40 dBfs A- 12 RSA3303A & RSA3308A User Manual...
- Page 401 Number of views 1, 2, 3, or 4 Number of display traces Size 213 mm (8.4 in) Resolution 800 × 600 pixels Color Maximum 256 colors Display detector Positive peak, Negative peak, and Positive-Negative peak A- 13 RSA3303A & RSA3308A User Manual...
- Page 402 Storage medium Hard disk ≥20 GB 2.5 inch IDE Floppy disk 1.44 MB 3.5 inch Interface Printer port GPIB IEEE 488.1 10/100 BASE-T (IEEE 802.3) Mouse Keyboard Monitor out VGA (D-SUB 15 pins) A- 14 RSA3303A & RSA3308A User Manual...
- Page 403 Description Preamp power connector Connector type LEMO 6 poles Pin assignment Pin 1: NC, Pin 2: ID1, Pin 3: ID2, Pin 4: - - 12 V, Pin 5: GND, Pin 6: +12 V A- 15 RSA3303A & RSA3308A User Manual...
-
Page 404: Physical Characteristics
(20 G), half-sine, 11 ms duration Three shocks in each direction along each major axis, total of 18 shocks Cooling clearance Bottom 20 mm (0.79 in) Both sides 50 mm (1.97 in) Rear 50 mm (1.97 in) A- 16 RSA3303A & RSA3308A User Manual... - Page 405 IEC61010-1 Safety requirements for electrical equipment for measurement, control, and laboratory use. Emissions which exceed the levels required by this standard may occur when this equipment is connected to a test object. A- 17 RSA3303A & RSA3308A User Manual...
- Page 406 Operating Temperature Range +5 to +40 _C Overvoltage Category Overvoltage Category II (as defined in IEC61010-1, Annex J) Pollution Degree Pollution Degree 2 (as defined in IEC61010-1). Note: Rated for indoor use only. A- 18 RSA3303A & RSA3308A User Manual...
- Page 407 H MARKERS H VIEW H UTILITY Some of the submenus are used for programming or servicing; information about these submenus is in the RSA3303A and RSA3308A Programmer Manual or Service Manual (optional). Figure B- 1: Menu keys B- 1 RSA3303A & RSA3308A User Manual...
- Page 408 Frequency Offset Amplitude Table Off / On Edit Table... Interpolation... Select Point To Edit Load Table Frequency Save Table Amplitude Delete Point Add New Point Done Editing Table Clear Table Freq Interpolation Ampl Interpolation B- 2 RSA3303A & RSA3308A User Manual...
- Page 409 Display Detection... Max-Min / Max / Min Load Trace n Load from File menu (Refer to page B- - 14) Save Trace n Save to File menu (Refer to page B- - 14) B- 3 RSA3303A & RSA3308A User Manual...
- Page 410 Acquisition Length Acquisition History Analysis Length Analysis Offset Frequency Center Frequency Width Demod and Time modes Acquisition Length Acquisition History Spectrum Length Spectrum Offset Analysis Length Analysis Offset Output Trigger Indicator Off / On B- 4 RSA3303A & RSA3308A User Manual...
- Page 411 Same as in the S/A mode. Refer to page B- - 3. FFT Window... Pulse Measurements in the Time Mode Nyquist / Blackman-Harris 4B FFT Window... Rolloff Ratio Demod and Time Modes Average Off / On Average Count Average Term Control Expo / Repeat B- 5 RSA3303A & RSA3308A User Manual...
- Page 412 Same as in the S/A mode. Refer to page B- - 3. FFT Window... Pulse Measurements in the Time Mode Nyquist / Blackman-Harris 4B FFT Window... Rolloff Ratio Demod and Time Modes Average Off / On Average Count Average Term Control Expo / Repeat B- 6 RSA3303A & RSA3308A User Manual...
- Page 413 Average / Median AM Demod FM Demod Auto Carrier On / Off Frequency Error (Auto Carrier = On) Frequency Offset (Auto Carrier = Off) Threshold PM Demod Threshold IQ versus Time Pulse Spectrum Measurement Off B- 7 RSA3303A & RSA3308A User Manual...
- Page 414 Manchester / Miller / Miller (M_2, M_4, or M_8) / Modified Miller / FM0 Lower Threshold / PIE (Type A or C) / NRZ / NRZ-L (2, 4, or 8 periods) / PWM / Bit Cell Higher Threshold Interpolation Points On / Off B- 8 RSA3303A & RSA3308A User Manual...
- Page 415 Spurious Threshold Excursion Symmetrical Filter Off / On Carrier Tracking Off / On Scroll Table Real-Time Spurious Only Analyze Carrier Bandwidth C/N Sideband Upper / Lower Frequency versus Time Freq Settling Threshold Smoothing Factor B- 9 RSA3303A & RSA3308A User Manual...
- Page 416 Demod and Time (Transient) Modes only Analysis Time = Marker Time Peak Search Hor. Threshold Center Zoom = Marker Freq Reference Cursor to Trigger Reference Cursor to Trigger Output Time (CCDF) Mode only Peak Search Hor. Threshold B- 10 RSA3303A & RSA3308A User Manual...
- Page 417 Vertical Size Radix... Hex / Oct / Bin Vertical Start Rotate Color Scale Color Stop Eye Diagram * Full Scale Measurement Content... I / Q / Trellis Eye Length * Option 21 only. B- 11 RSA3303A & RSA3308A User Manual...
- Page 418 * The content depends on the measurement item. Modulation Type = OQPSK Q Data Half Symbol Shift + / 0 / - - RFID Measurements (Option 21 only) Burst No Envelope No Guidelines Off / On Menu Off B- 12 RSA3303A & RSA3308A User Manual...
- Page 419 On / Off Pulse-Pulse Phase Results On / Off Channel Power Results On / Off OBW Results On / Off EBW Results On / Off Freq. Deviation Results On / Off Max / Adaptive B- 13 RSA3303A & RSA3308A User Manual...
- Page 420 All Blocks / Current Block / Current Area Print now Save screen to file... Background color Black / White Printer... * Contact your local Tektronix distributor or sales office for installing user-specific macros. B- 14 RSA3303A & RSA3308A User Manual...
- Page 421 This section shows the symbol mapping for each digital modulation technique. GFSK/BPSK QPSK 8PSK 16QAM Left Right Left Right Left Right Left Right 32QAM 64QAM Left Right Right Left Right Figure C- 1: Symbol mapping: GFSK/BPSK, QPSK, 8PSK, 16QAM, 32QAM, and 64QAM C- 1 RSA3303A & RSA3308A User Manual...
- Page 422 Appendix C: Digital Demodulation Symbol Mapping 256QAM Left Right Figure C- 2: Symbol mapping: 256QAM C- 2 RSA3303A & RSA3308A User Manual...
- Page 423 Appendix C: Digital Demodulation Symbol Mapping Table C- 1: π/4 shift DQPSK Rotation angle (degree) +135 - - 45 - - 135 Table C- 2: GMSK Rotation direction Left Right C- 3 RSA3303A & RSA3308A User Manual...
- Page 424 Appendix C: Digital Demodulation Symbol Mapping C- 4 RSA3303A & RSA3308A User Manual...
- Page 425 Contact your local deformed contacts. Dirt in connectors. Tektronix distributor or sales office. Carrying handle Correct operation. Accessories Missing items or parts of items, bent pins, broken or frayed cables, and damaged connectors. D- 1 RSA3303A & RSA3308A User Manual...
-
Page 426: Lubrication
Lubrication There is no periodic lubrication required for this instrument. Cleaning the Interior Consult your Tektronix Service Center or representative for cleaning the analyzer interior. D- 2 RSA3303A & RSA3308A User Manual... -
Page 427: Appendix E: Options And Accessories
H Option D5: Calibration data report, 5 years (requires Option C5) H Option R3: Repair service, 3 years H Option R5: Repair service, 5 years H Power cord options listed in Table E- -1 E- 1 RSA3303A & RSA3308A User Manual... - Page 428 Option number North America 120 V Universal Euro 230 V United Kingdom 230 V Australia 240 V North America 240 V Switzerland 220 V Japan 100 V China 240 V No power cord supplied. E- 2 RSA3303A & RSA3308A User Manual...
-
Page 429: Standard Accessories
Japanese language programmer manual 071-1410-XX Service manual 071-1412-XX Accessory bag 016-A330-00 Preamplifier (20 dB gain to 3 GHz) 650-A900-XX RTPA2A real-time probe adapter (P7000 series probes recommended) Rack mount kit (for field conversion) E- 3 RSA3303A & RSA3308A User Manual... - Page 430 Appendix E: Options and Accessories E- 4 RSA3303A & RSA3308A User Manual...
- Page 431 Glossary...
- Page 433 A signal generator producing a specified output used for calibration purposes. Carrier, Carrier Signal The electrical signal, typically a sine wave, upon which modulation is impressed. Carrier Frequency The frequency of the carrier signal. Glossary- 1 RSA3303A & RSA3308A User Manual...
- Page 434 A display in which the scale divisions are a logarithmic function of the input signal voltage. Display Line A horizontal or vertical line on a waveform display, used as a reference for visual (or automatic) comparison with a given level, time, or frequency. Glossary- 2 RSA3303A & RSA3308A User Manual...
- Page 435 The process, or result of a process, in which the frequency of an electrical signal (the carrier) is varied in accordance with some characteristic of a second electrical signal (the modulating signal or modulation). Glossary- 3 RSA3303A & RSA3308A User Manual...
- Page 436 Connect to a file containing settings or other data to be used by the application. Maintain the connection. Live Trace Any combination of the A trace and/or the B trace when SAVE A is off. Glossary- 4 RSA3303A & RSA3308A User Manual...
- Page 437 “grassy” baseline in the display, even when no signal is present. Open (Recall, Restore) Bring data into the application from a file of application-native format. OQPSK Acronym for Offset QPSK (Quadrature Phase Shift Keying). Acronym for Probability Distribution Function. Glossary- 5 RSA3303A & RSA3308A User Manual...
- Page 438 The “second” marker displayed only in the Delta Marker mode. Sensitivity Measure of a spectrum analyzer’s ability to display minimum level signals, expressed in volts or decibels. Internal frequency (IF) bandwidth, display mode, and any other influencing factors must be given. Glossary- 6 RSA3303A & RSA3308A User Manual...
- Page 439 The number of dB, volts, etc., represented by one vertical division of a spectrum analyzer display screen. View An area or window of the display screen which contains information all of the same type (such as a Spectrum View or a Power versus Time View). Glossary- 7 RSA3303A & RSA3308A User Manual...
- Page 440 Glossary Glossary- 8 RSA3303A & RSA3308A User Manual...
- Page 441 Index...
- Page 443 Bin, relation between frame, bin, and pixel, 3- - 188 Decoding format, RFID analysis (Option 21 only), Block diagram, 1- - 6 3- - 70 Bluetooth, 3- - 44 Default settings, restoring, 2- - 22 Brightness Index- 1 RSA3303A & RSA3308A User Manual...
- Page 444 Index Demod mode, 3- - 27 Frequency Difference between RSA3303A and RSA3308A, 1- - 2 menu, 3- - 118 Digital modulation analysis, 3- - 43 setting, 3- - 117 basic procedure, 3- - 48 Frequency versus Time measurement, 3- - 85...
- Page 445 FFT, 3- - 172 Frequency, 3- - 118 front panel keys, 2- - 3 Main view, modulation analysis screen, 3- - 28 Help, 3- - 231 Manuals list, xvii Input, 3- - 235 Index- 3 RSA3303A & RSA3308A User Manual...
- Page 446 Restart, 1- - 19 P25 C4FM, 3- - 44 RF envelope measurement, RFID analysis (Option 21 only), 3- - 75 measurement, 3- - 59 RF INPUT, Caution, 1- - 12 view setting, 3- - 208 Index- 4 RSA3303A & RSA3308A User Manual...
- Page 447 3- - 103 zoom, 3- - 24 real-time phase noise measurement, 3- - 109 Trace real-time spurious measurement, 3- - 113 comparison, 3- - 181 spurious measurement, 3- - 107 displaying, 3- - 184 Index- 5 RSA3303A & RSA3308A User Manual...
- Page 448 Troubleshooting, 1- - 19 Tutorial, 2- - 29 Zoom function, 3- - 24 setting a zoomed area, 3- - 25 UNCAL, 1- - 12 Timing menu, 3- - 24 Unpacking, 1- - 9 Index- 6 RSA3303A & RSA3308A User Manual...
Need help?
Do you have a question about the RSA3303A and is the answer not in the manual?
Questions and answers