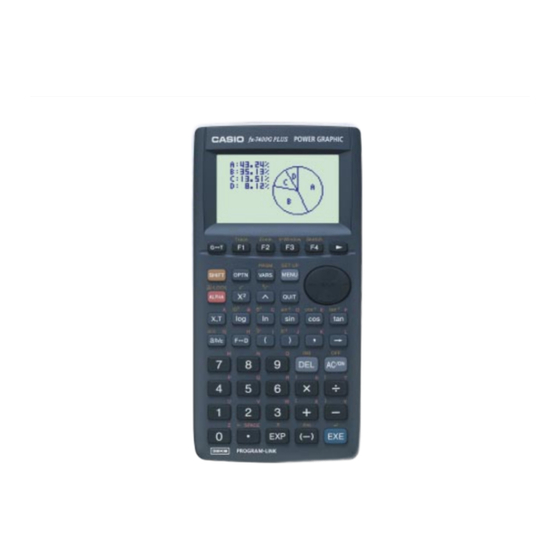
Casio fx-7400G PLUS Booklet
Graphic calculator - a booklet of practical examples for students
Hide thumbs
Also See for fx-7400G PLUS:
- User manual (218 pages) ,
- Instruction manual (38 pages) ,
- Appendix (15 pages)
Table of Contents
Advertisement
Quick Links
A booklet of practical examples for students using the graphic scientific calculator.
A booklet of practical examples for students using the graphic scientific calculator.
Worldwide
http://world.casio.com/edu_e/
Education Web
The Graphic Calculator fx-7400G PLUS,
your powerful math companion.
Printed in Japan SA0202-002001A
Advertisement
Table of Contents

Related Manuals for Casio fx-7400G PLUS


Summary of Contents for Casio fx-7400G PLUS
- Page 1 A booklet of practical examples for students using the graphic scientific calculator. A booklet of practical examples for students using the graphic scientific calculator. Worldwide http://world.casio.com/edu_e/ Education Web The Graphic Calculator fx-7400G PLUS, your powerful math companion. Printed in Japan SA0202-002001A...
- Page 2 Finally, everyone at CASIO would like to express their sincere appreciation to all of the teachers and educators whose cooperation made this activities book possible.
-
Page 3: Table Of Contents
** CONTENTS ** SUBJECT TITLE UNIT AUTHOR PAGE Engineering Speed and Distance Equation Mr. Yuji Kudo Function Expressing the Relationship Quadratic Equation Mr. Yuji Kudo Between Time Taken and Distance Traveled Automobile Transmission and Engine Speed Division Mr. Yuji Kudo Automobile Gasoline Engine Efficiency Regression (Linear, Quadratic) Mr. -
Page 4: Speed And Distance
E-1 Speed and Distance JIKKYO SHUPPAN CO., LTD.: SHIN KOGYO SURI (NEW EDITION) Exercise Two Cars Traveling at Different Speeds Tokyo (0) Ayuzawa (72) Two cars, one in Tokyo and one in the Ayuzawa Parking Atsugi (35) Area (72 kilometers from Tokyo) set off for Nagoya at the Fuji Gotenba Nagoya... - Page 5 E-1 Speed and Distance • Keep pressing until the cursor is at the point where the two graphs intersect. This pro- duces values that provide an approximate result for the exercise. • Press (Zoom) and then (IN) to enlarge the graph with the cursor location as the center.
-
Page 6: Function Expressing The Relationship Between Time Taken And Distance Traveled
E-2 Function Expressing the Relationship Between Time Taken and Distance Traveled JIKKYO SHUPPAN CO., LTD.: SHIN KOGYO SURI (NEW EDITION) Exercise Function Expressing the Relationship Between Time Distance [min] [sec] [km] Time and Distance Traveled 0.125 The nearby table is being configured for )[m], 0.500 when it is assumed that distance covered... - Page 7 E-2 Function Expressing the Relationship Between Time Taken and Distance Traveled 5. Draw graph 2. Press (GRPH) (GPH1). The graph that appears is a scatter diagram. 6. Perform quadratic regression. Press (X^2) to perform quadratic regression and obtain the function. Press (DRAW) to draw the graph, which is overlaid onto the scatter diagram as shown to the right.
-
Page 8: Automobile Transmission And Engine Speed
E-3 Automobile Transmission and Engine Speed JIKKYO SHUPPAN CO., LTD.: SHIN KOGYO SURI (NEW EDITION) Exercise Relationship between an Automobile’s Transmission and Engine Speed Engine Transmission Create a program that determines the rotation speed n Drive Shaft [rpm] of an automobile’s propeller shaft in each gear for an engine running at n = 2000 rpm. - Page 9 E-3 Automobile Transmission and Engine Speed 4. Practical Example The screen to the right shows an example of what appears when a gear ratio of 3.6 is input. Summary The program can be made even more useful by modifying it to accept input of engine speed as well.
-
Page 10: Automobile Gasoline Engine Efficiency
E-4 Automobile Gasoline Engine Efficiency Exercise The following is a table of fuel efficiency measurement results for an automobile gasoline engine. Draw a graph of the rate of change in the data. ■ Measurement Results Torque Output Fuel Efficiency Engine Speed Sample T0 [kgf . - Page 11 E-4 Automobile Gasoline Engine Efficiency 3. Engine Speed – Output Graph: Graph 2 (GRPH) (GRPH) (GPH2) (SET) Stat Graph 2: Make List 3 the YList. Graph 2 4. Engine Speed – Fuel Efficiency Graph: Graph 3 (GRPH) (GRPH) (GPH3) (SET) Stat Graph 3: Make List 4 the YList.
-
Page 12: Water Depth And Flow Velocity
EM-1 Water Depth and Flow Velocity JIKKYO SHUPPAN CO., LTD.: SHIN KOGYO SURI (NEW EDITION) Exercise Industrial Mathematics (Water Depth and Flow Velocity) ■ Experiment (1) Cut off the top of an old oil can. Then, starting 5 cm from the top of can, punch 6mm diam- eter holes at 5cm intervals into the side of the can, as shown in the illustration. - Page 13 EM-1 Water Depth and Flow Velocity (3) This makes it possible to obtain flow velocity v in List 3. Exercise 2 From the data in Excercise 1, graph the relationship between water depth h [cm] and flow velocity v [cm/s]. Solution: With the h [cm] on the horizontal axis and v [cm/s] on the vertical axis, point data points and then draw a regression curve.
-
Page 14: The Calculator 10-Key Pad
Mathematics with the Graphic Calculator A-1 The Calculator 10-key Pad (1) Take one counter-clockwise lap around the calculator 10-key The Calculator 10-key Pad pad, pressing the three keys and adding the values produced along each side. Make a note of the result obtained. (2) Next, take a clockwise lap and compare with results (1). -
Page 15: Straight Line Passing Through Two Points
Mathematics with the Graphic Calculator A-3 Straight Line Passing Through Two Points Find the equation for the straight line passing through the two points (–2, 1) and (–1, –4). This problem is easy for students. The straight line is found by substituting two points (–2, 1) and (–1, –4) into + b, creating a system of simultaneous linear equations with two unknowns (a, and b). -
Page 16: Statistics
S-1 Histogram Use a graphic scientific calculator to graph statistics. Exercise 1 The following data represents the distances a handball is thrown by 12 students. (Unit: meters) (The Entrance Examination of Hokkaido Public High School, 2000) Procedure: Input data into List 1. Select the input data and graph type. Solution: From the Main Menu, enter the STAT Mode. - Page 17 S-1 Histogram Reference You can also change the width of the class. Operation (2) Change the start value of the class (SET UP) to 10, and the width to 5. (GRPH), (GPH1) (Man) The display settings are also changed. (4) Draw the histogram. (V-WIN) (GRPH), (GPH1)
-
Page 18: Circle Graph
S-2 Circle Graph Exercise 2 Users Employing Each Provider Subscription Method (%) The data to the right shows the percent- Subscription Method ages of new subscribers that use various From provider Website 28.4 available methods to subscribe to an Off-line by mail 27.2 Software that comes with new computer 18.8... -
Page 19: Bar Graph
S-2 Circle Graph S-3 Bar Graph Drill 2 Solution Note the setting for Display. S-3 Bar Graph Exercise 3 The nearby table shows the number of people visiting Total Visitors 22596 Hawaii from Japan and other countries during June 22777 2000. -
Page 20: Bar Graph And Line Graph
S-4 Bar Graph and Line Graph Exercise 4 The following shows the monthly average temperature and precipitation for Tokyo. Tokyo JAN FEB MAR APR MAY JUN JUL AUG SEP OCT NOV DEC Temperature 14.1 18.6 21.7 25.2 27.1 23.2 17.6 12.8 Precipitation 45.1 80.4 60.4 99.5 125.0 138.0 185.2 126.1 147.5 179.8 89.1 45.7 Use this data to draw a graph that includes a bar graph of the precipitation and a line graph of the temperature. - Page 21 S-4 Bar Graph and Line Graph Drill 4 Solution Change the settings. Press (GRPH), , and then (SET). When (Sep.G) is selected for When (O.Lap) is selected for AutoWin. AutoWin. – 18 –...
-
Page 22: Relationship Between Voltage, Current
EE-1 Relationship Between Voltage, Current, and Power Exercise Application 1 The following table shows voltage, current, and power measurements on a given circuit. Draw a graph that shows the relationship among the three measurements. Measured Results Voltage (V) Current (A) Power (W) 0.24 0.27... -
Page 23: Ohm's Law
EE-2 Ohm’s Law Ohm’s law deals with the relationship between current, voltage, and resistance. The following expressions express this relationship, when I is current, R is resistance, and E is voltage. I = E / R R = E / I E = IR k Proportional Expression The proportional expression is... - Page 24 EE-2 Ohm’s Law Determine the slopes of the graphs shown below. Expression 1 Expression 2 4 = a 2 = a a = 1 a = 2 / 3 Therefore: y = x Therefore: y = 2x / 3 k Back to Ohm’s Law I = E/R y = ax Getting back to Ohm’s Law, consider the relationship...
- Page 25 EE-2 Ohm’s Law Experiment 1 Now let’s perform an experiment that actually checks the theory behind Ohm’s Law. Prepare a circuit with 100Ω resistors like the one shown below. Ammeter I (A) Power Supply Resistor R (Ω) Voltmeter V (V) Let’s try gradually increasing the voltage of the power supply.
- Page 26 EE-2 Ohm’s Law Experiment 2 Referring to Experiment 1, determine unknown resistance values. We will use three resistors, each of which has four colored bands. ■ Resistor 1 (Brown, Green, Brown, Gold) Voltage (V) Current (mA) 10.9 12.3 13.6 Analysis – Step 1 Input the data on your graphic calculator and graph it.
- Page 27 EE-2 Ohm’s Law ■ Resistor 3 (Violet, Green, Black, Gold) Voltage (V) Current (mA) 11.1 13.8 16.5 19.2 21.8 24.5 27.3 Analysis – Step 1 Input the data on your graphic calculator and graph it. Analysis – Step 2 Use the graphic calculator to determine the slope of the line. a = 13.6 –3 Analysis - Step 3...
- Page 28 EE-2 Ohm’s Law Experiment 3 Experiment 1 and Experiment 2 used resistors (carbon film resistors). In Experiment 3, we will use a light bulb in place of resistance, whose filament acts as the resistance. Wire a diagram like the one shown below. •...
- Page 29 EE-2 Ohm’s Law Analysis – Step 3 The shapes of the graphs produced when resistors are used differ from the graph produced by the light bulb. In the case of resistors, the graph is linear and passes through the origin, but the light bulb resistance graph is different.
-
Page 30: Small Signal Amplification Factor Of A Transistor
EE-3 Small Signal Amplification Factor of a Transistor Objective The “Experiment Corner: Finding the small signal current amplification ratio h of a transis- tor” in JIKKYO SHUPPAN Co., Ltd. “DENSHI KISO (NEW EDITION) 719” provides a practi- cal example of using a graphic calculator. Since the functions used are limited to basic operations, they can be incorporated into an actual classroom setting quite easily. - Page 31 EE-3 Small Signal Amplification Factor of a Transistor 3. What is the small signal current amplification ratio h The small signal current amplification ratio h expresses how much collector-emitter current increases during transistor operation when base current is increased slightly. 4.
- Page 32 EE-3 Small Signal Amplification Factor of a Transistor Graph Settings Press (GRPH) (SET) to check the graph set- tings. Use to move the cursor around the display and use keys through to change the set- tings to they are like the ones shown on the screen nearby. Graphing Press (GRPH)
- Page 33 EE-3 Small Signal Amplification Factor of a Transistor Linear Regression Pressing (DRAW) performs linear regression and overlays it onto the scatter diagram as shown on the screen nearby. Pressing displays the slope, which is the value indicated for “a=”. This result indicates that the following is the small signal current amplification ratio of transistor 2SC1815.
- Page 34 EE-3 Small Signal Amplification Factor of a Transistor 7. Things to think about What transistor characteristics become evident from this experiment? 8. Write down your feelings about this experiment 9. Topic A transistor works the same way as a vacuum tube. Summarize the difference between the structure of a vacuum tube and a transistor.
-
Page 35: Density Of A Liquid
EC-1 Density of a Liquid In exercises that involve measurements, the most common approach is to perform calculations and draw graphs based on measurement results, and then to study tendencies, estimated values, and other factors. This exercise is a practical application of a physical chemistry exercise (physical measurement) using the graphic calculator. - Page 36 EC-1 Density of a Liquid 1-2. Concentration-Mass Relationship (Scatter Diagram) After preparing the graph with (GRPH), press (GPH1) to display the scatter graph, which shows changes in concentration and mass. 1-3. Density Calculation Press , and then obtain the density in List 3. Move the cursor to the List 3 name, and then input Expression 1 as described below.
- Page 37 EC-1 Density of a Liquid 1-6. Quadratic Regression After pressing to exit the graph screen, press (GRPH) (GPH1) again. (DRAW) draws the quadratic Next, press (X^2) to display the regression graph. quadratic regression result. quadratic This shows that regression is appropriate for this exercise. 1-7.
-
Page 38: Viscosity Of A Liquid
EC-2 Viscosity of a Liquid Exercise Measuring the Viscosity of a Liquid Solutions of ethanol and water are prepared in concentrations of 0, 20, 40, 60, 80, and 100 wt%. An Oswald viscometer is used to measure the flow time and determine the viscosity of each sample. -
Page 39: Index Of Refraction Of A Liquid
EC-3 Index of Refraction of a Liquid Exercise Measuring the Index of Refraction of a Liquid Solutions are prepared with sucrose concentrations of 0 to 30 wt%. A refractometer is used to measure the index of refraction for of each sample. A juice sample is also measured using the same procedure, and then a graph is used to estimate the sugar concentration of the juice. -
Page 40: Solubility Curve
EC-4 Solubility Curve JIKKYO SHUPPAN CO., LTD.: KOGYO KAGAKU (p. 55) Exercise Industrial Chemistry (1) (Solubility Curve) The nearby table shows the solubility of potassium nitrate KNO in water. Use this to draw the solubility curve of potassium nitrate. Temperature (°C) 13.3 22.0 31.6 45.6 63.9 85.2 109 137 Solubility (g/100g water) Graphic Calculator Operation... -
Page 41: Specific Gravity Of Gas
EC-5 Specific Gravity of Gas JIKKYO SHUPPAN CO., LTD.: KOGYO KAGAKU (p. 92) Exercise Industrial Chemistry (2) (Specific Gravity of Gas) Determine the specific gravity of the following gasses at 0°C, 1 atm. , He, C , CI , SO Method 1 Divide the molecular weight of the gas by the average molecu-... -
Page 42: Cam Diagram
M-1 Cam Diagram Draw the cam diagram of a plate cam with a sliding coupled arm. The cam diagram is created using cam rotation angles input from a multi-turn potentiometer, and from inputting the displace- ment volumes of the sliding arm. Data is measured with the EA-100 Data Analyzer. In the above photograph, the displacement of the sliding arm is input from the sliding volume. - Page 43 M-1 Cam Diagram Experiment Results Using the fx-7400G PLUS After executing the program on the fx-7400G PLUS so screen (1) is on the display, press the EA-100 Data Analyzer TRIGGER key. After measurement is complete, press the calculator key to display screen (2), followed by screen (3), which is a graph of the cam moving at uniform speed.
-
Page 44: Stepping Motor Excitation Systems
M-2 Stepping Motor Excitation Systems A 2-phase stepping motor with a step angle of 7.5 degrees is connected to a unipolar drive circuit to observe operation under different excitation systems. The A phase of the 2-phase stepping motor is connected to DIG-OUT (D0), the B phase is connected to D1, the A phase is connected to D2, and the B phase is connected to D3 through a drive circuit, and a digital output buffer is used to drive the motor. - Page 45 M-2 Stepping Motor Excitation Systems Program for the 1-Phase Excitation System Filename:STEP-1 • Program name: STEP-1 S-WindAuto ↓ • Specifies auto setup of the graph screen range. ClrGraph ↓ • Clears the graph. {0} → List 6:Send (List 6) ↓ •...
-
Page 46: Sum Of Products
AC-1 Sum of Products Answers 4Total 17.35 253.82 37.84 469.01 Calculator Operation 1 Use the LIST function. 2 In List 1, input the x values 2.1, 7.8, 5.6. 3 In List 2, input the y values 3.5, 6.9, 1.4. 4 Move the cursor to the title of List 3. 5 Perform the following key sequence to obtain the value of xy. -
Page 47: Sum Of Products And Mean
AC-2 Sum of Products and Mean 11.4 11.9 12.4 Answers 5Total 4Sum 1102.6 2380.8 3657.2 41140.6 6Mean 594 612.1 Calculator Operation 1 Use the LIST function. 2 Input the values for x (11.4, 11.9, 12.4) into List 1. 3 Input the values for y (9, 32, 53) into List 2. 4 Move the cursor to the top of List 3. -
Page 48: Sum
AC-3 Sum Japanese Math English Total a+b+c Answers 1199 2178 3254 4383 Grand Total Total 51048 Calculator Operation 1 Use the LIST function. 2 Input the values for Japanese a (68, 76, 51, 49, 92) and the total (336) into List 1. 3 Input the values for Math b (72, 95, 80, 53, 83) into List 2. -
Page 49: Percent
AC-4 Percent Population Density Population Region Area (km (Persons) (Persons per km 78.5 67.2 2478 31.9 18.8 22.66 Answers 17.22 236.88 324.29 451.74 54.6 1243 522.77 Calculator Operation 1 Use the LIST function. 2 Input the area values (78.5, 67.2, 31.9, 18.8, 2.3, 54.6) into List 1. 3 Input the population values (567, 2478, 775, 426, 119, 1243) into List 2. -
Page 50: Calculations Including Trigonometric Functions
AC-5 Calculations Including Trigonometric Functions (Function Calculations) 1 25.4 × tan 78 ° 05’ Answer 120.36 From the Main Menu, enter the RUN Mode. (SET UP) (Deg) 25.4 (ANGL) (° ’’’) (° ’’’) 2 9.65 ÷ cos 28.56 ° Answer 10.99 9.65 28.56 (SET UP) -
Page 51: Permutation And Combination
AC-6 Permutation and Combination ( n – r )! Answers 120 220160 First, solve for P-1: (PROB) (x!) (x!) [Calculation Using the Playback Function] Next, solve for P-2: 2 C = Answers 130 2756 First, solve for C-1: (PROB) [Calculation Using the Playback Function] Next, solve for C-2: –... -
Page 52: Economy Of Materials (Cross-Sectional Area)
AR-1 Economy of Materials (Cross-sectional Area) JIKKYO SHUPPAN CO., LTD.: SHIN KOGYO SURI Exercise 1 (NEW EDITION) Economy of Materials Cross-sectional area You want to form a piece of sheet metal to make a shape like the one shown in the illustration nearby, in order to create the largest possible cross-sectional area. - Page 53 AR-1 Economy of Materials (Cross-sectional Area) • Graph Settings Configure settings for the -axis and -axis ranges and scales. View Window Settings Input the -axis range and scale values shown on the screen nearby. (V-WIN) Next, input the -axis range and scale values. •...
-
Page 54: Economy Of Materials (Volume)
AR-2 Economy of Materials (Volume) JIKKYO SHUPPAN CO., LTD.: SHIN KOGYO SURI Exercise 2 (NEW EDITION) Economy of Materials When creating a box by cutting out squares of the same size from the four corners of a 30 cm square piece of cardboard, determine the length of each side of the squares that should be cut in order to obtain the greatest volume. - Page 55 AR-2 Economy of Materials (Volume) • Graph Settings Configure settings for the X-axis and Y-axis ranges and scales. View Window Settings Input the X-axis range and scale values shown on the screen nearby. (V-WIN) Next, input the Y-axis range and scale values. 2500 •...
-
Page 56: Concrete Mix Design (Circle Graph)
AR-3 Concrete Mix Design (Circle Graph) Exercise 3 The materials produced by a concrete mix design are shown below. Use a graphic scientific calculator to draw a graph of this mixture. Mixture Table Coarse Slump Water/ Fine kg/m Unit Weight [ Aggregate Content Cement... - Page 57 AR-3 Concrete Mix Design (Circle Graph) (GRPH) (SET) (Pie) (GRPH) (GPH1) This displays a graph like the one shown nearby. Summary A circle graph provides a visual overview of percentages of each material in a concrete mix. For example, C indicates that 9.80% of the mixture is cement. If we say this value is about 10, we can say that the volume of water (B) is 1.8 times, the volume of fine aggregate or sand (D) is about 3 times, and the volume of coarse aggregate (E) is about 4 times that of cement.
-
Page 58: Material Quality Control (Histogram)
Q-1 Material Quality Control (Histogram) JIKKYO SHUPPAN CO., LTD.: SHIN KIKAI KOSAKU 2 Measurement of the diameters of 100 round rods that were to have been shaved to a diam- eter of 35 mm revealed variation ranging from 34.55 to 35.45. Measurements were divided into a number of ranges, which revealed the frequency distribution table shown below. - Page 59 Q-1 Material Quality Control (Histogram) Histogram Now we will use our graphic calculators to draw a distribution curve based on the measured diameters of the 100 rods. We will use the program mode and use random numbers as the measured data. See “Program Creation”...
- Page 60 Q-1 Material Quality Control (Histogram) k HISTDATA Program Creation : From the Main Menu, enter the PRGM Mode. (NEW) : Select NEW PROGRAM. : Specify “HISTDATA” as the program name. : Reset the statistical graph. (PRGM) (CLR) (Grph) (List) : Reset the LIST data. (V-WIN) (V-Win) 34.5 35.5...
- Page 61 Q-1 Material Quality Control (Histogram) k HISTDATA Program Creation (continued) +K[1 34.65 (NUM) (Int) : Input random values between 34.65 to 34.75 into the lines from List 1 [2] (PROB) (Ran#) to List 1 [8]. (LIST) (List)1 : Input the Next statement. (PRGM) (COM) (Next)
- Page 62 Q-1 Material Quality Control (Histogram) k HISTLINE Program Creation Histogram: Broken line graph The program creates a broken line graph by connecting the median values in each histogram division with lines. The broken line graph is based on the median value (horizontal axis) of each division in the graph and the frequency of the data (vertical axis).
-
Page 63: Component Quality Variation Control (X-R Control Chart)
Q-2 Component Quality Variation Control (X-R Control Chart) JIKKYO SHUPPAN CO., LTD.: SHIN KIKAI KOSAKU 2 The X-R control chart is widely used to control variations in dimensions, quality, strength, and other qualities. X is the mean value and R is the range, which is the difference between the maximum and minimum values of a group of data. -
Page 64: Control
Q-2 Component Quality Variation Control (X-R Control Chart) Use the values in the data sheet to determine the mean (X) and range (R) for each of the data groups. Next, use the X control chart coefficient table below to determine the A , and D coefficients in accordance with the number of measured values in each group (sample size n). - Page 65 Q-2 Component Quality Variation Control (X-R Control Chart) Using the STAT function of the graphic calculator, input the lot numbers and measured values into lists, calculate the mean and range, and then graph the results using the statistical graph function. The actual operation of the calculator is shown below.
- Page 66 Q-2 Component Quality Variation Control (X-R Control Chart) : From the Main Menu, enter the STAT Mode. eeeee : Move the cursor to the first line of List 6. : Select the title of List 6. (LIST) (List) 1 (List) 2 : Calculate mean values for entry into List 6.
- Page 67 Q-2 Component Quality Variation Control (X-R Control Chart) : From the Main Menu, enter the RUN Mode. (LIST) (Sum) : Assign the mean value (List 5) total to Memory A. (List) 5 (Sum) : Assign the range value (List 6) total to Memory B.
- Page 68 Q-2 Component Quality Variation Control (X-R Control Chart) : From the Main Menu, enter the STAT Mode. (GRPH) (SET) : Display the graph setting screen. (GPH1) : Select StatGraph1. : Select xy Line. (List1) (List5) : Specify List 1 (group numbers) for the horizontal axis.
- Page 69 Q-2 Component Quality Variation Control (X-R Control Chart) k XRDATA Program Creation Control Chart Data : From the Main Menu, enter the PRGM Mode. (NEW) : Select NEW PROGRAM. : Input XRDATA as the program name. !*({) 75.98 75.88 • • • !/(}) 75.95 •...
-
Page 70: Using A Graphic Calculator
Z-1 Using a Graphic Calculator (Displaying Calculation Results) (1) Fixed Point (Specifying the Number of Decimal Places) Displaying results up to two decimal places. ccc1 (SET UP) (Fix) (2) Floating Point (Specifying the Number of Significant Digits) Displaying results up to three significant digits. ccc2 (SET UP) (Sci) -
Page 71: (Inputting Statistical Data)
Z-2 Using a Graphic Calculator (Inputting Statistical Data) Operation Table Input From the Main Menu, enter the STAT Mode. After confirming the cursor is in line 1 of List 1, input the voltage values. , etc.) After confirming the cursor is in line 1 of List 2, input the current values. -
Page 72: Using A Graphic Calculator (Determining The Slope Of A Line)
Z-3 Using a Graphic Calculator (Determining the Slope of a Line) Calculation of the slope and other information from the obtained data is performed using linear regression. Though the actual calculation is quite complex and difficult to perform, the graphic calculator performs linear regression in an instant and provides the slope and -intercept. - Page 73 Z-4 Creating Text Materials Program-LINK software (FA-123) can be used to connect the fx-7400G PLUS graphic calculator to a computer and transfer screen shots. You can also exchange data and programs with a computer. The following is an example of how to use the screen shot transfer function to create text materials for the graphic calculator.
- Page 74 Z-4 Creating Text Materials Figure 4 shows the computer screen after capture of a graph screen from the graph calculator. This image can be saved directly to a file, or you can copy it and paste it into another application. Figure 4 Screen Capture (3) Pasting Images Use the following procedure to paste an image into a word processor or other application you...
- Page 75 Supervisor Professor Shozo Yamashita Faculty of Engineering Takushoku University Authors (Alphabetically) Takashi Fukazawa University of Tsukuba Senior High School at Sakado Hiroaki Hashimoto Setagayaizumi High School (Tokyo) Yuji Kudo University of Tsukuba Senior High School at Sakado Hideyo Makishita University of Tsukuba Junior and Senior High School at Komaba Akihiro Shimizu Tanashi Technical High School (Tokyo) Mitsugu Tatara...
- Page 76 MEMO – 73 –...
- Page 77 MEMO – 74 –...
- Page 78 MEMO – 75 –...
Need help?
Do you have a question about the fx-7400G PLUS and is the answer not in the manual?
Questions and answers