Table of Contents
Advertisement
Quick Links
Advertisement
Table of Contents

Subscribe to Our Youtube Channel
Related Manuals for SIGLENT SNA6000A Series


Summary of Contents for SIGLENT SNA6000A Series
- Page 1 SNA6000A Series Vector Network Analyzer User Manual EN02A...
-
Page 3: Table Of Contents
Trace State ......................32 5.6.4 Channel State......................33 5.6.5 Hardkeys ....................... 33 5.6.6 Function Keys......................33 5.6.7 Label Page ......................34 5.6.8 Window State ......................34 5.6.9 Stimulus Range ..................... 34 5.6.10 Status Bar ......................34 5.6.11 Message Bar ......................35 www.siglent.com... - Page 4 Display format ....................... 70 6.7.2 Cartesian coordinates display format ..............70 6.7.3 Polar coordinates ....................72 6.7.4 Smith circle diagram ....................73 Scale ........................75 6.8.1 Scale/reference level and position ................ 75 6.8.2 Scaling coupling ....................76 6.8.3 Electrical delay ...................... 78 www.siglent.com...
- Page 5 Standards Tab ..................... 107 7.5.4 SOLT Tab ......................109 7.5.5 TRL Tab ....................... 110 7.5.6 Create a custom Cal Kit ..................113 Power Cal ......................117 7.6.1 Internal source power calibration ................ 117 7.6.2 Receiver calibration ..................... 118 Port extension ....................... 119 www.siglent.com...
- Page 6 8.2.5 Multi-peak search ....................143 8.2.6 Multi-target search ....................143 8.2.7 Tracking search ....................143 8.2.8 Bandwidth search ....................144 8.2.9 Notch search ....................... 144 Mathematical operation ..................145 Conversion......................146 Equation editor ..................... 148 Trace statistics ...................... 157 www.siglent.com...
- Page 7 Scale Management ..................... 188 10.6.3 Memory Trace Management ................189 10.6.4 Measure Parameter & Format ................189 10.6.5 Stimulus in Time Domain ..................190 10.6.6 Smoothing ......................191 10.6.7 Trace Allocation ....................191 10.6.8 Trace Setup Coupling ..................192 www.siglent.com...
- Page 8 Source Tab ......................216 11.4.4 Advanced Tab ...................... 218 11.4.5 Trace setup ......................220 11.5 Spectrum Analysis measurement ................. 222 11.5.1 Marker → SA ....................... 222 11.5.2 Channel Power ....................223 11.5.3 ACPR ........................225 11.5.4 Occupied BW ...................... 227 www.siglent.com...
- Page 9 Configure the Material Measurement Setup ............260 15.3.1 Preset Tab ......................260 15.3.2 Measurement Model Tab ..................263 15.3.3 Sample Holder Tab ....................264 15.3.4 Waveguide Gap Correction Tab ................265 15.4 Waveguide TRL Calibration .................. 266 15.5 Sample Measurement ..................269 www.siglent.com...
- Page 10 Help information ....................286 17.5.1 Help and About ....................286 17.5.2 Message Setting ....................287 17.5.3 View Message ..................... 287 17.6 Buzzer ........................287 17.7 Self-Test ........................ 287 17.7.1 Key and touch screen test ................... 287 17.7.2 Performance test ....................288 www.siglent.com...
- Page 11 SNA6000A User Manual 17.8 Options ......................... 293 17.9 External Ports ....................... 293 18 Service and Support ......................294 18.1 Ordering and activating the options ..............294 18.2 Warranty overview ....................295 18.3 Contact SIGLENT ....................295 www.siglent.com...
-
Page 12: Copyright
⚫ Information in this publication replaces all previously corresponding material. ⚫ SIGLENT reserves the right to modify or change parts of or all the specifications or pricing policies at the company’s sole decision. ⚫ Any method of copying, extracting, or translating the contents of this manual is not allowed without the permission of SIGLENT. -
Page 13: Safety Requirement
VNA, the power cord must be removed from the AC socket. Indicates “AC”. Indicates potential damages to the instrument or other property that may happen. CAUTION WARNING Indicates potential injuries or hazards that may happen. www.siglent.com... -
Page 14: Operating Environment
Protection level Class I indicates grounding equipment, it prevents electric shock by connecting the equipment to the ground wire. CAUTION: Do not apply excessive pressure or strike the surface of the touch screen. CAUTION: Do not exceed the maximum voltage marked on the front panel connectors. www.siglent.com... -
Page 15: Cooling Requirement
Please use the power cord provided to connect the instrument to the power source. WARNING: Danger of electric shock! Disconnected or broken internal or external grounding wires will increase the risk of electric shock. It is strictly forbidden to destroy the protective grounding wire or safety grounding terminals. www.siglent.com... -
Page 16: Calibration
If the device is suspected to be damaged, please disconnect the power cord and contact your local SIGLENT office. To operate the instrument correctly, all instructions and marks should be read carefully. -
Page 17: Product Introduction
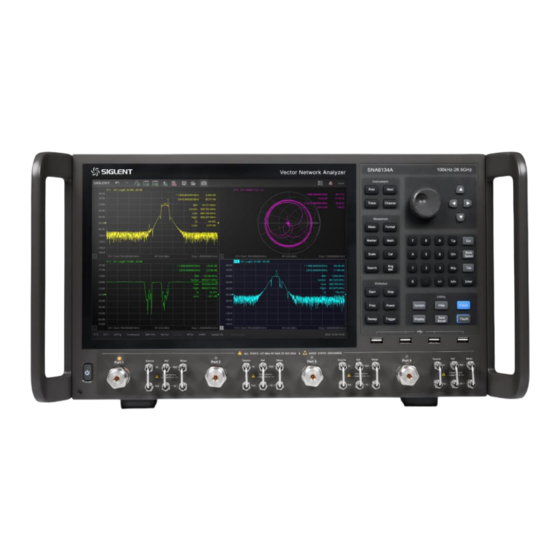
SNA6000A User Manual 3 Product Introduction 3.1 General Description The SNA6000A series of vector network analyzers includes the following models: SNA6022A, SNA6122A,SNA6024A,SNA6124A,SNA6032A,SNA6132A,SNA6034A,SNA6134A.That have a frequency range of 100kHz to 26.5GHz,which support 2/4-port scattering, differential, and time- domain parameter measurements. The SNA6000A series are ideal for determining the Q-factor, bandwidth, and insertion loss of a filter. - Page 18 ◆ Interface: LAN, USB Device, USB Host (USB-GPIB) ◆ Remote control: SCPI / LabVIEW / IVI based on USB-TMC / VXI-11 / Socket / Telnet / Webserver. ◆ Touch control: Multi Touch,Mouse,Keyboard ◆ 12.1-inch touch screen ◆ Video output: HDMI www.siglent.com...
-
Page 19: User Manual Overview
Chapter11. Guide For the SA Option This chapter introduces how to use the SA option. Chapter12. The Frequency Offset Mode This chapter introduces the function of SNA Sources tune to frequencies that are different (offset) from the VNA Receivers. www.siglent.com... - Page 20 Chapter16. External Switch Matrices (SWM Option) This chapter introduces how to use external matrix switch for multi-port expansion. Chapter17. System setting This chapter provides information about the system settings. Chapter18. Service and Support This chapter provides information about service and support. www.siglent.com...
-
Page 21: Quick Start
SNA6000A User Manual 5 Quick Start 5.1 Dimensions Figure 5-1 Front view Figure 5-2 Vertical view www.siglent.com... -
Page 22: Power Supply
SNA6000A User Manual 5.2 Power supply The equipment accepts 100-240V, 50/60Hz AC power supplies. Please use the power cord provided to connect the instrument to the power source as shown in the figure below. Figure 5-3 Power interface www.siglent.com... -
Page 23: Front Panel
The LCD screen is unlikely to suffer from image burn-in. Prev: Make the previous trace/channel/window active. Next: Make the next trace/channel/window active. Instrument Trace: Call up the "Trace" function key menu to manage traces. Channel: Call up the "Channel" function key menu to manage channel. www.siglent.com... - Page 24 Trigger: Set internal and external trigger source, set ext trig output on/off, and set hold, single, continuous trigger,and other methods. System: Set the IP address of the device, display the system date Utility time, set the language, and turn on or off the buzzer. Equipment www.siglent.com...
- Page 25 Enter: Enters the values that you select for the measurement settings. Up/Down buttons: 1. When the focus is on the function key menu, press the up and Navigation down arrow keys to select the function key (the selected menu border is highlighted). www.siglent.com...
-
Page 26: Power Switch
A long press of this button (three seconds) will cause the light to turn orange which indicates the instrument is in the stand-by state immediately without saving the settings. www.siglent.com... -
Page 27: Rf Connectors
The maximum DC input limit of the test port is 35V, and the maximum RF input power is 27dBm. Ensure that static electricity is completely discharged from the human body and device components when operating the equipment. www.siglent.com... -
Page 28: Rear And Side Panels
SNA6000A User Manual 5.4 Rear and side panels Figure 5-9 Rear panel Figure 5-10 Side panel www.siglent.com... - Page 29 A terminal used to connect an external HDMI display device. By connecting the external display device to this terminal, the same HDMI interface information displayed on the host LCD touch screen can be displayed on an external color monitor. Audio interface Audio input and output, Mic input, Audio Output. www.siglent.com...
- Page 30 When the external input reference signal does not exist, the internal frequency reference signal of the vector network analyzer will be automatically used. When the phase of the signal transmitted by the system is locked to an external 10MHz www.siglent.com...
-
Page 31: Ocxo Option Installation Guide
Portable handle, convenient for equipment transportation and Handle transfer. 5.5 OCXO option installation guide 1. After the vector network analyzer is powered off, use a screwdriver to remove the cover at the OCXO option located behind the vector network analyzer. www.siglent.com... - Page 32 2. Insert the OCXO module into the slot of the entire machine and secure it to the rear housing with screws. 3. The vector network analyzer is powered on and the OCXO option can be used normally. Figure 5-11 OCXO option installation guide www.siglent.com...
-
Page 33: User Interface
C. Trace Status Display the current trace status D. Soft Keys Touch screen buttons E. Soft tabs Display parameter format Window number View current window G. Stimulus Range Display the set incentive conditions H. Status Bar Display trigger mode Message Bar Display date and error message www.siglent.com... -
Page 34: Active Entry
A trace is a series of measured data points. Up to 256 traces can be created. In addition, one historical memory trace for each active trace can be stored and displayed. Mathematical operations can be performed on the current trace data and the historical memory trace. www.siglent.com... -
Page 35: Channel State
Displays the phase of the parameter. Displays the delay of the parameter. Delay Smith The parameters are shown in the form of a Smith chart. The parameters are displayed in polar coordinates. Polar The parameters are shown in SWR. www.siglent.com... -
Page 36: Label Page
A Gray dark shaded label represents an unavailable SrcCal selection/option. RF On Internal source output power ON and off, RF ON stands for ON. A display that currently uses an internal or external reference IntRet signal. Update On UI waveform update or not. www.siglent.com... -
Page 37: Message Bar
This feature is great for annotating screenshots and adding important details before saving. ⚫ Graffiti function menu bar Figure 5-13 graffiti function menu bar As shown in Figure 5-13, the graffiti menu contains functions of enable, edit, clear, save and call. www.siglent.com... - Page 38 Text size tool: Set text size (support graphics: text) 10. Background filling tool: Fill graphics background color (support graphics: text, rectangle, ellipse) 11. Border color tool: Set the border color of graphics (support graphics: text, line, rectangle, ellipse, curve) www.siglent.com...
- Page 39 As shown in Figure 5-15, after calling out this interface, you can adjust the corresponding colors of the graphics: Color shade selection tool: Mouse/ finger click to select the appropriate brightness of the color Color selection tool: Select a specific color Color transparency tool: Adjust color transparency (the more right, the lower color transparency) www.siglent.com...
-
Page 40: Theme Management
In the "Theme Management" panel, instrument provides display configuration options for the measurement panel, allowing you to flexibly configure parameters such as trace color thickness, XY axis font style, and view grid style. Figure 5-17 The Measurement Panel A. Trace Title Bar B. Response Axis/Left Axis www.siglent.com... - Page 41 "Window" → "Plot Grid" to enter the plot grid style setting menu, where you can set the grid line style and width. The grid line style menu bar has five styles to choose from: solid, dash, dot, dash- dot, and dash-dot-dot. www.siglent.com...
- Page 42 "Window" → " Stimulus Axis" to enter the stimulus axis style setting menu, where you can set the font size, font style, and font weight of the stimulus axis. 5.6.13.1.6 Trace Line "Window" → "Trace Line" to enter the trace line style setting menu, where you can set the trace line width. www.siglent.com...
- Page 43 Click on "Import" on the bottom right side and select the corresponding file to complete the color configuration in one step; Click on "Export", select the save path and set the file name to save your current color configuration. www.siglent.com...
-
Page 44: Touch Screen
The Help system of the vector network analyzer can provide the Help information of the function keys and menu options on the front panel. Press the Help button on the front panel to enter the Utility menu, click Help to open the Help document, click into the corresponding directory to view the information. www.siglent.com... -
Page 45: Set Up A Measurement
SNA6000A User Manual 6 Set Up a Measurement This chapter introduces in detail each function button on the front panel of SNA6000A series vector network analyzers and the following menu functions. 6.1 Measurement Classes Measurement Classes are categories of measurements that can coexist on a channel. Measurements in a measurement class can not coexist in a channel with a measurement of a different measurement class. -
Page 46: Measurement Parameters
Reflection Measurements Transmission Measurements ⚫ Return loss ⚫ Insertion loss ⚫ ⚫ Transmission coefficient ⚫ Reflection coefficient ⚫ Gain/ loss insertion ⚫ Input impedance ⚫ group delay ⚫ S11, S22 ⚫ Linear phase shift ⚫ electrical delay ⚫ S21, S12 www.siglent.com... -
Page 47: Balanced Measurement
Signal A is fixed at 1V peak ⚫ Signal B is selectable Differential is calculated as A minus B ⚫ ⚫ Common is calculated as the average of A and B Input Signal A and B, A =1V, B=2V Differential=(A-B), Common=(A+B)/2 www.siglent.com... - Page 48 S21 is a ratio measurement of the device Output/ device Input. Mixing this with balanced terminology, we could view the amplifier's Differential Output signal/ Differential Input signal. To see this parameter on the analyzer, we would select an Sdd21 measurement using the following balanced notation: www.siglent.com...
- Page 49 For example, in the following single-ended - balanced formula, Sba indicates the device output port is www.siglent.com...
- Page 50 − �� ���� ���� ImBal1 = − �� − �� ���� ���� �� − �� ���� ���� ImBal2 = − �� − �� ���� ���� Logical Port 1 Logical Port 2 Port c Port a Port b Port d www.siglent.com...
- Page 51 On the measurement balanced parameter TAB interface, click “Change” to set the DUT topology and port mapping relationship. Different DUT topologies lead to different CMRR parameters. www.siglent.com...
- Page 52 Press the “Meas” button on the front panel → Balanced → Topology... , Create or edit DUT Topology and Logical Port Mapping. The port Topology / Logical port Mapping setting dialog box is as below: www.siglent.com...
- Page 53 When the vector network analyzer has four test ports, then all the devices under test with the following four topological relationships can be tested. Balanced 1 Logical port (Balance Port 1) - 2 physical ports (Port1, Port2) www.siglent.com...
- Page 54 2 Logical port (Balance Port 1, Balance Port 2) - 4 physical ports (Port1, Port2, Port3, Port4) Single - Balanced 2 Logical port (Balance Port 1, Balance Port 2) - 3 physical ports (Port1, Port2, Port4) Single-Single-Balanced 3 Logical port (Balance Port 1, Balance Port 2) - 4 physical ports (Port1, Port2, Port4) www.siglent.com...
-
Page 55: Receiver Measurement
D: Measures the signal power entering port 4. 6.2.4 Wave (Receivers notation) Receivers can be also selected using logical receiver notation Press the “Meas” button on the front panel → Wave → Other... to enter the Wave TAB interface. www.siglent.com... - Page 56 When logical port 1 is mapped to physical port 1, it is equivalent to A,1; ⚫ b2,3 Represents Physical port 3 outputs power when the test port receiver of logical port 2 is measured. When logical port 2 is mapped to physical port 2, it is equivalent to B,3; www.siglent.com...
-
Page 57: Ratio
"b2/a1,1" means that the logical source port number is 1, and the logical port ratio 2 measurement receiver/logical port 1 reference receiver. 6.3 Frequency range Frequency range is the span of frequencies you specify for making a device measurement. 6.3.1 Set the frequency range Set the range of RF frequencies. www.siglent.com... -
Page 58: Cw Time Sweep Or Power Sweep
Press Freq use the knob or arrow keys to focus on the Freq → CW parameter entry. Select the edit box to enter the edit mode and change the value by pressing the up and down key, rotating the knob, or pressing the numeric keypad. Press ENTER, the knob, or ESC to exit editing mode. www.siglent.com... -
Page 59: Frequency Resolution
For example, if you want to measure the gain and reverse isolation of a high gain amplifier, the input port of the amplifier requires much less power than the output port. Power sweep can also be performed using uncoupled power www.siglent.com... -
Page 60: Power Leveling And Offsets Overview
On the UI interface, click the cell twice in succession and then enter the value in the pop-up virtual numeric keyboard. Press the Tab key on the front panel to make the focus fall on the cell you want to change, press www.siglent.com... -
Page 61: Sweep
6.5 Sweep Sweeping refers to the measurement of a series of consecutive data points against a series of specified excitation values. 6.5.1 Points Data points are the number of data samples representing the measured values at a single excitation www.siglent.com... -
Page 62: Sweep Type
Press ENTER or Knob to enter the editing state, then move the cursor to the specified position by up and down direction keys or Knob, set the sweep type to the required measurement type, press ENTER or Knob to select the current option. Sweep type: ⚫ Linear Frequency ⚫ Log Frequency www.siglent.com... - Page 63 The frequency range of one segment may not overlap with the frequency range of any other segment. ⚫ The number of segments is limited only by the combined data points of all segments in the sweep. ⚫ The frequency range of one segment may not overlap with the frequency range of any other www.siglent.com...
- Page 64 X-axis ⚫ When X-axis point spacing is used, the X-axis position of each point needs to be selected so that all measurement points are evenly distributed along the X-axis. For example, suppose you have the following two sections: www.siglent.com...
-
Page 65: Trigger
The trigger is the signal that causes the vector network analyzer to carry out the measurement sweep. The vector network analyzer is flexible in the configuration of the trigger function. 6.6.1 Trigger Settings Operating steps: Press Trigger, use the knob or arrow keys to focus on the Trigger parameter item. www.siglent.com... -
Page 66: Trigger Source
All channels: Triggers are sent to all triggerable channels. A trigger will sweep all channels that can be triggered. (Default setting) ⚫ Current channel: Triggers are sent to the current channel but after the current channel completes, the channel increments to the next triggerable channel. www.siglent.com... -
Page 67: Channel Settings
When channel in Hold mode, click the "Restart" does not do anything. Multiple Channels in Continuous mode: The current sweep on the current channel is stopped, and the first channel that can sweep is started. 6.6.5 Trigger mode Operating steps: www.siglent.com... - Page 68 If full 2-port calibration is on, triggering 1 will cause no trace to be updated; Triggering 2 causes all S parameters to be updated. When the calibration is off, triggering 1 will cause S11 and S21 to be updated; Triggering 2 will cause S22 and S12 to be updated. www.siglent.com...
-
Page 69: External And Auxiliary Triggers
(local). The appropriate settings to apply are as follows: Main trigger input: Global/ channel trigger delay - after receiving an external trigger, the start time of the sweep will be delayed by the specified amount of time plus any inherent delay. www.siglent.com... - Page 70 Do not set other trigger settings. The vector network analyzer will start measuring when it receives a valid trigger signal from the specified trigger source: ⚫ Inside: Measurements begin immediately. www.siglent.com...
- Page 71 Each point: When checked, trigger output can be sent for each data point, and when cleared, trigger output can be sent for each sweep. Select “Auxiliary Trigger” - “Global” vector network analyzer preferences, on the “Trigger Settings” tab, the “Dot” Settings are set. After that, this setting applies to all channels. When multiple channels www.siglent.com...
-
Page 72: Data Format
The excitation data (frequency, power, or time) is linearly scaled and displayed on the X-axis ⚫ The measured response data is displayed on the Y-axis Log amplitude scheme: Display amplitude (no phase) ⚫ ⚫ Y: dB ⚫ Typical measurements: Return loss, insertion loss, or gain www.siglent.com... - Page 73 Watts (W, suitable for disproportionate measurements) ⚫ Typical measurements: ⚫ Reflection and transmission coefficients (amplitude), time domain transformation SWR format: ⚫ Displays the reflection measurements calculated from the formula (1+ R) / (1-R), where R is the reflection coefficient www.siglent.com...
-
Page 74: Polar Coordinates
The polar coordinate format is used to view the amplitude and phase of the reflection coefficients in S11 or S22 measurements. You can use a cursor to display the following items: ⚫ Linear or log amplitude (in dB) Phase (in degrees) ⚫ www.siglent.com... -
Page 75: Smith Circle Diagram
In the Smith chart, the linear impedance plane is reshaped to form a cyclic grid from which the resistance and reactance (R+ Jx) can be read. You can use a cursor to display the following items: ⚫ Resistance (in Ohms) ⚫ Reactance as equivalent capacitance (in Ephraeras) or inductance (in Henrys) www.siglent.com... - Page 76 There is also a Reverse Smith circle diagram (also called an Admittance Smith Chart): Same as the standard Smith circle, with the following exceptions: The polar grid is reversed from right to left. ⚫ ⚫ Admittance (in Siemens) instead of resistance. Smith diagram interpretation: www.siglent.com...
-
Page 77: Scale
The lower half is the region where the reactance component is negative and therefore generates capacitance. 6.8 Scale 6.8.1 Scale/reference level and position The “Scale”, “Reference Level”, and “Reference Position” Settings (as well as the format) determine how the data trace will appear on the vector network analyzer screen. Operating steps: www.siglent.com... -
Page 78: Scaling Coupling
Operating steps: Press Scale, use the knob or arrow keys to focus on the Scale → Scale Coupling parameter item. Press ENTER or Knob to enter the editing state, select Off / Window / All, then move the cursor to www.siglent.com... - Page 79 Window: All traces in each selected window are automatically scaled to conform to a common set of scaling factors. ⚫ All: All traces in all selected Windows are automatically scaled to conform to a common set of scaling factors. www.siglent.com...
-
Page 80: Electrical Delay
Press ENTER or Knob to enter the editing state. After the editing is completed, move the cursor to the specified position by up and down direction keys or Knob. Press ENTER or Knob to select the current option. Amplitude deviation: Offset the entire data trace at the specified value. www.siglent.com... -
Page 81: Phase Deviation
After the editing is completed, move the cursor to the specified position by up and down direction keys or Knob. Press ENTER or Knob to select the current option. Range: even numbers from 4 to 30. Divisions do not apply in polar coordinates, Smith chart formats and logarithmic scale type. www.siglent.com... -
Page 82: Scale Type
(the start and stop band of a filter for example), it is important to increase the dynamic range. The noise floor can be reduced by narrowing the IF bandwidth or turning on Sweep Averaging. www.siglent.com... -
Page 83: Averaging
Each tenfold reduction in IF bandwidth lowers the noise floor by 10 dB. However, narrower IF bandwidths cause longer sweep times. IF Bandwidth setting: Using the Softkey for setting: Press the “Avg BW” key, Press “Avg BW” > Averaging > IF Bandwidth > Enter the IF Bandwidth value. www.siglent.com... - Page 84 SNA6000A User Manual Figure 6-8 Set the IF from the menu bar Using a mouse for setting: Click the “BW=xx” icon on the menu bar and select IF Bandwidth. Figure 6-9 Set the IF from the status bar www.siglent.com...
-
Page 85: Smoothing
Do not use smoothing for high-resonance devices, or devices with wide trace variations. It may Smoothing is set independently for each trace. ⚫ 6.10 Preset instructions Invokes preset Settings to restore system Settings to the specified just started state. www.siglent.com... - Page 86 Frequency points Sweeping Sweeping points Sweeping type Linear frequency Sweeping time delay Sweeping mode automatic Trigger Trigger mode continuous Trigger source internal Measurement S parameter Display format Data display format Log Mag Scale Scale 10 dB Reference level 0 dB www.siglent.com...
- Page 87 SNA6000A User Manual reference position Scale coupling Delay time Delay distance Distance unit meter Speed coefficient System impedance 50 Ω Phase deviation 0° Amplitude deviation 0 dB Average Average state Smooth state Calibration Calibration state Unloaded calibration data www.siglent.com...
-
Page 88: Measurement Calibration
DUT. Then, Port match, N-port embedding/ de-embedding, port impedance conversion are used to embed or de-embed expected virtual networks. If balance scattering parameters are measured, balance conversion, differential port match, differential port impedance conversion, common port impedance conversion can be helpful if needed. www.siglent.com... -
Page 89: Calibration Type
Enhanced Response (Thru) 1 → 2 Thru, Isolation (optional) Port2:Open, Short, Load Enhanced Response (Thru) 2 → 1 Port 2 Thru, Isolation (optional) Port1: Open, Short, Load SOLT Port2: Open, Short, Load Thru, Isolation (optional) Port1: Open, Short, Load SOLR Port2: Open, Short, Load www.siglent.com... - Page 90 Application: Calibrate two ports when only one direction (forward or reverse) is needed for measurement. Because no secondary sweep is required, the measurement is faster. ⚫ The reflection calibration element (open, short circuit, or load) is connected to the source port to be calibrated. www.siglent.com...
- Page 91 Required calibration kits: Short circuit, open circuit, and load or ECAL module Corrected system error: ⚫ Directivity ⚫ Frequency response reflection tracking ⚫ Source match Open circuit response / short circuit response: Application: Quick calibration of any test port suitable for reflection measurement only www.siglent.com...
-
Page 92: Checking Calibration Status
Execution Status of Error Correction Accuracy No Cor Error correction: Off (No Correction) Lowest C N-Port Error correction: On (Full N Port Correction) Highest C* N-Port Error correction: On (Interpolation is being executed) Uncertain CΔ N-Port Error correction: On (Stimulus settings change) Uncertain www.siglent.com... - Page 93 "CΔ" appears in the status bar when one or more of the following stimulus settings change. The resulting measurement accuracy depends on which parameter has changed and how much it has changed. For optimum accuracy, recalibrate using the new settings. ⚫ Sweep time ⚫ IF Bandwidth Port power ⚫ www.siglent.com...
-
Page 94: Execution Status Of Error Correction For Each Trace
The following figure shows an example of when the calibration coefficients have been acquired for the full 2-port calibration between test ports 1 and 2, the response calibration for test port 3, and the response calibration (THRU) between test ports 4 and 3. www.siglent.com... -
Page 95: Procedure To Turn On/Off Calibration Property Display
Method 1: Click the channel error correction execution status symbol in the channel status bar to open and close, as shown in the left figure below. Method 2: Press "Cal” on the front panel > Cal > Correction, as shown in the right figure below. www.siglent.com... -
Page 96: Basic Cal
Operating instructions: Press the Cal key, use the knob or the arrow key to make the focus fall on Basic Cal, and press Enter to enter the setting interface of the calibration kit: www.siglent.com... - Page 97 There is no sequence relation between these calibration terms. Simply select the corresponding calibration kit and click the corresponding calibration item menu on the interface. After completion of the corresponding calibration item, the percentage of calibration progress will be www.siglent.com...
-
Page 98: Open Response Calibration
Save State As and enter the file name, and click OK to Save the current calibration Data and the current setting State. Figure 7-5 Calibration wizard interface 7.4.1 Open Response Calibration When a single port is used for open-circuit response calibration, the reflection tracking error in the www.siglent.com... -
Page 99: Short Circuit Response Calibration
Like the open-circuit response calibration, the single-port short-circuit response is connected to the port with the SHORT calibration element, and the reflection tracking error can be calculated. If the LOAD calibration element is used for isolation calibration at the same time, the directional error can also be calculated. www.siglent.com... -
Page 100: Full 1 Port Osl Calibration
Figure 7-7 Schematic diagram Operating steps: Preset Vector network analyzer. Set internal source output power, IF bandwidth, sweep points, test frequency band, and other parameters. www.siglent.com... -
Page 101: Transmission Response Calibration (Two Ports)
Set internal source output power, IF bandwidth, sweep points, test frequency band, and other parameters. Select Cal → Basic Cal to enter the setting interface. Select both Port1 and Port2, select the desired calibration kit in the Cal Kit, select the Type of www.siglent.com... -
Page 102: Enhanced Response Calibration (Two Ports)
6 forward and 6 reverse errors, including directional, source matching, reflection tracking, transmission tracking, isolation (crosstalk), and load matching errors. It is also possible to connect the LOAD element to both ports for isolation calibration. www.siglent.com... - Page 103 Port 2 calibration. According to the interface prompts, connect the THRU calibration kit between the two ports to perform the Thru calibration. After the calibration, click Finish to exit the calibration interface, complete the calibration, and save the calibration data. www.siglent.com...
-
Page 104: Solr Unknown Through Calibration (Two Ports)
TRL calibration scheme will use the THRU straight through calibration element, reflection calibration kit (Open or Short), and a small section of transmission line. Operating steps: Preset vector network analyzer. www.siglent.com... -
Page 105: Partial Overwrite Calibration
Click Overwrite to finish partial overwrite calibration. Notes Uncalibrated ports can’t be calibrated directly using partial overwrite calibration. Partial overwrite calibration requires that sweep points, IF bandwidth, and other parameters are the same as the values set by the previous calibration method. www.siglent.com... -
Page 106: Cal Kit Management
Modifying the THRU definition when performing a calibration for a non-insertable device. ⚫ Performing a TRL calibration. Operation instructions: Press “Cal” on the front panel, Cal > Cal >Cal Kit to enter the Manage Cal Kits page. You can edit, import, and create or delete calibration kits. www.siglent.com... -
Page 107: Connector Tab
At the bottom of each Tab, 'OK' is used to save the edited file, and 'Cancel' is used to close the calibration suite edit session and the file will not be saved. “Help” is used to view the Help www.siglent.com... - Page 108 B. Add: Starts the Add Connector dialog box which allows you to add a new connector type to the calibration kit. C. Select: The selected connector family. D. Frequency Range: Define the lowest and the highest frequency at which the standard is used for calibration. E. Gender: Gendered or Genderless Impedance: Specify the impedance of the standard. www.siglent.com...
-
Page 109: Standards Tab
Allows you to Add, Edit, or Delete Cal standards in a Cal kit. In the “Standard” tab, click “Add” to add the Standard sample. Figure 7-12 add standard interface Standards dialog box help, the following fields apply to ALL standard types. Figure 7-13 The help dialog of the Standard www.siglent.com... - Page 110 Loss: Defines energy loss in Gohms, due to skin effect, along a one-way length of coaxial cable. Open Standard C0, C1, C2, C3: Specify the fringing capacitance. Figure 7-14 Open Characteristics Short Standard L0, L1, L2, L3: Specify the residual inductance. www.siglent.com...
-
Page 111: Solt Tab
Figure 7-17 THRU Characteristics 7.5.4 SOLT Tab Allows you to assign single or multiple standards to SOLT Calibration Classes. For each Cal Kit Class, select Available Standards from the left list, then click >> to copy the standard to the Cal Kit www.siglent.com... -
Page 112: Trl Tab
Allows you to assign single or multiple standards to Calibration Classes. For each Cal Kit Class, select Available Standards from the left list, then click >> to copy the standard to the Cal kit. Use Move Up and Move Down to change the ORDER of the standards. www.siglent.com... - Page 113 If a THRU standard with the correct connectors is NOT available, an adapter removal cal ⚫ can be performed. B. TRL REFLECT ⚫ The REFLECT standard can be anything with a high reflection, as long as it is the same www.siglent.com...
- Page 114 The impedance of the MATCH standard becomes the reference impedance for the measurement. For best results, use the same load on both ports. The load may be defined using the data-based definition, the arbitrary impedance definition, or the fixed load definition. www.siglent.com...
-
Page 115: Create A Custom Cal Kit
There are two methods to create a custom Cal Kit: Method 1: Create custom Cal Kit based on existing Cal kits Press “Cal” > Cal > Cal Kit > F503ME > Save. Select the existing F503ME Cal Kit then save it to a local file named “F503ME123.xkt”. www.siglent.com... - Page 116 SNA6000A User Manual Figure 7-20 Creating a Custom Cal Kit dialog box Figure 7-21 Save the Cal Kit In the Manage Cal Kits dialog box, click “Import” to Import the new calibration “F503ME123.xkt”. www.siglent.com...
- Page 117 SNA6000A User Manual Figure 7-22 Import the new Cal Kit Select the newly imported calibration, click “Edit” to enter the calibration editing interface, and modify the calibration name as “F530ME-ABC”. Figure 7-23 Edit the new import Cal Kit www.siglent.com...
- Page 118 Enter the name and description of the custom Cal Kit. Refer to Method 1, click the Connectors, Standards, SOLT, TRL tab to modify the corresponding parameters. Click “OK” to make the created calibration effective. Figure 7-24 View the newly created Cal Kit www.siglent.com...
-
Page 119: Power Cal
Figure 7-2 Transmitter power calibration Before attempting power calibration, power loss compensation at different frequency points can be set as shown in the figure below. Click “+” successively to add corresponding frequency and loss values. After setting, click OK to save the data. www.siglent.com... -
Page 120: Receiver Calibration
Click OK to complete the calibration and exit the power calibration interface after the measurement is completed. 7.6.2 Receiver calibration The vector network analyzer receiver power has been factory calibrated, but the factory calibration may not guarantee sufficient accuracy in every situation. The user can conduct a receiver power www.siglent.com... -
Page 121: Port Extension
Calibrate R or Calibrate T or Calibrate Both can be clicked to begin receiver calibration. Click OK to complete the calibration and exit the receiver calibration interface. 7.7 Port extension Eliminating the errors of test fixturing can be a difficult task. The port extension function of a vector www.siglent.com... -
Page 122: Manual Port Extension
Input the length of the extended transmission line and the time will be calculated automatically. If the transmission line has loss, the loss of the transmission line can be added, including DC and AC loss. www.siglent.com... - Page 123 DUT. The automatic port extension function is not available in the following cases: The sweep type is set to power sweep. The frequency offset is set to on. Waveguide transmission line port extension. www.siglent.com...
-
Page 124: Automatic Port Extension
It can carry out one of the Open or Short measurements or simultaneously carry out the Open and Short measurements. When two measurements are used, the result will be the average of the two measurements, and the accuracy will be improved www.siglent.com... -
Page 125: Fixture Measurement Function
S2P file by default. In other words, all the uncovered low-frequency parameters are replaced by the first point in the S2P file and all the uncovered high-frequency parameters are replaced by the last point in S2P file making the www.siglent.com... -
Page 126: Port Impedance Conversion
R and JX columns, Then the S parameter displayed will be automatically converted to the S parameter corresponding to the new characteristic impedance. Checking the Enable Port Z Conversion On All Ports tab means port matching is performed on all ports. www.siglent.com... -
Page 127: 2-Port De-Embed
Checking the Reverse Adapter Ports entry represents the part of the reverse connection that will need to be de-embedding. By default, the system reverses the imported S2P file. Click Close to complete the setting and click Apply Fixtures to ON to take effect. www.siglent.com... -
Page 128: N-Port Embedding / De-Embedding
When the frequency range in the S2P file of the imported matching module is less than the frequency range set by the current interface, the system will extrapolate the S2P file by default. In other words, all the uncovered low-frequency parameters are replaced by the first point in the www.siglent.com... -
Page 129: Differential Port Match
Checking the Enable Differential Port Matching tab means that all ports are matched. When the frequency range in the S2P file of the imported matching module is less than the frequency range set by the current interface, the system will extrapolate the S2P file by default. www.siglent.com... -
Page 130: Differential And Common Port Impedance Conversion
Adapters are often used when the network analyzer is used to test the DUT. The vector network analyzer provides the function of removing and inserting adapters. Before the function of removing and inserting adapters is enabled, the vector network analyzer needs to carry out full 2-port calibration. www.siglent.com... -
Page 131: Adapter Removal
Click Next to connect the Open, Short and Load calibration elements in turn for full 1 port calibration. Click Finish to complete the calibration and click Adapter Removal to ON to complete the Adapter Removal operation. www.siglent.com... -
Page 132: Adapter Insertion
ECal module. The analyzer uses this stored data, along with the measured data, to calculate the error terms for a measurement calibration. ECal offers the following advantages: ⚫ The calibration process is simple. The electronic calibrator only needs to be connected to the www.siglent.com... -
Page 133: Ecal Config
D. Characterization. View the characterization information stored in the ECal module Figure 7-15 ECal menu 7.10.2 ECal Config Press “Cal” on the front panel , Press Cal > ECal > ECal to enter the menu interface of ECal setting. www.siglent.com... -
Page 134: Confidence Check
C. When “Orientation” is Auto, click “Next” to enter the automatic alignment directly. When “Orientation” is Manual, click “Next” to specify the calibration port and go to auto-calibration. 7.10.3 Confidence Check Press “Cal” on the front panel, press Cal > ECal > Confidence Check to enter the menu interface of Confidence Check. www.siglent.com... -
Page 135: Orientation
Manual port setting procedure for Full 2-Port calibration Press “Cal” on the front panel, Press “Cal” > ECal > Orientation > Manual. Specify a test port of the VNA. Specify an ECal port for the port of the VNA you specified. www.siglent.com... -
Page 136: Characterization
Figure 7-18 Manual port setting 7.10.5 Characterization Press “Cal” on the front panel, press “Cal” > Cal > Characterization > Factory to view all the parameters of the stored Characterization in the ECal module. Figure 7-19 The factory information of Cal Kit www.siglent.com... - Page 137 SNA6000A User Manual A. The date when the characteristics were measured B. The stimulus conditions when the characteristics were measured C. The information of the Connector type www.siglent.com...
-
Page 138: Data Analysis
(delta) marker. Click Reference Marker in the Marker submenu, select the Off option to delete the Reference Marker. 8.1.3 Marker setting: Press the Marker button on the front panel, set the current marker in the Marker Setup submenu, we can make the following settings for the currently selected marker: Difference (delta) display: www.siglent.com... - Page 139 The newly created marker uses the current trace’s data format by default. To change the data format of the marker, click the Format and select the corresponding data format in the pop-up menu. The following data formats are available: Trace Default Lin Magnitude Log/Phase Phase Lin/Phase Re/Im Delay R+jx Real G+jB Imaginary Log Magnitude www.siglent.com...
- Page 140 Click the Marker Table to select the On state, a table will appear at the bottom left to display all marker’s values, click the Marker Table again to select the Off option to close the marker table. www.siglent.com...
-
Page 141: Marker Display
⚫ Marker → Delay: Referring to the phase slope of the current marker position, the line length is adjusted to the receiver input, this function helps to smooth the phase trace around the current www.siglent.com... -
Page 142: Marker Search Function
Domain command, select the search domain to be deleted in the pop-up menu, then click the Domain command again, and then click Delete in the pop-up menu. If the search domain of the marker is deleted, its search domain is automatically set to full span. www.siglent.com... -
Page 143: Max And Min Search
To set the deviation value, click the Excursion command in the Peak submenu to enter the required value. After determining the effective peak range and search domain, the peak search can be started. There are several peak searching modes available: www.siglent.com... -
Page 144: Target Search
After the target value, transition type and search domain are determined, the target search can be started. The vector network analyzer has the following target search modes: ⚫ Use the Target Search command in the Target submenu to search for the nearest effective www.siglent.com... -
Page 145: Multi-Peak Search
Press the Search button on the front panel, click the Tracking command, and select the search type in the pop-up menu; the search in the tracking mode uses the search parameter settings in the above search. www.siglent.com... -
Page 146: Bandwidth Search
Q and insertion loss of a trace based on the active marker or peak marker position. The notch search function starts from the left side of the active marker position and ends when points that meet the conditions are found. www.siglent.com... -
Page 147: Mathematical Operation
● Data/Memory: Divide the measured data by the data in the stored trace. Thisfunction can be used to calculate the ratio of two traces (such as calculating gain or attenuation), which can also be www.siglent.com... -
Page 148: Conversion
2 × √ �� × �� 0�� 0�� �� − (�� + �� �� 0�� 0�� �� ���� ⚫ Z-Trans-Shunt: Impedance in parallel transmission Z �� �� �� �� ⚫ Y-Reflect: Reflection measurement admittance Y �� �� �� �� www.siglent.com... - Page 149 Y -Trans-Shunt: Admittance in parallel transmission Y �� �� �� �� 2 × √ �� × �� �� − (�� + �� �� �� ���� ⚫ 1/S: Reciprocal of S parameter. ⚫ Conjugation: Convert the measured value to a complex conjugate number. www.siglent.com...
-
Page 150: Equation Editor
1 and subtracting the value of the corresponding S11 data point. For a 201 points sweep, the calculation is repeated 201 times, once per point. In addition, suppose that the vector network analyzer is required to measure the directivity of a 3-port device to be tested, and the directivity is not the www.siglent.com... - Page 151 If the data traces used are from other channels instead of formula traces, these channels must have the same number of data points to be valid channels. ⚫ Functions and Constants: It stores some commonly used functions and constants, as well as www.siglent.com...
- Page 152 Phase (complex a) Returns atan2(a) in degrees Pow (complex a,complex b) Returns a to the power b Re (complex a) Returns the scalar part of a (zeroes the imaginary part) Sin (complex a) Takes a in radians and returns the sine www.siglent.com...
- Page 153 H22 (scalar i, scalar j) returns H22(Sii, Sji, Sij, Sjj) Kfac (complex a, complex b, complex c, k-factor = (1 - abs(a)^2 - abs(d)^2 + (abs(a*d - complex d) b*c)^2)/(2*abs(b*c)) Kfac (scalar i, scalar j) returns kfac(Sii, Sji, Sij, Sjj) www.siglent.com...
- Page 154 Y21 (complex a, complex b, complex c, complex Y21 conversion = (1/Z0)*(-2*b)/((1+a)*(1+d) - b*c) Y21 (scalar i, scalar j) Returns Y21(Sii, Sji, Sij, Sjj) Y22 (complex a, complex b, complex c, complex Y22 conversion = (1/Z0)*((1+a)*(1-d) + b*c)/((1+a)*(1+d) - b*c) www.siglent.com...
- Page 155 �� �� �� ) = ( �� ) ( ( �� ) = ( �� �� �� �� Admittance parameter(Y) �� �� �� �� ) = ( �� ) ( ( �� ) = ( �� �� �� �� www.siglent.com...
- Page 156 ( 1 − �� )( 1 + �� ) + �� �� ( 1 − �� )( 1 − �� ) − �� �� �� ∙ �� ( 1 − �� )( 1 + �� ) + �� �� www.siglent.com...
- Page 157 ) + �� �� �� = �� ∙ ( 1 − �� )( 1 − �� ) − �� �� S parameter convert to basic parameter ( 1 + �� )( 1 − �� ) + �� �� 2 ∙ �� www.siglent.com...
- Page 158 �� −�� �� �� �� �� �� �� −�� �� �� �� �� Description of formula editor’s operator: Operator Description Operator Description plus opening parenthesis minus closing parenthesis multiply comma, parameter separator divide equal power exponent Note: operator priority: www.siglent.com...
-
Page 159: Trace Statistics
Limit table setting Click Math → Analysis → Limit and the pop-up dialog box is shown in the figure below. Limit test, sound type, limit table, global pass/fail can be set in this interface. www.siglent.com... - Page 160 Load table: Call the saved limit table, the saved format of the limit table is CSV by default. Global pass / fail: Pass / fail indicator is a convenient way to monitor all measurement status. Global pass / fail on - Check this box to display the global pass / fail status. www.siglent.com...
- Page 161 Min: Below this limit line, the measurement fails. ⚫ Delete: Delete limit line. Begin stimulus: Frequency of the limit line’s starting point. End stimulus: Frequency of the limit line’s ending point. Begin response: Response of the limit line’s starting point. www.siglent.com...
-
Page 162: Point Limit Test
Click Math → Analysis → Point Limit and the pop-up dialog box is shown in the figure below. Point Limit Test, Sound Type, Point Limit Table can be set in this interface. Figure 8-8 Point Limit test interface Point Limit test: www.siglent.com... - Page 163 Math → Analysis → Limit → Point Limit→ Show Table to open the point limit setting interface, as shown in the figure below. Figure 8-9 Point Limit setting interface Point Limit type: ⚫ Unused: Invalid point limit. ⚫ On: Open point test limit. www.siglent.com...
-
Page 164: Ripple Limit Test
Click Math → Analysis → Limit → Ripple to open the ripple test setting interface, we can set ripple test, sound type, and ripple table in this interface. Figure 8-10 Ripple test setting interface Ripple test: ⚫ Ripple test on: Check this box to set the ripple test to “on” state and display “pass” or “Fail”. www.siglent.com... - Page 165 Math → Analysis → Limit → Ripple → Show Table to open the ripple limit setting interface, as shown in the figure below. Figure 8-11 Ripple limit setting interface Type: ⚫ Unused: Invalid ripple test line. ⚫ On: Open ripple test limit line. ⚫ Delete: Delete ripple test limit line. www.siglent.com...
-
Page 166: Bandwidth Limit Test
Bandwidth test setting Click Math → Analysis → Limit → Bandwidth to open the broadband test setting interface, we can set bandwidth test, sound type, and target bandwidth in this interface. Figure 8-12 Bandwidth test setting interface www.siglent.com... -
Page 167: Time Domain
8.11.1 Transform Click Math → Time Domain → Time Domain Setup → Transform to open the time domain transform setting interface, we can set the start time, stop time, center time, span, transform mode in this interface. www.siglent.com... - Page 168 The simplest way to determine the discontinuities caused by inductors and capacitors in equipment that propagate low frequency signals. ● Bandpass: The simplest method, which can be used with any frequency sweep, it is most useful when measuring devices with limited bandwidth. Capacitance and inductance reactance will not be www.siglent.com...
-
Page 169: Gating
The gating function enables the DUT to be characterized without connectors or adapters. Click Math → Time Gating → Gating Setup → Gating to open the gating setting interface, then we could set the start time, stop time, center time, span, gate type, and gate shape in this interface. www.siglent.com... - Page 170 Notch: Remove response using the gating span. Gate shape: Set the filter characteristics of the gating function. There are four options: minimum, normal, wide, and maximum. The parameter definition of the gating function is shown in the figure below: www.siglent.com...
-
Page 171: Window
The size of the window should be balanced between response resolution and dynamic range. Setting the minimum window can get the best response resolution, and setting the maximum window can get the maximum dynamic range. www.siglent.com... - Page 172 Minimum-maximum: Use the mouse or touch screen to move the slider to change the window size. ⚫ Kaiser Beta: Use the value of Kaiser Beta to change the window size. ⚫ Impulse width: Use the value of impulse width to change the window size. Figure 8-17 Diagram of maximum and minimum window www.siglent.com...
-
Page 173: Coupling
Coupling on: Click to enable coupling. At this time, all measurements in the channel are coupled. The following conversion parameters and gating parameters can be used for coupling. Transform parameters: ⚫ Stimulus: Setting of the start time, stop time, center time, and span. ⚫ State(On/Off): State of the transform. www.siglent.com... -
Page 174: Marker
(Unless the distance marker unit is coupled in the trace coupling box). Click Math → Time Gating → Gating Setup → Marker to open marker setting interface. Set the marker mode, units, and velocity factor in this interface. Figure 8-19 Marker setting interface www.siglent.com... -
Page 175: Advance
0.7 and the corresponding value of vacuum is 1. 8.11.6 Advance Description In time-domain low-pass pulse and step transformation modes, users can choose to use the automatic extrapolation function provided by the instrument to determine the DC component value, or customize the extrapolation value. DC Value www.siglent.com... - Page 176 In addition, the UI also provides convenient input of Open, Short, and Load configuration values, allowing users to freely choose appropriate extrapolation values based on the DUT type. www.siglent.com...
-
Page 177: Save And Recall
CSA file: The calibration data and state file. CSV file: Trace data. ⚫ ⚫ SnP file: Also known as a Touchstone file. It contains the S parameter information. ⚫ PNG /JPG /BMP file: Screenshot/exact copy of the display. Save file: ⚫ Save the status of equipment: www.siglent.com... - Page 178 Recall register data: Use the Recall Register command in Recall submenu to select the register data to be recalled. File management: Click File Browser command to open the file browser, File management can be carried out in the file browser. www.siglent.com...
- Page 179 SNA6000A User Manual Figure 9-9-2 File management interface www.siglent.com...
-
Page 180: Guide For The Tdr Option
Please operate in the bottom toolbar of the TDR menu as far as possible. The function in the TDR option desends on the time domain transform, so changing settings in the right toolbars can lead to incorrect transform results. Don't close the eye diagram module while the eye diagram is drawing, or an unexpected error www.siglent.com... -
Page 181: Open/Close/Preset Tdr Option
If the trial times expire, a permanent license is needed to switch on the TDR option. Figure 10-10-1 TDR Option interface To close the TDR option, use the order Math->TDR->TDR again, then the button “Off” will be selected, www.siglent.com... -
Page 182: Tdr Setup Wizard
The calibration operation will be illustrated in detail in the section “TDR calibration”. If you don't need to finish the setup in the wizard immediately, you can close the wizard. But the www.siglent.com... -
Page 183: Calibration For Tdr Option
SHORT calibration kit to the port to finish the calibration. You can calibrate only one port at a click on the corresponding Port button, but you should finish the calibration of all ports to finish the task in the dialog. www.siglent.com... -
Page 184: Deskew & Loss Compensation
At the third step, you can connect the LOAD calibration element to every port, and click the corresponding Port button to execute the calibration step. The step is optional, so it's not necessary to finish the calibration wizard. www.siglent.com... -
Page 185: Tdr Channel Setup
TDR was opened. The current channel settings can be changed in the TDR toolbar at the bottom of the screen, usually in the Setup tab. www.siglent.com... -
Page 186: Dut Topology
DUT length, and the span of the transformation is automatically calculated by the DUT length when the time domain traces are set in the time axes. It's not recommended to change the sweep settings by other methods. www.siglent.com... -
Page 187: Stimulus Magnitude In Time Domain
Volt. 10.5.4 Port Impedance The port impedance can be set in the Ref. Z textbox in the More Function bar of the Setup tab, which defines the reference impedance to calculate the impedance values of the traces under the www.siglent.com... -
Page 188: Velocity Factor & Dielectric Constant
To enable or disable the average function, click the Averaging checkbox in the Average tar of the Setup tab. The average factor can be set in the textbox to the right of the checkbox www.siglent.com... -
Page 189: If Bandwidth
In addition, there is a set of default trace configurations for every DUT topology. 10.6.1 Select a Trace In addition to clicking the trace or trace information bar on the screen, the Trace pull-down menu at www.siglent.com... -
Page 190: Scale Management
Horizontal is used to set the Horizontal coordinate and the reference point position, Vertical is used to set the Vertical coordinate and the reference value. Users click the corresponding edit box to enter the value through the number button on the front panel. Figure 10-10-9 Scale Setup by manual www.siglent.com... -
Page 191: Memory Trace Management
Impedance and Volt are added. T parameters show the time domain responses, so the values are always real numbers. In the other words, the imaginary parts are always zero. Therefore, Imaginary or phase formats aren't provided for T parameters in the TDR www.siglent.com... -
Page 192: Stimulus In Time Domain
"truncation effect". Applying the Kaiser window lowers the www.siglent.com... -
Page 193: Smoothing
Single-ended 1 Port topology, only the option Mixed is available. To use the trace allocation function, click the button of the corresponding method in the Allocation box in the Trace Control bar of the TDR/TDT tab. Figure 10-10-11 Trace Control Tab www.siglent.com... -
Page 194: Trace Setup Coupling
Notch means that the responses in the gating range will be ignored, while the option Bandpass means that the responses beyond the gating range will be ignored. The scroll-wheel and textbox can be used to change the start and stop position of the time domain gating range. www.siglent.com... -
Page 195: Dc Value
DUT, a peeling algorithm is introduced to reveal the actual impedance value of every point on the passive DUTs. The shortcuts to save/recall the state files, output the trace data to the files, and save the screenshot are provided in the File pull-down menu at the top of the TDR toolbar. www.siglent.com... -
Page 196: Marker Setup
The target relative level of the search can be set in the Position (%) textbox in the dialog. To switch on or off the search, click the △Time Enable checkbox. www.siglent.com... -
Page 197: Peeling
The order Save Trc Data... is used to save the current trace data to .CSV file, and Save SnP... saves all available S parameters data as an .SNP file whose format depends on the DUT topology. Screenshot... is used to save the screenshot as a .PNG file. www.siglent.com... -
Page 198: Eye Diagram Simulation
To start an eye diagram simulation after completing the simulation settings, click the Draw Eye button in the Trigger box of the Eye/Mask tab. 10.8.2 Stimulus Bit Pattern There are 3 bit pattern types to choose in the option: Pseudo-Random Binary Sequence (PRBS), K28.5 comma code, and the user's bit pattern. www.siglent.com... - Page 199 LFSR of n level, to include the worst condition as far as possible. The larger length is selected, the degree of the simulation perfection for intersymbol interference becomes better, but running time becomes longer. www.siglent.com...
-
Page 200: Stimulus Signal Setup
But too small a rise time leads to ringing phenomena at the logic level of the output signal, resulting in the decrease of the eye height. To change the rise time type or value of the input signal, operate the Rise Time pull-down menu or textbox in the Stimulus box. www.siglent.com... -
Page 201: Eye Diagram Analysis
To change the scale or offset values in Manual scale mode, set the value in the Scale/Div or Offset textbox. The Offset value here is the value that the center vertical scale line refers to. Figure 10-10-14 Eye/Mask setting www.siglent.com... -
Page 202: Mask Test For Eye Diagram
Eye/Mask tab, or click the buttons in the Adv Waveform bar of the Setup tab, to open the Advanced Waveform dialog. Click the Jitter button at the top of the dialog to switch to enter the jitter setting interface. www.siglent.com... - Page 203 The probabilities are represented by colors in the statistical eye diagrams: Warm colors indicate a large probability, red represents the largest ones; cold colors indicate a small probability, with deep blue representing the smallest values. www.siglent.com...
-
Page 204: Tdr Advanced Waveform Function
The parameters to adjust the levels of the first bit before or after the edges, and those for the two bits after the edges, are provided in the TDR option and are defined as Pre Cursor, Post 1 Cursor, Post 2 Cursor. By changing these www.siglent.com... -
Page 205: Embedding
The TDR option provides a port de embedding function, which is the same as the port de embedding function in the fixture measurement function. By clicking the Enable button on the left side of the De embedding tab, the TDR option port de embedding function main switch can be turned on/off. www.siglent.com... -
Page 206: Equalization
(CTLE) can be implemented. The CTLE simulation function in the TDR option allows the user to adjust the system function of the equalizer, to simulate the effect of the equalization on the transmission performance in eye diagram simulations. Figure 10-10-18 Equalization setting www.siglent.com... - Page 207 The file format can refer to the following examples: !SIGLENT Technologies !VNA TDR-option Equalization File # Hz dB 1000000000,-1.53E+01,-3.27E-01...
-
Page 208: Hot Tdr
If the zero input response amplitude of the DUT is small, the VNA power level can be appropriately increased without damaging the equipment and DUT, and the response amplitude caused by the VNA test signal can be increased, which can have a certain inhibitory effect on such interference. www.siglent.com... -
Page 209: Usage Guidelines
It can be determined that the device's own signal output causes serious interference to time-domain measurement, and Hot TDR can be used to eliminate it. www.siglent.com... - Page 210 In addition, after changing the DUT length or scanning frequency setting in Hot TDR mode, the original Hot TDR setting becomes invalid and may need to be reconfigured to eliminate the influence of interference signals. Figure 10-19 Hot TDR setting www.siglent.com...
-
Page 211: Guide For The Sa Option
B. Indicate the main working state of state, the port of RF input, Attenuation mode, Average Type, Current Marker operation. C. Display the SA setting dialog box, SA parameter reset, SA processing flow chart D. SA Measurement items. E. Indicate and control the main sweep parameters, such as frequency, resolution. Status bar. www.siglent.com... -
Page 212: Create A Spectrum Analysis Channel
In the interface of the SA channel selection dialog box, the “show setup dialog” check box is selected by default. when user clicks “OK”, a SA Setup dialog box will be displayed that can set related parameters. As figure shown below: www.siglent.com... -
Page 213: Spectrum Analyzer Settings
The SA Tab configures the SA frequency range, CF step, sweep points, RBW, VBW, Average type and RF Input Receiver. The Source Tab is the configuration of signal parameters when uses the internal source for spectrum analysis. The Advanced Tab the configuration of relevant parameters related to signal processing. www.siglent.com... -
Page 214: Sa Setting Tab
The frequency range of a channel can be expressed by three parameters: Start Frequency, Center Frequency and Stop Frequency. If any of the parameters change, the others will be adjusted automatically in order to ensure the coupling relationship among them: www.siglent.com... - Page 215 When Auto mode is selected, the Center frequency step Size is 5% of the current span. That is, ∗ 5% . Each press of the ▲|▼ arrows on the front panel or click the up and down sign �� = �� ���� �������� �������� www.siglent.com...
-
Page 216: Sa Tab Processing Setup
The SA processing setup is to config the signal’s parameters. User can set the parameters via the SA Setup dialog, or by pressing [AvgBW] > BW to enter the spectrum analysis signal processing parameters setting menu, as the shown figure below. Figure 11-5 Spectrum analysis signal processing setup menu www.siglent.com... - Page 217 “Video” because it is the most common display and analysis scale for the video signal within analyzer. This scale is excellent for finding Sine/CW signals near noise. Power Average In this average type, all filtering and averaging processes work on the power (the square of the www.siglent.com...
-
Page 218: Source Tab
The Source Tab of SA Setup is the configuration for internal sources as signal sources. Figure 11-7 Source Tab Port Powers Coupled (checked) the power levels are the same at each test port. Set power at any test port and all test ports change to the same power level. SA Source Setup www.siglent.com... - Page 219 When the internal source is used for the Spectrum analysis signal sources, the sweep type, source frequency and the port power level of the source can also be set by pressing the [Power] key on the front panel to enter the port power setting menu. As the figure shown below: www.siglent.com...
-
Page 220: Advanced Tab
The Advanced Tab is the configuration of parameters related to signal processing for Spectrum analysis. Which can be set through the SA Setup dialog box or by pressing the [AvgBW] > BW on the front panel to enter the setting menu, as the figure shown below. Figure 11-10 Advanced Tab setting menu www.siglent.com... - Page 221 Input attenuation can be set up to Auto, Low Noise and Standard mode. ⚫ Auto: The attenuation value is automatically adjusted according to the state of preamplifier and the current reference level. www.siglent.com...
-
Page 222: Trace Setup
The type identifier is “W”. ⚫ Max Hold Retain the maximum level for each point of the selected trace. Update the data if a new maximum level is detected in successive sweeps. Max Hold is very effective when www.siglent.com... - Page 223 Select an appropriate detector type according to the actual application in order to ensure the accuracy of the measurement The available types are Positive Peak, Negative Peak, Sample, Normal and Average. The default is Normal. www.siglent.com...
-
Page 224: Spectrum Analysis Measurement
The same receiver that is used for the S parameter channel is used for the SA channel. For example, if a marker is opened in the S11 channel, a SA measurement is created using the receiver “A” of port1 after “Marker → SA”. www.siglent.com... -
Page 225: Channel Power
“Channel Power” and click “Meas Setup” to set the corresponding parameters. The two vertical lines on the trace perpendicular to the X-axis represent the integration bandwidth. The Y-axis value is set to the measured power value, and displays on the upper right corner. www.siglent.com... - Page 226 Span of the test channel is adjusted. The channel power is the integral of this frequency span, and the bandwidth of the specified channel is called the integral bandwidth. The value of the integral bandwidth is related to Span but ≤ Span. ⚫ Channel Power: Power within the integration bandwidth. www.siglent.com...
-
Page 227: Acpr
The power of each channel is calculated by the same method as the channel power algorithm. The ratio of the power of the adjacent channel to the power of the main channel is the ratio of the power of the adjacent channel. www.siglent.com... - Page 228 11.5.3.4 Info Table When the information table is “On”, click other menu options and the measurement result table will not be closed. When the status of the information table is “Off”, the measurement result information table will be closed. www.siglent.com...
-
Page 229: Occupied Bw
X-axis represent the occupancy span of the power percentage. The value on the Y-axis is the power occupying the bandwidth, and displays on the upper right corner. Figure 11-15 Occuiped BW measurement www.siglent.com... -
Page 230: Toi
TOI is the function that is automatic measurement of IP3 (Third order Intercept Point), including the power of fundamental wave and the Third order in the power, and calculate the adjustable Intercept Point. After entering the SA mode, select the TOI function, then the measurement is automatically performed without setting parameters. www.siglent.com... - Page 231 Otherwise close the result information table. If all the information of the third-order crossover is successfully calculated, the result information table displays the calculation result of the third-order crossover. Otherwise,” – “is displayed. The result information table contains the following contents: Lower 3 : Low frequency component of TOI. ⚫ www.siglent.com...
-
Page 232: Cnr
11.5.6 CNR 11.5.6.1 CNR Overview Measure the power of the carrier and noise of the specified bandwidth and their ratio. Select CNR measure and click Meas Setup menu to set the corresponding parameters. www.siglent.com... - Page 233 Otherwise close the result information table. ⚫ Carrier Power: the total power of the carrier bandwidth. ⚫ Noise Power: the total power of the selected noise bandwidth. ⚫ Carrier Noise Ratio: the ratio of Carrier Power to Noise Power. www.siglent.com...
-
Page 234: Spectrum Monitor
"Spectrum monitoring" menu to pause the monitoring, and the spectrum monitoring chart will not be refreshed. If the current state is pause, click the "Spectrum monitoring" button to start the monitoring, and the spectrum monitoring chart will continue to refresh after the previous suspended state. www.siglent.com... - Page 235 ⚫ The spectrum monitoring chart is aligned with the frequency of the trace window to indicate the one-to-one correspondence between the spectrum monitoring chart and the frequency. www.siglent.com...
-
Page 236: The Frequency Offset Mode
Power Calibration and Receiver Calibration. 12.2 Frequency Offset Mode Frequency Offset Mode (FOM) enables the SNA internal RF signal source and SNA port receiver to operate at different frequencies. To realize the measurement of nonlinear characteristics of the device. www.siglent.com... -
Page 237: Frequency Offset Settings
Uncouple, then set Sources and Receivers independently. ⚫ Source the internal source signal of the VNA. ⚫ Receivers All receivers that are used in the channel, including Reference receivers, are tuned to the specified frequency settings. C. Mode www.siglent.com... - Page 238 X-Axis Annotation Select the settings to be displayed on the X-Axis. G. X-Axis Point Spacing Only available when a Segment Sweep Type is selected as the X-Axis display. Coupled settings dialog box A. Multiplier Specifies (along with the divisor) the value to multiply by the stimulus. The value is www.siglent.com...
- Page 239 A. Sweep Type The settings dialog box is vary depending on the sweep type. B. Frequency Type Select Start / Stop or Center / span. C. Start Freq Enter values. D. Stop Freq Enter values. E. Sweep Point (Primary only) Enter number of data points for the sweep. www.siglent.com...
- Page 240 ⚫ Independent IF Bandwidth and Independent Sweep Time are available ONLY on the Primary (channel) and the Uncoupled Receivers - NOT Sources. ⚫ Independent Power is available ONLY on the Primary (channel) and the Uncoupled Sources - NOT Receivers. www.siglent.com...
-
Page 241: Scalar Mixer Measurements(Smm Option)
Press [Meas] >S-Params > Mode > SMM. The SMM channel selection dialog box will displayed after the SMM measurement mode was selected. Select “Active Channel” (delete the existing measurement) or “New Channel” then click OK. A Scalar mixer measurement is displayed on the current channel or on a new channel and New Window. www.siglent.com... - Page 242 In the interface of the SMM channel selection dialog box, the “Mixer Measure dialog” check box is selected by default. when user clicks “OK”, a SA Setup dialog box will be displayed that can set related parameters. As figure shown below: Figure 13-2 Mixer Measure Setup dialog www.siglent.com...
-
Page 243: Configure The Scalar Mixer Setup
Although you will soon become comfortable navigating these tabs, at first it may be best to complete the dialog in the following order: Enter the Mixer Measure Setup dialog box Select Sweep tab settings. Select Power tab settings. Select Mixer Frequency tab settings. Select Mixer Setup tab settings. www.siglent.com... -
Page 244: Sweep Tab-Mixer Measure Setup Box
Select the frequency range for displaying the sweep parameters (input, output, LO) on the X- axis. X-Axis Point Spacing Available only with Segment Sweep. Sweep Point: The number of data points that the analyzer measures across a sweep. IF Bandwidth: The received signal is converted from its source frequency to a lower intermediate www.siglent.com... -
Page 245: Power Tab-Mixer Measure Setup Box
DUT Output Port: Select the VNA port that is connected to the DUT Output then Set the power level to the DUT Output port. DUT Input and Output Port Power Sweep: Available when Power (sweep) is selected on the Sweep tab. And the Start and Stop Power editing boxes can be edit. www.siglent.com... -
Page 246: Mixer Frequency Tab-Mixer Measure Setup Box
Difference ( - ) of the Input and LO frequency. E. Calculates Input frequency settings based on your other mixer settings. For example, enter the Output frequency range and LO frequency range, then press “Calc Input”. The VNA will calculate and display the Input frequency. www.siglent.com... - Page 247 13.2.3.2 Segment Sweep Mixer Frequency setting The following settings appear on the Mixer Frequency tab when Segment Sweep is selected on the Sweep tab. Figure 13-6 Segment Sweep Mixer Frequency Tab How to configure a segment using the GUI: www.siglent.com...
- Page 248 One of the input frequency, LO frequency, and output frequency of DUT must be a fixed frequency range, or all three of them must be a fixed frequency range ● The input or output frequency cannot exceed the VNA frequency range www.siglent.com...
-
Page 249: Mixer Setup Tab-Mixer Measure Setup Box
E. Add External Source. Connect the External Source device to any USB port of the VNA by the USB cable, then click “External Source”, after the VNA identifies the External Source, the external source information will displayed in the External Source dialog box. When LO selects a www.siglent.com... - Page 250 Result : Output Start Freq: 3.5GHz, Output Stop Freq 1.5GHz. Example 2: Use the fractional multipliers to tune the VNA receiver frequency to the second harmonic of the mixer's 8 GHz fundamental output. The input, LO, and output frequencies are known. www.siglent.com...
- Page 251 Having done this, the VNA can accurately calculate the receiver frequency. The input and LO frequencies are known. Enter these settings in the Mixer Setup dialog box: ⚫ Input Start Freq : 50MHz ⚫ Input Stop Freq : 100MHz ⚫ LO Fixed Freq : 600MHz www.siglent.com...
-
Page 252: Do The Source Power Cal Of The Smm Mode (Optional)
Therefore, scalar-mixer calibration allows you to correct the error term that resides in a full 2-port error model by using the error model and an expression based on a new concept. You can correct the following error elements by using the scalar-mixer calibration. www.siglent.com... -
Page 253: Procedure Using Mechanical Calibration Kit
Mixer Calibration > Mixer calibration... Enter the mixer calibration wizard interface, default Port1 and Port2 calibration, connect the calibration kit according to the wizard instructions, click the corresponding kit name on the UI to calibrate the scalar mixer. Figure 13-8 The interface of Scalar Mixer Calibration www.siglent.com... -
Page 254: Checking Calibration Status
After the mixer calibration is complete, the trace status area of the UI displays the type of error calibration that has been performed. For example, the mixer has performed full two-port calibration and the trace calibration status identifier displays “[F2]”. Figure 13-9 Calibration Status www.siglent.com... -
Page 255: Pulse Measurement (Pm Option)
PM option, an information dialog will appear to notify you that the trial times will decrease. If the trial times expire, a permanent license is needed to switch on the PM option. Figure 14-1 The Pulse Measurement setting interface www.siglent.com... -
Page 256: Pulse Measurement Settings
Pulse Profile: Pulse profile measurements provides a time domain (CW frequency) view of the pulse envelope. Figure 14-2 Profile Pulse Point Point Step enable Sweep 14.2.2 Pulse Timing PLL Locked Delay1 Delay2 IFBW OFF Delay3 Config Source Pulse Pulse Pulse Width: Sets the width of the source pulse (Ts1). www.siglent.com... -
Page 257: Properties
Delay1 Delay2 IFBW OFF Delay3 Config Source Pulse Pulse Measurement Delay: ⚫ Standard Pulse: Receiver delay (Td0). ⚫ Pulse Profile: Disabled and has no practical significance. Measurement Width: Receiver pulse width (Ts0), whose value depends on the selected IFBW www.siglent.com... -
Page 258: Rf&If Path Gain Dialog
Receiver: Choose the receiver to be set. Path Gain: ⚫ Low: The minimum attenuation mode, the average noise level is lower. ⚫ Medium: The medium attenuation mode, the average noise level is normal. ⚫ High: The maximum attenuation mode, the average noise level is higher. www.siglent.com... - Page 259 SNA6000A User Manual Couple all paths: Check to make the same setting for all receivers. www.siglent.com...
-
Page 260: Material Measurement (Mt Option)
VNA port, the VNA should be fully preheated before the material is measured, and the following steps are carried out to realize the material measurement: Create a MT measurement; Configure the Material Measurement Setup; Do the waveguide TRL calibration in material measurement mode; www.siglent.com... -
Page 261: Create A Mt Measurement
In the interface of the MATERIAL channel selection dialog box, the “Show Setup Dialog” check is selected by default. when user clicks “OK”, a Material Measurement Setup dialog box will be displayed that can set related parameters. As figure shown below: www.siglent.com... -
Page 262: Configure The Material Measurement Setup
You can call up the Material Measurement Setup dialog box by pressing 【Meas】> Meas Setup > Meas Setup. 15.3 Configure the Material Measurement Setup Material Measurement Setup dialog box interface has four tabs: Preset tab, Measurement Model tab, Sample Holder tab and Waveguide Gap Correction tab. 15.3.1 Preset Tab www.siglent.com... - Page 263 IFBW: Set the IF bandwidth. ⚫ ⚫ Power: Set the power level. Quick Setting: Quickly set relevant parameters according to the information of waveguide holder. Click Lookup… to jump to the Lookup Table tab dialog box, select and set relevant parameters of www.siglent.com...
- Page 264 Start/Stop Freq.: Start/Stop frequency. Cut-off Freq.: Cut-off frequency. Air Gap Params.: Air gap parameter. When checked, the width of waveguide holder will be displayed according to the selected waveguide holder. www.siglent.com...
-
Page 265: Measurement Model Tab
Verify Estimate: Indicates the initial estimated value, which is only displayed under the Ref/Tran ε Precision measurement model. ➢ Premittivity: Indicates the dielectric constant of the material, and is used to set the initial estimated value of the dielectric constant of the material. www.siglent.com... -
Page 266: Sample Holder Tab
Reverse Only: Use the transmission coefficient and reflection coefficient of the reverse port to calculate material parameters. 15.3.3 Sample Holder Tab The sample holder tab interface allows you to define sample holder and sample. Figure 15-7 Sample Holder Tab www.siglent.com... -
Page 267: Waveguide Gap Correction Tab
Cutoff Frequency: The cutoff frequency of the waveguide, which will be automatically calculated according to the waveguide width. ⚫ Waveguide Width: Waveguide width. ⚫ Find: Give the information of all optional waveguides, and select the corresponding waveguide item to quickly set the information of waveguides. 15.3.4 Waveguide Gap Correction Tab www.siglent.com... -
Page 268: Waveguide Trl Calibration
TRL calibration scheme will use the THRU straight through calibration element, reflection calibration kit (Open or Short), and a small section of transmission line. www.siglent.com... - Page 269 Figure 15-10 Calibration Wizard Interface Connect waveguide coaxial adapters to Port1 and Port2 respectively, and the calibration plane A and the calibration plane B are directly connected together and fixed with screws. Click Thru to complete the through calibration of Port1 and Port2; www.siglent.com...
- Page 270 Connect the 1/4Line calibration element between the calibration plane A and the calibration plane B, fix it with screws, and click the corresponding Line item to complete the calibration of Port1 and Port2 transmission lines; Figure 15-12 Calibration Wizard Interface www.siglent.com...
-
Page 271: Sample Measurement
Quick Setting; Calibrate the vector network analyzer; Put the sample to be tested into the holder, and connect the sample holder to the calibration reference plane and fix it with screws, as shown in the following figure: www.siglent.com... - Page 272 Set the sample holder, sample and waveguide related parameters on the interface of Sample Holder tab and Waveguide Gap Correction tab; When measuring the permittivity, set the measurement mode to ε and the data format to the Real. The measurement results are shown in the following figure: www.siglent.com...
- Page 273 When measuring magnetic permeability, the Measurement Model should be set to Ref/Tran μ&ε, the measurement mode should be set to μ, and the data format should be set to Real. The measurement results are shown in the following figure: www.siglent.com...
- Page 274 SNA6000A User Manual Figure 15-16 Permeability Measurement Results (PEI Material) www.siglent.com...
-
Page 275: External Switch Matrices (Swm Option)
16.2 External Matrix switches Introduction The firmware of the SNA6000A series is able to control switch matrices from SSM5000A directly. It is fast and easy to set up and operate a switch matrix via the graphical user interface. For example, an SNA6134A in combination with an SSM5144A can seamlessly work as a multiport network analyzer with up to 24 ports. -
Page 276: Matrix Setup Step
1. Power on the SSM5144A and the SNA6134A, Connect the SSM5144A to the SNA6134A with a USB cable, and then a message of “The switch matrix plugged in” will displays on the SNA6134A message bar if the SSM5144 is recognized success. www.siglent.com... - Page 277 SNA6000A User Manual 2. Press the System >”External Ports” >”Ext Port Enabled” to enable the function, then the matrix identifier is displayed on the upper right corner of the UI. www.siglent.com...
-
Page 278: Define The Rf Configuration
And physical Port4 (D) of the VNA connects to RF input port 1D of the SSM. If you want to customize the RF Port connection between the VNA and the SSM, click the corresponding edit box under the A/B/C/D tab and select the port in the “Select Port” dialog box. As shown below: www.siglent.com... - Page 279 1B, 2B, 1C, 2C, 1D, 2D. : Represents the RF output port of the matrix switch. : the “Reset” in the Switch Matrix check box indicates that the default port number assignment is restored for the switch port of the matrix. www.siglent.com...
-
Page 280: Setting S Parameters
Receiver Port and Source Port drop-down lists. For example, S0512 is select the “5” as the receiver port and the ”12” as the source port, or click the "Edit..." under the Measure dialog box. To enter the input edit box, enter "0512", and select S0512. www.siglent.com... -
Page 281: Calibrate And Measure
DUT. The VNA expansion ports only supports the VNA measurement mode. Note: In order to obtain more accurate measurement results, the DUT should be fully preheated before measuring. Note: The machine should be fully preheated before measuring the DUT in order to obtain more accurate measurement results. www.siglent.com... -
Page 282: System Setting
Figure 17-1 System setting interface www.siglent.com... -
Page 283: System Configuration
Use the Date & Time command in the System submenu to set the date/time. You can set whether to display the date/ time and display the format at the bottom right of the screen and modify the date/ time value. www.siglent.com... -
Page 284: Screenshot Setting
17.1.6 System language The Language command in the Language submenu can be used to change the language of the equipment. Simplified Chinese and English are supported. 17.1.7 Power This menu provides shutdown and restart operation buttons. www.siglent.com... -
Page 285: Communication Interface Setting
17.2.1 LAN Status We can select static or dynamic allocation of LAN-related parameters. Use LAN Status command in System submenu to set LAN parameters. The SNA6000A series supports dual port configuration, as shown in the following renderings: Figure 17-3 Vertical view and rear panel 17.2.2 mDNS Setting... -
Page 286: Vnc Setting
The Reset menu button can restore the Web password to the default state. 17.2.6 GPIB Use the GPIB command in the System submenu to set the GPIB port number. 17.2.7 External Device Displays information about external devices connected to the analyzer. www.siglent.com... -
Page 287: Preset
User Preset: Use the User Preset command to specify the user preset status information file. Confirm Preset: Use the Confirm Preset command to set whether to confirm before reset. Power On Option: Use the Power On Option command to set the default source of equipment reset when the equipment starts. www.siglent.com... -
Page 288: Factory Reset
Configuration files and User data If user select both, the equipment is restored to the factory default state and deletes the files saved to local by users. 17.5 Help information 17.5.1 Help and About In the Help submenu, we can open the help document (Help command) or view the equipment information (About command). www.siglent.com... -
Page 289: Message Setting
17.7 Self-Test 17.7.1 Key and touch screen test In the Self Test submenu, we can perform keyboard self-test (Key Test command), touch screen self-test (Touch Test command), screen self-test (Screen Test command) and LED self test (LED Test command). www.siglent.com... -
Page 290: Performance Test
SNA6000A User Manual 17.7.2 Performance test 17.7.2.1 Enter VNA Test Dialog Method Press the Utility key of front panel → Self Test → Performance Verification... 17.7.2.2 VNA Test Dialog UI Description www.siglent.com... - Page 291 E. Test result (Pass/Fail) 17.7.2.3 Task Process Description SNA performance veriflaction mainly includes Quick PV, PV and Adjustment. 17.7.2.3.1 Quick PV Needed equipment: ⚫ Calibration Kits (Short, Load) Adjustment Process: Enter Quick PV tab page Select the test port www.siglent.com...
- Page 292 10 dB attenuator × 1 ⚫ Coaxial cable × Several ⚫ Calibration Kits (2-port machine: Open × 1+Short × 1+Load× 2; 4-port machine: Open × 1+Short × 1+Load × ⚫ Adapter × Several Adjustment Process: Enter adjustment tab page. Select all calibration items. www.siglent.com...
- Page 293 Adapter × Several PV Process: Enter PV tab page. Select all test items. Click Start button to begin PV tests. Follow the tips to complete the PV process. Click test item Export Report... button to save the report. (Optional) www.siglent.com...
- Page 294 Press the Cal key of front panel→ Cal → Factory Cal... Tips: Factory mode, VNA use factory calibration data. When the check box is checked, VNA will use user calibrated calibration data. After the user performs factory calibration, this check box will be automatically selected. www.siglent.com...
-
Page 295: Options
Press Enter to confirm your input and terminate the license key input. Or load the .lic file and press “Scan U-disk” to select the corresponding .lic file in the memory. 17.9 External Ports Used to define external logical port, source port, reference receiver port and test receiver port. www.siglent.com... -
Page 296: Service And Support
18.1 Ordering and activating the options There are two ways for you: Pre-activate the options by SIGLENT factory. If you order a instrument and options, SIGLENT factory will activate the options for you before delivery. Post-activate the options by yourself. -
Page 297: Warranty Overview
SIGLENT will provide repair or replacement service according to the detailed provisions of the warranty. For service or a complete copy of the warranty, please contact your nearest SIGLENT sales and service office. SIGLENT makes no other warranty, express or implied, except as provided in this summary or the applicable warranty, including but not limited to the implied warranty of merchantability and special applicability. - Page 298 SNA6000A User Manual Europe: SIGLENT Technologies Germany GmbH Add: Staetzlinger Str. 70 86165 Augsburg, Germany Tel: +49(0)-821-666 0 111 0 Fax: +49(0)-821-666 0 111 22 Email: info-eu@siglent.com Website: www.siglenteu.com www.siglent.com...
- Page 299 DC power supplies, electronic loads and other general purpose test instrumentation. Since its first oscilloscope was launched in 2005, SIGLENT has become the fastest growing manufacturer of digital oscilloscopes. We firmly believe that today SIGLENT is the best value in electronic test & measurement. Headquarters: SIGLENT Technologies Co., Ltd...
Need help?
Do you have a question about the SNA6000A Series and is the answer not in the manual?
Questions and answers