Advertisement
Quick Links
Advertisement

Related Manuals for AMS AS7058


Summary of Contents for AMS AS7058
- Page 1 Sensing is life AS7058 Evaluation Kit Quick Start Guide v1.00 27/04/2023...
- Page 2 AS7058 Evaluation Kit Quick Start Guide AS7058 EVK Software Installation How to Use AS7058 PC Software Logging Data FW Upgrade...
- Page 3 – AS7058 EVK Mainboard – Microcontroller Board with USB & BLE interface – Optical Stack – Micro USB cable – 3x GSR Samples – 5x BioZ Samples (“CAL BIOZ” for BioZ Calibration) Fig. 1: AS7058 Evaluation Kit out of the box...
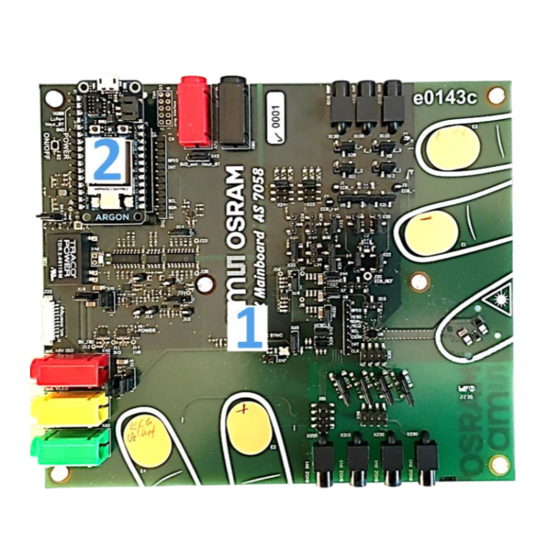
- Page 4 6 & 9 measurement – Optical Stack for PPG – AS7058 Sensor – External BioZ Connector – External 5V0 power supply, LED Power Supply & GND ports – External Sensor Interface – Electrical Isolation Fig. 2: AS7058 Evaluation Kit top view...
-
Page 5: Installation
To install, start the installer executable and follow the instructions as shown in Fig. 3 below (from left to right). Fig. 3: AS7058 Software Installation Steps Note: The EVK software is available for download. Please contact the ams OSRAM support team (support_aws@ams-osram.com) for the download link. -
Page 6: Getting Started
The green LED (H1) on the mainboard will light up as soon as the board is powered. Afterward, start the EVK GUI software. AS7058 EVK Mainboard On/Off Button (S2) ON: Press the button for a few Sec OFF: Press the button for a few Sec Fig. 4: AS7058 Evaluation Kit power ON... -
Page 7: Gui Overview
AS7058 PC Software GUI Overview The Graphical User Interface (GUI) consists of seven main segments (Fig. 5): Device Connection • Device Connection: To connect the AS7058 EVK to the Configuration Presets software. Sensor Configuration • Configuration Presets: A few configuration presets are Register Map provided to help the user quickly start using the device. - Page 8 AS7058 PC Software GUI Overview – Device Connection Tab After launching the EVK GUI, the “Device Connection” tab is displayed. Device Connection The GUI has two ways to communicate with the device: Wired connection via the micro USB connector. Wireless connection via the BLE (refer to page...
- Page 9 These can be chosen from the “Configuration Presets” Tab. Each file comes with a description, letting the user know what measurements can be done using them: • AS7058 EVK: SpO2 on finger - SpO2 monitoring on the finger at a PPG sampling frequency of 100 Hz. The SpO2 result is not calibrated. Configuration •...
- Page 10 GUI Overview – Sensor Configuration Tab The device parameters can be configured in the Sensor Configuration tab. This tab presents the various functional blocks of the AS7058 as separate rectangular blocks. After choosing a configuration preset, the enabled blocks are Sensor Configuration highlighted in green, and the disabled blocks are shown in grey.
- Page 11 AS7058 PC Software GUI Overview – Register Map Tab To check the current register Map, click on the Register tab. In the Register Map window: • The register values can be updated. • New register values can be entered. To save the current register map, click on Save to file.
- Page 12 ACC data and the sampling frequency. • Chip Library: A driver which handles communication with the AS7058 AFE and is used to configure the Applications device and perform measurements. • Software AGC (PD Offset & LED Control): The...
- Page 13 Software and vital signs application related parameters can be found under the Applications tab (Fig. 10). • Application Manager: This connects the Chip Library with the included Bio Applications. It receives measurement data from the AS7058 Chip Library and combines it with accelerometer data.
- Page 14 AS7058 PC Software GUI Overview – Measurement Tab A measurement can be started after setting the parameter for a specific application. Click on the “Start Measurement” button to run the sensor module and observe the “Chip Events”, “Application Output”, and “AGC Status” (Fig. 11).
- Page 15 AS7058 PC Software GUI Overview – About Tab This About tab provides the software name, software version number, python package version number, copyright information, and the ams OSRAM company link. About Fig. 12: Overview of the GUI - About...
-
Page 16: Measurement Conditions
AS7058 EVK Finger Positioning on the Optical Stack & Electrodes Fix The Optical Stack Fig. 13: Finger positioning for PPG, ECG, EDA & BioZ measurements on the AS7058 Place the evaluation kit on the table or flat surface. ... - Page 17 AS7058 PC Software Starting a PPG/Finger Measurement for HRM & RRM Firstly, press the S2 sensor button for 1 second to power on the sensor. Afterward, connect the AS7058 EVK via the correct COM port or BLE number. After successfully connecting, the USB or BLE icon will change color to green.
- Page 18 AS7058 PC Software Starting a PPG/Finger Measurement for SpO2 Firstly, press the S2 sensor button for 1 second to power on the sensor. Afterward, connect the AS7058 EVK via the correct COM port or BLE number. After successfully connecting, the USB or BLE icon will change color to green.
- Page 19 AS7058 PC Software Starting an ECG Raw Data Measurement Firstly, press the S2 sensor button for 1 second to power on the sensor. Afterward, connect the AS7058 EVK via the correct COM port or BLE number. After successfully connecting, the USB or BLE icon will change color to green.
- Page 20 AS7058 PC Software Starting an PPG & ECG Raw Data Measurement Firstly, press the S2 sensor button for 1 second to power on the sensor. Afterward, connect the AS7058 EVK via the correct COM port or BLE number. After successfully connecting, the USB or BLE icon will change color to green.
- Page 21 The jumper settings should be set as below: Open pin X51 completely; (1-2;3-4; 5-6 and 7-8) Close pins JP35, 36, 37 and 39. Fig. 18: BioZ Measurement steps Note: For more details, please refer to the ams OSRAM AS7058 BioZ Application Note document.
- Page 22 BioZ Measurement Steps Firstly, press the S2 sensor button for 1 second to power on the sensor. Afterward, connect the AS7058 EVK via the correct COM port or BLE number. After successfully connecting, the USB or BLE icon will change color to green.
- Page 23 AS7058 PC Software BioZ Calibration and Measurement In the measurement stage, the impedance and Impedance scaling values are considered for the calibration. Click the Measurements tab, followed by the Start Measurement button. After clicking the “Start Measurement” button, the software performs the calibration.
- Page 24 Sample Board ams OSRAM provides three sample boards for EDA testing with the resistance details. To set up the AS7058 for EDA measurement, perform the steps below. Connect the reference board to X30 (Fig. 21). Then, connect the sample boards for EDA application to the X30 connector as shown in Fig.
- Page 25 EDA Measurement Steps Firstly, press the S2 sensor button for 1 second to power on the sensor. Afterward, connect the AS7058 EVK via the correct COM port or BLE number. After successfully connecting, the USB or BLE icon will change color to green .
- Page 26 AS7058 PC Software EDA Measurement In the measurement stage, the impedance scaling values are considered for the measurement. To perform EDA measurements, follow the steps below: Click the “Start Measurement” button, to start the measurement. In the application output window, test board resistance and conductance values will be seen.
- Page 27 AS7058 Plotting Plot Area Selection Right click any of the signal legend Fig. 24: Plotting • When “Automatic Scaling” is enabled, the minimum and maximum values of the y-axis are automatically set. • The display area can show a maximum of three plots. By default, the plot area displays all the signals in one plot.
- Page 28 AS7058 SW Enhancement Filter To Improve Waveform Visualization in the Evaluation Software Fig. 25: Enhancement Filter The enhancement filter consist of selectable: Baseline removal: This removes the DC component of the signal. Denoising: This includes filters to remove the 50Hz/60Hz line frequency and other high frequency noises from the signal.
- Page 29 Fig. 26: Update Firmware via the GUI Fig. 28: Firmware update in progress After a successful update, the red and multicolored LED will turn green again. Note: The latest firmware is available for download. Please contact the ams OSRAM support team (support_aws@ams-osram.com) for the download link.
- Page 30 Sensing is life...
Need help?
Do you have a question about the AS7058 and is the answer not in the manual?
Questions and answers