
Related Manuals for ProfiTap ProfiShark 100M


Summary of Contents for ProfiTap ProfiShark 100M
- Page 1 ProfiShark 100M ProfiShark 1G ProfiShark 1G+ ProfiShark 10G ProfiShark 10G+ USER MANUAL...
- Page 2 If you have any questions, visit our Knowledge Base: https://kb.profitap.com/ You can also contact us through our website: https://www.profitap.com/contact-us/ Or directly by email: support@profitap.com For the latest documentation and software, visit our Resource Center: https://resources.profitap.com/...
-
Page 3: Table Of Contents
1.2.5. ProfiShark 10G+ 1.3. Specifications 1.4. Advanced Timestamping 1.5. Interfaces & LED Behavior 1.5.1. ProfiShark 100M Interface 1.5.2. ProfiShark 100M LED Behavior 1.5.3. ProfiShark 1G Interface 1.5.4. ProfiShark 1G LED Behavior 1.5.5. ProfiShark 1G+ Interface 1.5.6. ProfiShark 1G+ LED Behavior 1.5.7. - Page 4 3.1.8. Features Tab Status Firmware Update Capture Format Firmware Selection 3.1.9. Capture Tab 3.1.10. Capture Control 3.2. Live Capture 3.2.1. Live Capture with Wireshark Extcap Tool 3.2.2. Live Capture with Wireshark Dissector 3.3. Long-Term Capture Legal Disclaimer Copyright Trademarks...
-
Page 5: Overview
ProfiShark 100M features a fully-passive in-line design, with the network link galvanically separated from the traffic capture system, making it inherently fail-safe and having the same effect on the network link as a patch cable. -
Page 6: Package Contents
1.2. Package Contents Note: Please contact the supplier if any part is missing or damaged. 1.2.1. ProfiShark 100M ● ProfiShark 100M main unit ● Transport pouch ● Ethernet cat6a cable (2 m) ● USB 3.0 cable (1.8 m) ● USB key (software, drivers, documentation) ●... -
Page 7: Specifications
1.3. Specifications ProfiShark 100M ProfiShark 1G ProfiShark 1G+ ProfiShark 10G ProfiShark 10G+ 2 x RJ45 Ethernet 2 x RJ45 Ethernet 2 x RJ45 Ethernet 2 x SFP+ Ethernet 2 x SFP+ Ethernet Capture Interface 10/100M 10/100/1000M 10/100/1000M 1/10G 1/10G Capture Output, Management Interface, 1 x USB 3.0... -
Page 8: Advanced Timestamping
-40 to +80 °C -40 to +80 °C -40 to +80 °C -40 to +80 °C -40 to +80 °C Storage Temperature -40 to 176 °F -40 to 176 °F -40 to 176 °F -40 to 176 °F -40 to 176 °F 0 to +50 °C 0 to +50 °C 0 to +50 °C... -
Page 9: Interfaces & Led Behavior
1.5. Interfaces & LED Behavior 1.5.1. ProfiShark 100M Interface 1, 2 RJ45 Ethernet port A and B 3, 6 Link/Activity LEDs 4, 5 Speed LEDs Power LED Optional DC power input (5V, 1A, center positive) USB 3.0 port type B... -
Page 10: Profishark 100M Led Behavior
1.5.2. ProfiShark 100M LED Behavior LED state Meaning 3 and/or 6 steady green The port is linked. 3 and/or 6 blinking green The port is linked and has RX/TX activity (traffic is passing through). 4 steady green ProfiShark operating at 10 Mbps speed. -
Page 11: Profishark 1G Interface
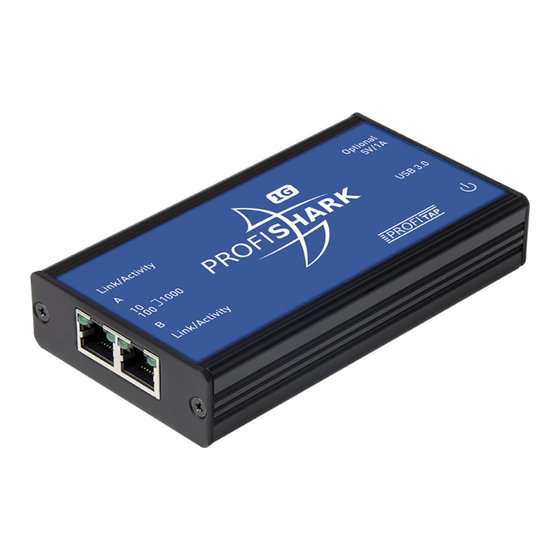
1.5.3. ProfiShark 1G Interface 1, 2 RJ45 Ethernet port A and B 3, 6 Link/Activity LEDs 4, 5 Speed LEDs Power LED Optional DC power input (5V, 1A, center positive) USB 3.0 port type B... -
Page 12: Profishark 1G Led Behavior
1.5.4. ProfiShark 1G LED Behavior LED state Meaning 3 and/or 6 steady green The port is linked. 3 and/or 6 blinking green The port is linked and has RX/TX activity (traffic is passing through). 4 steady green ProfiShark operating at 10 Mbps speed. 5 steady green ProfiShark operating at 100 Mbps speed. -
Page 13: Profishark 1G+ Interface
1.5.5. ProfiShark 1G+ Interface 1, 2 RJ45 Ethernet port A and B 3, 6 Link/Activity LEDs 4, 5 Speed LEDs Power LED Optional DC power input (5V, 1A, center positive) USB 3.0 port type B SMA female connector (PPS in/out) SMA female connector (GPS/GLONASS antenna) Sync LED... -
Page 14: Profishark 1G+ Led Behavior
1.5.6. ProfiShark 1G+ LED Behavior LED state Meaning 3 and/or 6 steady green The port is linked. 3 and/or 6 blinking green The port is linked and has RX/TX activity (traffic is passing through). 4 steady green ProfiShark operating at 10 Mbps speed. 5 steady green ProfiShark operating at 100 Mbps speed. -
Page 15: Profishark 10G Interface
1.5.7. ProfiShark 10G Interface 1, 2 SFP+ port A and B 3, 4, 5, 6 SFP and network status and activity LEDs Power LED Optional DC power input (5V, 1A, center positive) USB 3.0 port type B... -
Page 16: Profishark 10G Led Behavior
1.5.8. ProfiShark 10G LED Behavior LED state Meaning 3+4 and/or 5+6 orange No SFP module present or detected. 3+4 and/or 5+6 green slow blink No link. 3+4 and/or 5+6 red Connect additional power. 4 and/or 6 green SPAN mode, link up. 4 and/or 6 green fast blink SPAN mode, traffic activity. -
Page 17: Profishark 10G+ Interface
1.5.9. ProfiShark 10G+ Interface 1, 2 SFP+ port A and B 3, 4, 5, 6 SFP and network status and activity LEDs Power LED Optional DC power input (5V, 1A, center positive) USB 3.0 port type B SMA female connector (PPS in/out) SMA female connector (GPS/GLONASS antenna) Sync LED... -
Page 18: Profishark 10G+ Led Behavior
1.5.10. ProfiShark 10G+ LED Behavior LED state Meaning 3+4 and/or 5+6 orange No SFP module present or detected. 3+4 and/or 5+6 green slow blink No link. 3+4 and/or 5+6 red Connect additional power. 4 and/or 6 green SPAN mode, link up. 4 and/or 6 green fast blink SPAN mode, traffic activity. -
Page 19: Getting Started
3. Wait for the installation to complete. 4. Launch the ProfiShark Manager via the shortcut created in the start menu. 2.1.2. Linux ProfiShark drivers and software can be installed using our repository located at https://ubuntu.profitap.com/. Supported distributions: ● Ubuntu 20.04 ●... -
Page 20: Macos
This repository will be updated nightly, and will contain the latest driver version built against the latest kernel releases. If you cannot find the package corresponding to your kernel version, please contact support@profitap.com. You can install the ProfiShark Manager software with the following command:... - Page 21 The Driver Control tool will open, allowing installation or uninstallation of the system extension (driver). Click the "Install" button. You may be asked by macOS to allow the system extension in the "Privacy & Security" configuration.
- Page 22 Once the system extension is installed, reboot the host. Connected ProfiShark devices should now be detected and displayed in the ProfiShark Manager.
- Page 23 To install new ProfiShark Manager versions, the previous ProfiShark Manager and driver should be uninstalled first: 1. From the ProfiShark Manager's "Home" tab, start the Driver Control tool using the "Manage system extension" button. 2. Click the "Uninstall" button. 3. Close both the Driver Control tool and the ProfiShark Manager. 4.
-
Page 24: Synology Nas
2.1.4. Synology NAS DSM 6.1 and 6.2 1. Open the Package Center from the Synology DSM interface. 2. Click "Manual Install" in the upper right-hand corner. 3. Select the .spk file corresponding to the Synology architecture from the ProfiShark USB key. 4. -
Page 25: Esxi
You should expect the following output: Reboot the NAS and run the package. 2.1.5. ESXi Currently, ESXi up to version 6.5 is supported. Disable the new USB driver from VMware (see https://kb.vmware.com/s/article/2147650) with the following SSH command: esxcli system module set -m=vmkusb -e=FALSE Reboot. -
Page 26: Analysis Software
2.2. Analysis Software 2.2.1. Analyzer All industry standard analyzers are supported and can be used to perform the analysis. Wireshark is recommended, and can be downloaded at wireshark.org. To start capturing network data, launch the preferred network analyzer and select the ProfiShark device, which should appear in the list of network interfaces. - Page 27 The dissector can be enabled or disabled in Wireshark through the following menu path: Edit -> Preferences -> Protocols -> ProfiShark. Linux In the ProfiShark USB key's 'Linux/Dissector Wireshark/' directory, run the following commands: sudo dpkg -i /path/deb/file sudo apt-get install -f The dissector can be enabled or disabled in Wireshark through the following menu path: Edit ->...
-
Page 28: Hardware Setup
2.3. Hardware Setup Connect the line to be monitored to the ProfiShark's network ports. Connect the ProfiShark to the computer using the supplied USB 3.0 cable. Note: Connecting to a USB port of specification lower than USB 3.0 may result in data drops, due to bandwidth limitations. -
Page 29: Capture Guide
3. Capture Guide 3.1. ProfiShark Manager ProfiShark Manager is a standalone application designed and developed by Profitap. It provides means for statistical analysis of a network prior to a deeper investigation using an analyzer. It also provides options for port diagnostic, port control, timestamping, and traffic capture. - Page 30 ProfiShark 10G / 10G+ The Counters tab displays 15 customizable counters for both SFP+ ports. Each counter can be configured to register packets matching a specific filter when passing through either SFP+ module.
- Page 31 Edit button Opens the configuration window for this counter. The counter ignores that frame characteristic. These frames will show in the counter. The counter filters out the matching frames. These frames will not show in the counter. The counter only counts the frames matching this specific filter. IPv4 / IPv6: If checked, only packets originating from or destined to the specified IPv4 / IPv6 address will be taken into account.
-
Page 32: Charts Tab
Displays traffic statistics in a graphical representation of the frames matching the configured filter. 3.1.2. Charts Tab ProfiShark 100M / 1G / 1G+ The Charts tab offers a view of the same statistical information as the Counters tab, plotted over time, for a better overview of the data flow. -
Page 33: Sfp Tab
3.1.3. SFP Tab ProfiShark 10G / 10G+ The SFP Tab provides real-time information about the connected SFP+ modules, offering an overview of their general capabilities and real-time sensors. The Ports Control section allows switching between SPAN mode and In-Line mode by ticking or unticking the Span Mode checkbox. -
Page 34: Traffic Logs Tab
3.1.4. Traffic Logs Tab The Traffic Logs tab allows users to monitor network ports events. ProfiShark 100M / 1G / 1G+ Monitor link status, bandwidth usage and CRC error rate for ports A and B. For bandwidth usage and CRC error rate, an entry is added every time the specified threshold is exceeded. -
Page 35: Network Ports Tab
3.1.5. Network Ports Tab ProfiShark 1G / 1G+ The Network Ports tab allows the customization of port settings for the ProfiShark 1G/1G+, and offers an overview of the ports' status and link capabilities. When the ProfiShark ports are set to In-Line Mode (Span Mode option unchecked), devices connected through ports A and B can communicate. - Page 36 Span Mode Checking this option tells the ProfiShark to intercept a separate data stream for each port. Each port can be controlled independently. Unchecking the option sets the ProfiShark to In-Line Mode. Loopback This feature is only available for ProfiShark 10G. Auto negotiation This feature tries to link the two network devices on the highest possible speed out of those selected for each port (1000TX-FD, 100TX-FD/HD, 10TX-FD/HD).
-
Page 37: Filters Tab
3.1.6. Filters Tab ProfiShark 10G / 10G+ The Filters Tab gives access to the ProfiShark 10G/10G+ hardware filters and deep packet inspection (DPI) feature. When enabled, only the packets matching the criteria configured in these filters and DPI will be captured in Live Capture and Direct Capture. -
Page 38: Timing Tab
3.1.7. Timing Tab ProfiShark 1G+ / 10G+ The Timing tab displays settings and information related to the advanced timestamping features. Control Timestamp initialization Sets the source for timestamping at startup: GPS / RTC / System time. If "Do not initialize" is selected, it will start from Epoch 0 (1970). Wait for sync If enabled, traffic capture is only allowed after timestamp synchronization has been completed. - Page 39 Status GPS module detected If green, the GPS antenna has been detected by the ProfiShark. GPS fix If green, the GPS connection is stable. If yellow, the GPS connection is close to being stable. GPS PPS If green, the GPS link is stable enough for the PPS chip to start the synchronization. External PPS If green, an external PPS is detected, bypassing the internal PPS.
-
Page 40: Features Tab
3.1.8. Features Tab The Features tab contains information about the device, the firmware update utility, and options for enabling and disabling capture-related features. Status In the Status section, the Device tab displays hardware and software information about the connected ProfiShark device, and the Status tab displays the current status of its network interface. Device The connected ProfiShark model. -
Page 41: Capture Format
Enable timestamps in Appends a Unix formatted timestamp in the header of the packet data. This timestamp can be interpreted by the Profitap Wireshark dissector in Live Capture mode. live capture Note: This option produces non-standard PCAP files, which require the dissector for timestamps to be interpreted properly. -
Page 42: Firmware Selection
Firmware Selection The Firmware Selection section allows users to switch between 10 Gbps and 1 Gbps firmware for the ProfiShark 10G and 10G+, effectively altering the operating speed of the connected SFP+ modules. Note: Switching between firmware versions takes between 4 and 8 seconds to complete, during which the network connection will be severed. -
Page 43: Capture Tab
3.1.9. Capture Tab ProfiShark can capture traffic without the need for third-party capture software. This Direct Capture is performed at the driver level, prior to all network stacks and frame processing. Direct Capture provides the best performance, enabling small packet capture at wire speed. The Capture tab contains the controls for the Direct Capture feature. -
Page 44: Capture Control
Current Buffer: If dropped packets start to appear ("Dropped" statistic), increase the Buffer size value. Buffer size In high bandwidth utilization scenarios, a larger buffer size accommodates more data to be temporarily stored into the computer’s memory before being saved to the file, helping to avoid captured data being dropped. -
Page 45: Live Capture
ProfiShark with the storage capabilities of a NAS, it becomes possible to capture traffic for extended periods of time, making it easier to catch intermittent network problems in the act. The ProfiShark USB key package (included with the product, and also available at resources.profitap.com) provides packages for various Synology architectures. - Page 46 Device status Displays the connected TAP and its MAC address. Capture status Specifies whether the capture process is in progress. Total captured Displays the total amount of data captured. Dropped by software Displays the amount of packets dropped due to performance issues or buffer overflow. Inline ports By default, the ProfiShark ports are set to In-Line Mode, meaning that devices connected through ports A and B can communicate.
-
Page 47: Legal
Neither this manual, nor any of the material contained herein, may be reproduced without written consent of the author. Trademarks The trademarks mentioned in this manual are the sole property of their owners. Profitap HQ B.V. High Tech Campus 84 5656AG Eindhoven The Netherlands sales@profitap.com www.profitap.com © 2023 Profitap — v1.0...
Need help?
Do you have a question about the ProfiShark 100M and is the answer not in the manual?
Questions and answers