Table of Contents
Advertisement
Quick Links
Advertisement
Table of Contents

Related Manuals for ProfiTap IOTA 1G


Summary of Contents for ProfiTap IOTA 1G
- Page 1 IOTA 1G IOTA 1G+ IOTA 10G IOTA 10G+ USER MANUAL IOTA software version: v3.0.0...
- Page 2 If you have any questions, visit our Knowledge Base: https://kb.profitap.com/ You can also contact us through our website: https://www.profitap.com/contact-us/ Or directly by email: support@profitap.com For the latest documentation and software, visit our Resource Center: https://resources.profitap.com/...
-
Page 3: Table Of Contents
1. Product Overview 1.1. Hardware Overview 1.2. Specifications 1.3. Interfaces & LED Behavior 1.3.1. IOTA 1G Interface 1.3.2. IOTA 1G LED Behavior 1.3.3. IOTA 1G+ Interface 1.3.4. IOTA 1G+ LED Behavior 1.3.5. IOTA 10G Interface 1.3.6. IOTA 10G LED Behavior 1.3.7. - Page 4 4.1.2. Bandwidth Analysis 4.1.3. Capture Files Export 4.2. Interface Configuration 4.2.1. Port Control IOTA 1G / 1G+ IOTA 10G / 10G+ 4.2.2. Port Status 4.2.3. Capture Features IOTA 1G / 1G+ IOTA 10G / 10G+ 4.2.4. Advanced Timestamp 4.2.5. SFP 4.2.6.
-
Page 5: Product Overview
Designed as a secure and flexible analysis solution, IOTA is a great asset to get access and visibility into industrial or enterprise level networks. Profitap IOTA is used by network administrators and IT analysts to get a fast and clear overview of the network traffic. This means a comprehensive analysis can be performed quickly, helping engineers get to the root cause in a matter of clicks. -
Page 6: Specifications
1.2. Specifications IOTA 1G IOTA 1G+ IOTA 10G IOTA 10G+ 2 x RJ45 Ethernet 2 x RJ45 Ethernet 2 x SFP+ Ethernet 2 x SFP+ Ethernet Capture Interface 10/100/1000M 10/100/1000M 1/10G 1/10G In-Line Mode Dual SPAN Inputs Mode 1G: 380 ± 8 ns 1G: 380 ±... -
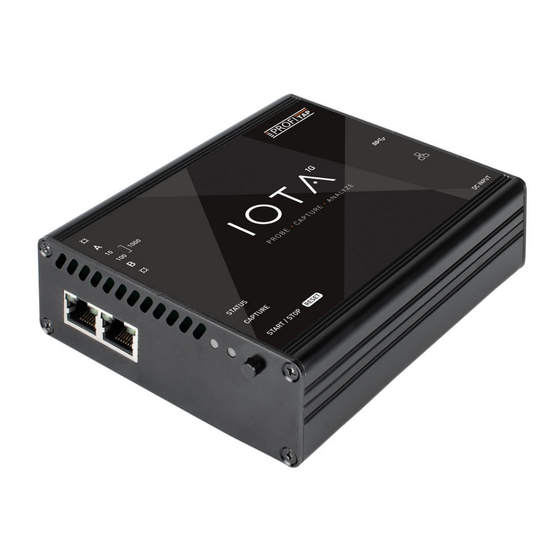
Page 7: Interfaces & Led Behavior
1.3. Interfaces & LED Behavior 1.3.1. IOTA 1G Interface 1, 2 RJ45 Ethernet port A and B START/STOP/RESET button 4, 5, 6, 7 Network status and activity LEDs Status LED Capture LED 12 VDC power input (12V model) 24-48 VDC power input (24V model) RJ45 Management port (PoE+) 2 x USB 3.0 port type A... -
Page 8: Iota 1G Led Behavior
1.3.2. IOTA 1G LED Behavior LED state Meaning 4 and/or 7 steady green The port is linked. 4 and/or 7 blinking green The port is linked and has RX/TX activity (traffic is passing through). 5 steady green Capture interface operating at 10 Mbps speed. -
Page 9: Iota 1G+ Interface
1.3.3. IOTA 1G+ Interface 1, 2 RJ45 Ethernet port A and B START/STOP/RESET button 4, 5, 6, 7 Network status and activity LEDs Status LED Capture LED 12 VDC redundant power inputs (12V model) RJ45 Management port (PoE+) USB 3.0 port type A... -
Page 10: Iota 1G+ Led Behavior
1.3.4. IOTA 1G+ LED Behavior LED state Meaning 4 and/or 7 steady green The port is linked. 4 and/or 7 blinking green The port is linked and has RX/TX activity (traffic is passing through). 5 steady green Capture interface operating at 10 Mbps speed. -
Page 11: Iota 10G Interface
1.3.5. IOTA 10G Interface 1, 2 SFP+ port A and B START/STOP/RESET button 4, 5, 6, 7 SFP and network status and activity LEDs Status LED Capture LED 12 VDC power input (12V model) 24-48 VDC power input (24V model) RJ45 Management port (PoE+) 2 x USB 3.0 port type A... -
Page 12: Iota 10G Led Behavior
1.3.6. IOTA 10G LED Behavior LED state Meaning 4+5 and/or 6+7 orange No SFP module present or detected. 4+5 and/or 6+7 green slow blink No link. 4+5 and/or 6+7 red Connect additional power. 5 and/or 7 green SPAN mode, link up. 5 and/or 7 green fast blink SPAN mode, traffic activity. -
Page 13: Iota 10G+ Interface
1.3.7. IOTA 10G+ Interface 1, 2 SFP+ port A and B START/STOP/RESET button 4, 5, 6, 7 SFP and network status and activity LEDs Status LED Capture LED 12 VDC redundant power inputs (12V model) RJ45 Management port (PoE+) USB 3.0 port type A SMA female connector (PPS in/out) SMA female connector (GPS/GLONASS antenna) Removable SSD... -
Page 14: Iota 10G+ Led Behavior
1.3.8. IOTA 10G+ LED Behavior LED state Meaning 4+5 and/or 6+7 orange No SFP module present or detected. 4+5 and/or 6+7 green slow blink No link. 4+5 and/or 6+7 red Connect additional power. 5 and/or 7 green SPAN mode, link up. 5 and/or 7 green fast blink SPAN mode, traffic activity. -
Page 15: Getting Started
5 UTP cables, rated for Gigabit operations. Note: When deploying IOTA 1G/1G+ in-line, connect it to the network prior to powering it in order to make full use of its fail-safe capabilities. This step is critical to verify the availability of the in-line path in case of... -
Page 16: Iota 10G / 10G
2.1.2. IOTA 10G / 10G+ Insert the cables of the line to be monitored in the SFP modules. In the case of LC optical fiber cables, make sure to match the Tx-Rx / Tx-Rx signal direction at the other end. Note: Due to the nature of SFP modules requiring power for operation, IOTA 10G/10G+ doesn't include a bypass feature for fail-safe monitoring. -
Page 17: Iota Rackmount Models
2.1.3. IOTA Rackmount Models The rackmount models can be mounted in a standard 19" rack, using the Profitap Rackmount Chassis Kit (sold separately; reference: ARKB-1U). Secure the chassis to the rack using the provided screws, then insert the IOTA and secure it to the chassis using the thumbscrews on the front panel of the device. -
Page 18: Powering Up The Device
2.2. Powering Up the Device Connect the 12V/2.5A DC power supply, or the 24–48VDC terminal block, depending on the IOTA model. IOTA can also be powered via PoE+ over the management port by connecting it to a PoE+ switch. Connect both power port and PoE+ management port for redundant powering, ensuring continued operation in case either port were to be disconnected or unable to provide power. -
Page 19: Swapping Ssd
2.4. Swapping SSD IOTA 1G+ / 10G+ The procedure for swapping the SSD is as follows: ● Power off the device ● Unscrew the front panel drawer ● Remove the drawer ● Remove the SSD ● Install the new SSD in the drawer ●... -
Page 20: Iota Configuration
3. IOTA Configuration 3.1. Time Settings The IOTA Settings > Time Settings page allows the configuration of the system date, time, time zone, and NTP service. The NTP service is enabled by default, and can be disabled or enabled on this page. NTP servers can be added, modified, or removed. -
Page 21: Network Configuration
3.2. Network Configuration Navigate to IOTA Settings > Network Configuration to modify the IOTA network settings. The IP address, network mask, gateway and DNS server can be set manually if Method is set to Static. If Method is set to DHCP Dynamic, IOTA will attempt to receive network settings from a DHCP server. -
Page 22: Access / Internal Firewall
3.3. Access / Internal Firewall 3.3.1. Firewall Local Access When enabled, connections to the IOTA user interface from the subnetwork IOTA is located on are accepted. When disabled, they are rejected. Remote Access When enabled, connections to the IOTA user interface from subnetworks other than the one IOTA is located on are accepted. -
Page 23: Zerotier
Password Specifies the password for the 802.1x EAP-MD5 server. CA Certificate The CA certificate file (Certificate Authority) in PEM format for the 802.1x EAP-TLS server (optional). Client Certificate The client certificate file in PEM format for the 802.1x EAP-TLS server. Private Key The private key certificate file in PEM format for the 802.1x EAP-TLS server. -
Page 24: Firmware & License
If IOTA can access the internet, the latest available version number and changelog are fetched automatically and displayed, and the IOTA software can be updated via the Cloud Update button. If the device cannot access the internet, the latest IOTA software can be downloaded from https://iota.profitap.com/ and updated via the File Update button. -
Page 25: Administration
The procedure is as follows: 1. Retrieve the v2.2.2 or v2.2.3 release file from https://iota.profitap.com/release/. 2. Update your IOTA device using this file by clicking the File Update button and selecting the file. -
Page 26: Logs
3.7. Logs 3.7.1. Logs Click the System Logs button to download the system logs, which contains all of the embedded OS activity. Click the Application Logs button to download the application logs, which contains the activity of the IOTA-specific software. 3.7.2. -
Page 27: Capture Guide
4. Capture Guide 4.1. Capture Control The Capture > Capture Control page contains information and options regarding the capture of traffic, analysis of captured traffic, and exporting of capture files. Traffic capture (capture interfaces) and traffic analysis (traffic flow analyzer) can be controlled independently. -
Page 28: Traffic Flow Analysis
4.1.1. Traffic Flow Analysis The traffic flow analyzer is by default configured to be subscribed to process the new capture files. This means that any time a new PCAPNG is created, it will be added to the analyzer queue. Using the Unsubscribe/Subscribe button of the Traffic Flow Analysis section, it is possible to stop the analyzer from processing new files, without impacting the capture. -
Page 29: Interface Configuration
If IOTA is intended to be used in-line, the appropriate configuration must be set. In-Line mode is the default mode (Inline Mode checkbox ticked). IOTA can be set to SPAN mode by unticking the Inline Mode checkbox. IOTA 1G / 1G+ Port speed and behavior can be set on this screen. IOTA 10G / 10G+ Loopback mode can be enabled when SPAN mode is enabled (Inline Mode checkbox unticked) by ticking the Loopback checkbox. -
Page 30: Port Status
4.2.2. Port Status IOTA 1G / 1G+ This tab provides an overview of the Link Partner Status and Fault Status for both ports A and B. -
Page 31: Capture Features
This tab allows the configuration hardware capture settings. The available settings depend on the IOTA model. Features can be enabled and disabled by ticking or unticking the related checkboxes. IOTA 1G / 1G+ Keep CRC32 The CRC32 information (32-bit Frame Check Sequence) located at the end of the packets will be kept in the capture. -
Page 32: Iota 10G / 10G
IOTA 10G / 10G+ Keep CRC32 The CRC32 information (32-bit Frame Check Sequence) located at the end of the packets will be kept in the capture. Disable Port A Frames from port A will not be captured. Disable Port B Frames from port B will not be captured. -
Page 33: Advanced Timestamp
4.2.4. Advanced Timestamp IOTA 1G+ / 10G+ Time Source Select the source from which the time will be used for timestamping: ● System: Use the system time and ignore any PPS signal coming from the PPS port. ● System PPS: Use the system time and synchronize it with the PPS signal coming from the PPS port (if present). -
Page 34: Sfp
4.2.5. SFP IOTA 10G / 10G+ This tab provides SFP information for both port A and B. -
Page 35: Filters
4.2.6. Filters IOTA 10G / 10G+ The hardware filters in the Filters tab allow you to include or exclude packets based on their type. Selected packet types will be included in the capture, and unselected packet types will be excluded. The Filtering section allows filtering on Ethernet MAC, IPv4/6 addresses, and TCP/UDP ports, on source, destination, both, or either. -
Page 36: Capture Interface Firmware
4.2.7. Capture Interface Firmware The Capture > Interface Configuration > Firmware page contains information about the capture interface's firmware, and provides the ability to update it. The latest capture interface firmware version is always included when updating the IOTA firmware. The update is not performed automatically. On the Interface Configuration dashboard, compare the HW Firmware Version with the Available Firmware Version. -
Page 37: Data Vault
Note: Make sure the appropriate settings have been applied in Capture > Interface Configuration before deploying the IOTA in the network you want to analyze. 4.4. Data Vault 4.4.1. Captured Files Navigate to Data Vault > Captured Files to download or delete raw PCAPNG files, or to add them to the analyzer queue. -
Page 38: Storage Management
4.4.2. Storage Management Navigate to Data Vault > Storage Management to get an overview of the storage usage, including total storage size and available storage space. Automatic Cleanup Capture data rotates once storage usage reaches 80%. If the Cleanup Metadata option is enabled, older capture files and their metadata are deleted. -
Page 39: Capture Export
Note: Deletion of the indexed metadata in a time range will require more system resources and time. This may impact GUI performance, especially if a new capture is started while cleanup is in progress. 4.4.3. Capture Export Navigate to Data Vault > Capture Export to configure the export settings of the capture file export engine. The engine can be started or stopped via the Subscribe/Unsubscribe button. -
Page 40: Importing A Pcap-Ng File
4.4.4. Importing a PCAP-NG File PCAPNG and PCAP capture files can be imported via the Import button. Imported files are stored on the device and automatically added to the traffic analyzer and bandwidth analyzer queues. The capture analysis and the PCAP import analysis are running in parallel without impacting each other. The analyzer queues can be deleted via the Delete buttons. -
Page 41: Analysis Guide
5. Analysis Guide 5.1. Dashboard Overview [1] Click the IOTA logo or Dashboards menu item to navigate to the home dashboard with filters and time range reset to default. [2] The name of the current dashboard. [3] Click the trash can button to clear all filters. [4] Set filters here. -
Page 42: Traffic Filtering
5.2. Traffic Filtering Filters can be defined manually by clicking the + icon next to the Filters box, then selecting the filter type and value it needs to filter on. Clicking the + icon next to an existing filter will add an AND filter. Clicking the + icon next to an OR box will add an OR filter. -
Page 43: Pcap File Download
5.3. PCAP File Download PCAPNG files can be downloaded using the following methods: ● "Download PCAP" button in the top right corner of any dashboard Use the "Download PCAP" button to download the PCAPNG file of the traffic for the selected time range. The following filters also apply to the downloaded PCAPNG files: IP address, MAC address, VLAN ID, Protocol, Port. -
Page 44: Legal
Neither this manual, nor any of the material contained herein, may be reproduced without written consent of the author. Trademarks The trademarks mentioned in this manual are the sole property of their owners. Profitap HQ B.V. High Tech Campus 84 5656AG Eindhoven The Netherlands sales@profitap.com www.profitap.com © 2023 Profitap — v3.7...
Need help?
Do you have a question about the IOTA 1G and is the answer not in the manual?
Questions and answers