SIGLENT SDS7000A Series User Manual
Digital oscilloscope
Hide thumbs
Also See for SDS7000A Series:
- Quick start manual (28 pages) ,
- Quick start manual (48 pages)
Table of Contents
Advertisement
Quick Links
Advertisement
Table of Contents

Related Manuals for SIGLENT SDS7000A Series


Summary of Contents for SIGLENT SDS7000A Series
- Page 1 SDS7000A Series Digital Oscilloscope User Manual EN01A...
-
Page 3: Table Of Contents
6. QUICK START ......................... 22 6.1. MECHANICAL DIMENSION ....................22 6.2. FRONT PANEL OVERVIEW ....................23 6.3. REAR PANEL OVERVIEW ....................24 6.4. SIDE PANEL OVERVIEW ..................... 25 6.5. CONNECTING TO EXTERNAL DEVICES/SYSTEMS ............26 6.5.1. POWER SUPPLY ........................26 int.siglent .com... - Page 4 SDS7000A User Manual 6.5.2. PROBES ..........................26 6.5.3. LAN ............................27 6.5.4. MULTIPLE DISPLAYS ......................27 6.5.5. MOUSE AND KEYBOARD ....................27 6.5.6. AUXILIARY OUTPUT ......................28 6.5.7. REFERENCE INPUT AND OUTPUT ..................28 6.5.8. WAVEFORM GENERATOR ....................28 6.5.9. LOGIC PROBE ........................
- Page 5 16.5.12.NTH EDGE TRIGGER ......................97 16.5.13.DELAY TRIGGER ......................... 97 16.5.14.SETUP/HOLD TRIGGER ...................... 98 16.5.15.SERIAL TRIGGER ........................ 98 16.6. TRIGGER SOURCE ......................99 16.7. HOLDOFF ........................... 100 16.8. TRIGGER COUPLING ......................101 16.9. NOISE REJECT ........................102 16.10. ZONE TRIGGER ......................103 int.siglent .com...
- Page 6 SDS7000A User Manual 17. SERIAL TRIGGER AND DECODE ................107 17.1. OVERVIEW ......................... 107 17.2. I2C TRIGGER AND SERIAL DECODE ................109 17.2.1. I2C SIGNAL SETTINGS ..................... 109 17.2.2. I2C TRIGGER ........................110 17.2.3. I2C SERIAL DECODE ......................113 17.3. SPI TRIGGER AND SERIAL DECODE ................115 17.3.1.
- Page 7 19.12. THRESHOLD ........................ 176 20. MATH ..........................177 20.1. OVERVIEW ......................... 177 20.2. ARITHMETIC ........................178 20.2.1. ADDITION / SUBTRACTION / MULTIPLICATION / DIVISION ........... 179 20.2.2. IDENTITY / NEGATION ...................... 179 20.2.3. AVERAGE / ERES ......................180 int.siglent .com...
- Page 8 SDS7000A User Manual 20.2.4. MAX-HOLD / MIN-HOLD ....................180 20.3. ALGEBRA ........................... 180 20.3.1. DIFFERENTIAL ........................180 20.3.2. INTEGRAL .......................... 181 20.3.3. SQUARE ROOT ........................182 20.3.4. ABSOLUTE ......................... 182 20.3.5. SIGN ........................... 183 20.3.6. EXP/EXP10 ......................... 183 20.3.7. LN/LG ..........................184 20.3.8.
- Page 9 32.2. SIGNAL SETTING ......................266 32.3. CLOCK RECOVERY ......................266 32.4. MEASUREMENT ........................ 268 32.5. MASK TEST ........................269 32.6. OTHER OPERATION ......................269 33. JITTER ANALYSIS ......................271 33.1. OVERVIEW ......................... 271 33.2. SIGNAL CONFIGURATION ....................272 33.3. CLOCK RECOVERY ......................273 int.siglent.com...
- Page 10 SDS7000A User Manual 33.4. JITTER DECOMPOSITION ....................273 33.5. JITTER MEASURE ......................274 33.6. OTHER OPERATION ......................277 33.7. SYSTEM EFFECT ON JITTER MEASURE ............... 277 34. COMPLIANCE TEST ..................... 278 35. WAVEFORM GENERATOR ................... 279 35.1. OVERVIEW ......................... 279 35.2.
- Page 11 38.5.3. SELF TEST ......................... 309 38.5.4. DEVELOPER OPTIONS ..................... 311 38.6. SERVICE ..........................312 38.6.1. SMB FILE SHARE ......................312 38.6.2. WEB ............................ 313 38.6.3. EMULATION ........................313 38.7. SAVE BUTTON ........................314 38.8. QUICK ACTION ........................314 39. TROUBLESHOOTING ....................315 int.siglent .com...
-
Page 13: Introduction
It is an indispensable tool for designing, manufacturing, and maintaining electronic equipment. This user manual includes important safety and installation information related to the SDS7000A series of oscilloscopes and includes simple tutorials for the basic operation of the instrument. -
Page 14: Important Safety Information
SDS7000A User Manual 2. Important Safety Information This manual contains information and warnings that must be followed by the user for safe operation and to keep the product in a safe condition. 2.1. General Safety Summary Carefully read the following safety precautions to avoid personal injury and prevent damage to the instrument and any products connected to it. - Page 15 Do not touch exposed contacts or components when the power is on. Do not operate in wet/damp conditions. Do not operate in an explosive atmosphere. Keep the surface of the instrument clean and dry. Only probe assemblies that meet the requirement of UL61010-031 and CAN/CSA-C22.2 No.61010-031 shall be used. int.siglent .com...
- Page 16 SDS7000A User Manual Only a lithium battery with the same specifications as the original battery should be used to replace the battery on the mainboard. Do not use the equipment for measurements on mains circuits. Do not use the equipment for measurements on voltages exceeding the voltage ranges described in the manual.
-
Page 17: Safety Terms And Symbols
The "WARNING" symbol indicates a potential hazard. It calls attention to a procedure, practice, or condition which, if not followed, could cause bodily injury WARNING or death. If a WARNING is indicated, do not proceed until the safety conditions are fully understood and met. int.siglent .com... -
Page 18: Working Environment
SDS7000A User Manual 2.3. Working Environment The design of the instrument has been verified to conform to EN 61010-1 safety standard per the following limits: Environment The instrument is used indoors and should be operated in a clean and dry environment with an ambient temperature range. -
Page 19: Cooling Requirements
15 cm (6 inch) minimum gap around the sides of the instrument. CAUTION: Do not block the ventilation holes located on both sides of the scope. CAUTION: Do not allow any foreign matter to enter the scope through the ventilation holes, etc. int.siglent .com... -
Page 20: Power And Grounding Requirements
SDS7000A User Manual 2.5. Power and Grounding Requirements The instrument operates with a single-phase, 100 to 240 Vrms (+/-10%) AC power at 50/60 Hz (+/- 5%). No manual voltage selection is required because the instrument automatically adapts to line voltage. Depending on the type and number of options and accessories (probes, PC port plug-in, etc.), the instrument can consume up to 400 W. -
Page 21: Cleaning
Proper use of the instrument depends on the careful reading of all instructions and labels. Warning: Any use of the scope in a manner not specified by the manufacturer may impair the instrument’s safety protection. This instrument should not be directly connected to human subjects or used for patient monitoring. int.siglent .com... -
Page 22: Safety Compliance
SDS7000A User Manual 2.8. Safety Compliance This section lists the safety standards with which the product complies. U.S. nationally recognized testing laboratory listing UL 61010-1:2012/R: 2018-11. Safety Requirements for Electrical Equipment for Measurement, Control, and Laboratory Use – Part 1: General Requirements. ... -
Page 23: Informations Essentielles Sur La Securite
Voir les cotes de tous les terminaux. Pour éviter un incendie ou un choc é lectrique, vérifiez toutes les cotes et signez les instructions de l'instrument.Avant de brancher l'instrument, lisez attentivement ce manuel pour obtenir de plus amples renseignements sur les cotes. int.siglent .com... - Page 24 SDS7000A User Manual Entretien du matériel. En cas de défaillance de l'équipement, ne pas dé monter et entretenir l'équipement sans autorisation. L'équipement contient des condensateurs, de l'alimentation électrique, des transformateurs et d'autres dispositifs de stockage d'énergie, ce qui peut causer des blessures à haute tension. Les dispositifs internes de l'équipement sont sensibles à...
-
Page 25: Termes Et Symboles De Securite
Fonctionnement et Veille. Ce commutateur ne déconnecte pas l'alimentation de l'appareil. Pour éteindre complètement l'oscilloscope, le cordon d'alimentation doit être débranché de la prise secteur une fois l'oscilloscope en état de veille. int.siglent.com... -
Page 26: Environnement De Travail
SDS7000A User Manual Ce symbole est utilisé pour représenter un courant alternatif, ou "AC". Le symbole " CAUTION" indique un danger potentiel. Il attire l'attention sur une procédure, une pratique ou une condition qui peut être dangereuse si elle n'est pas CAUTION suivie. - Page 27 Degré de pollution Un oscilloscope peut être utilisé dans un environnement Pollution Degree II. Note: Pollution Degree II signifie que le milieu de travail est sec et qu'il y a une pollution non conductrice.Parfois, la condensation produit une conductivité temporaire. int.siglent.com...
-
Page 28: Exigences De Refroidissement
SDS7000A User Manual IP Rating IP20 (as defined in IEC 60529). Exigences de refroidissement Cet instrument repose sur un refroidissement à air forcé avec des ventilateurs internes et des ouvertures de ventilation. Des précautions doivent être prises pour éviter de restreindre le flux d'air autour des ouvertures (trous de ventilateur) de chaque côté... -
Page 29: Nettoyage
Pour éviter les chocs électriques, débranchez le cordon d'alimentation de la prise secteur avant de le nettoyer. Avertissement: risque de choc électrique! Aucune pièce réparable par l'opérateur à l'intérieur. Ne retirez pas les capots. Confiez l'entretien à un personnel qualifié int.siglent.com... -
Page 30: Conditions Anormales
SDS7000A User Manual Conditions anormales Utilisez l'instrument uniquement aux fins spécifiées par le fabricant. N'utilisez pas la lunette s'il y a des signes visibles de dommages ou si elle a été soumise à de fortes contraintes de transport. Si vous pensez que la protection de l'oscilloscope a été altérée, débranchez le cordon d'alimentation et sécurisez l'instrument contre toute opération involontaire. -
Page 31: First Steps
SIGLENT shall not be responsible for any defect, damage, or failure caused by any of the following: a) Attempted repairs or installations by personnel other than SIGLENT. -
Page 32: Document Conventions
SDS7000A User Manual 4. Document Conventions For convenience, italicized text with shading is used to represent the clickable menu/button/region on the display. For example, Display represents the "Display" menu on the screen: For the operations that contain multiple steps, the description is in the form of "Step 1 > Step 2 >...". As an example, follow each step in the sequence to enter the upgrade interface: Utility >... -
Page 33: Getting Started
Follow the steps below to examine the software and hardware versions of the oscilloscope. Utility > Menu > System Info See the section "System Information" for details. 5.4. Install Options A license is necessary to unlock a software option. See the section "Install Option" for details. int.siglent.com... -
Page 34: Quick Start
SDS7000A User Manual 6. Quick Start 6.1. Mechanical Dimension Front View Right View i n t . s i g l e n t . c o m... -
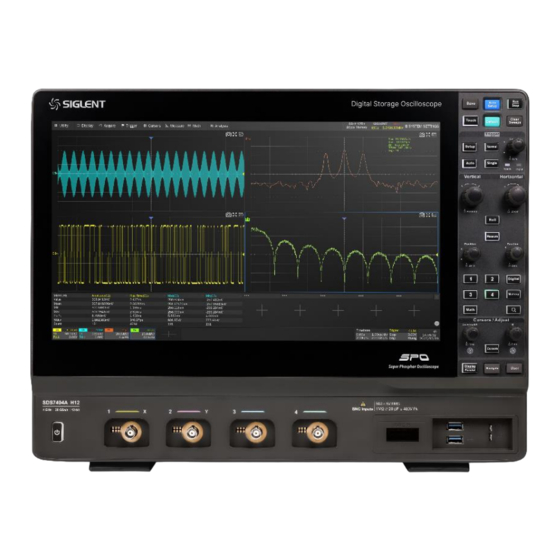
Page 35: Front Panel Overview
Probe Compensation / Ground Terminal Touch Screen Display: The display and major functions area. See the "Touch Screen Display" chapter for more details Keyboard: Includes knobs and buttons. See the "Front Panel" chapter for more details G. Power Switch Supporting Legs int.siglent.com... -
Page 36: Rear Panel Overview
SDS7000A User Manual 6.3. Rear Panel Overview AC Power Input 10 MHz In 10 MHz Out Built-in AWG Output Auxiliary Out: Outputs the trigger indicator. When Mask Test is enabled, outputs the pass / fail signal Ext Trigger Input G. OCXO Option Interface USB 2.0 Device: Connects with a PC for remote control Handle i n t . -
Page 37: Side Panel Overview
2 1000M LAN Ports: Connect the port to the network for remote control 4 USB Host 3.1 Gen 1 Ports DP 1.2 Video Output Port HDMI 1.4 Video Output Port COM Port: For internal debugging only DVI-D Video Output Port G. Audio Ports: Line In, Line Out, Mic In int.siglent.com... -
Page 38: Connecting To External Devices/Systems
The standard power supply for the instrument is 100~240 V, 50/60 Hz. Please use the power cord provided with the instrument to connect it to AC power. 6.5.2. Probes The SDS7000A series oscilloscope supports active probes and passive probes. The specifications and probe documents can be obtained at int.siglent.com, www.siglentna.com, or www.siglenteu.com. Probe Compensation When a passive probe is used for the first time, you should compensate it to match the input channel of the oscilloscope. -
Page 39: Lan
Connect the mouse or keyboard to the USB host port on the front or side panel of the oscilloscope. Mouse operation is equivalent to single point gesture operation on the touch screen. When the display mode of the external monitor is “Extend”, operations within the extended screen can only be performed with the mouse. int.siglent.com... -
Page 40: Auxiliary Output
SDS7000A User Manual 6.5.6. Auxiliary Output When Mast Test is enabled, the port outputs the pass/fail signal, otherwise, it outputs the trigger indicator. The trigger indicator can be used to measure the waveform capture rate. See the chapter “Mask Test” for more details on the pass/fail output. 6.5.7. -
Page 41: Logic Probe
To connect the logic probe: Insert the probe, with the correct side facing up, until you hear a “click”. To remove the logic probe: Depress the buttons on each side of the probe, then pull out it. See the chapter “Digital Channels” for more information. int.siglent.com... -
Page 42: Remote Control
SDS7000A User Manual 7. Remote Control The SDS7000A provides a LAN port and a USB Device port which can be used for remote control in multiple ways. 7.1. Web Browser A built-in web server provides an approach to interact with the oscilloscope by a web browser. It doesn’t require any additional software to be installed on the computer. -
Page 43: Other Connectivity
G. Click here to perform a firmware upgrade 7.2. Other Connectivity The SDS7000A also supports remote control of the instrument by sending SCPI commands via NI-VISA, Telnet, or Socket. For more information, refer to the programming guide for this product. int.siglent.com... -
Page 44: Screen Display
SDS7000A User Manual 8. Screen Display 8.1. Overview The entire SDS7000A display is a capacitive touch screen. Use your fingers to touch, drag, pinch, spread, or draw a selection box. Many controls that display information also work as “buttons” to access other functions. -
Page 45: Menu Bar
The grid area displays the waveform traces. Traces can be moved by the mouse. The area is divided into 8 (vertical) * 10 (horizontal) grids. The best display effect can be obtained by adjusting the waveform intensity and graticule. Follow the steps below to set these parameters: Display > Intensity, Display > Griticule int.siglent.com... -
Page 46: Channel Descriptor Box
SDS7000A User Manual There are multiple indicators on the grid: Trigger Level Indicator shows the level where the waveform triggers on the vertical axis. Trigger Delay Indicator locates where the waveform triggers on the horizontal axis. When the trigger position is outside the screen, the direction of the triangle changes to point outside the screen. - Page 47 For example, the vertical scale of the oscilloscope is 100mV/div with 1X attenuation, and 1 V/div if the attenuation factor is changed to 10X. When inserting a standard 10X passive probe with a probe sense terminal, the oscilloscope will automatically set the factor to 10X. int.siglent.com...
-
Page 48: Timebase And Trigger Descriptor Boxes
SDS7000A User Manual : 1:1 attenuation, suitable for direct coaxial cable connection or passive probes with 1X attenuation :10:1 attenuation, suitable for general passive probes or active probes with 10X attenuation :100:1 attenuation, suitable for some high-voltage probes : Custom attenuation factor 8.5. - Page 49 Auto: The oscilloscope will sweep without a set trigger. An internal timer triggers the sweep after a preset timeout period so that the display refreshes continuously. This is helpful when first analyzing unknown signals. Otherwise, Auto functions the same as Normal when a trigger int.siglent.com...
- Page 50 SDS7000A User Manual condition is found. Normal: Sweeps only if the input signal meets the trigger condition. Otherwise, it continues to display the last acquired waveform. Single: Stops the acquisition and displays the last acquired waveform. Force: Force an acquisition, regardless of whether the input signal meets the trigger conditions or not.
-
Page 51: Dialog Box
C. Scroll bar. When parameters are more than the displayed range, the blue scrollbar will be displayed. By sliding the dialog area up and down, it can scroll to the area not displayed. To Set Parameters The SDS7000A provides a couple of different ways to input/select parameters: int.siglent.com... - Page 52 SDS7000A User Manual Switch: Sets parameters with two states, such as to enable or disable a function. Click the switch region to change from one state to the other. List: Sets parameters with more than two options, such as coupling mode of channels. Click the parameter region, and then select the expected option from the pop-up list.
- Page 53 Follow the steps below: Display > Hide Menu . Menu style = Floating, and the Dialog box is Dialog box is hidden displayed Menu style = Embedded, and the Dialog box is displayed int.siglent.com...
-
Page 54: Touch Gestures Or Mouse Control
SDS7000A User Manual 8.7. Touch Gestures or Mouse Control Waveforms, cursors, and trigger levels can be adjusted by touching gestures or using the mouse. It can also be used to define Zone Trigger areas as shown below: Drag the waveform left and right to move it on the horizontal axis Pinch and spread the waveform horizontally to re-scale the timebase... - Page 55 Draw a rectangular box to create a zone or a histogram region. At the beginning of the gesture keep the angle close to 45° , so it can be recognized as the drawing box gesture Long press or right-click a specific area to bring up the desired menu int.siglent.com...
-
Page 56: Multi-Windows Display
SDS7000A User Manual 8.8. Multi-windows Display The display of SDS7000A is a 1920*1080 resolution HD display, which is more capable of displaying content.. The SDS7000A supports up to 9 windows on the touch screen display, and also supports an external monitor as an extension screen. For more information on multi window settings, please refer to the "Window Layout Setting"... -
Page 57: Front Panel
All the knobs on the front panel are multi-function. They can be pushed as well as rotated. Pushing a knob quickly recalls a specific function, which is indicated by the silkscreen near the knob. int.siglent.com... -
Page 58: Vertical And Horizontal Control
SDS7000A User Manual 9.2. Vertical and Horizontal Control Analog channels (C1-C4), digital channels (D), math (F1-F4), and memory waveform (M1~M4) share the same vertical knob. Rotate the knob to adjust the vertical scale (volt/div) of the activated trace. Push to alternate between coarse and fine adjustments. When the digital channel is active, rotate the knob to change the selected digital channel. -
Page 59: Trigger Control
C. Normal mode: Triggers repeatedly when all conditions are met D. Single mode: Triggers once when all conditions are met E. Trigger level adjustment: Push to set the level to 50% of the waveform Trigger status LED, Ready and Trig'd int.siglent.com... -
Page 60: Cursors Control
SDS7000A User Manual 9.4. Cursors Control A. Push the button to open the cursors setup dialog box B. Rotate the knob A to move the cursor A; Push to switch between X1/Y1 (when cursor type = X-Y) C. Rotate the knob B to move the cursor B; Push to switch between X2/Y2 (when cursor type = X-Y) 9.5. -
Page 61: Other Buttons
Press the button to enable the navigate function and open the navigate settings dialog box. Press again to turn off navigate function. You can use this button to quickly enable preset functions. Please refer to the " Quick Action " section for details. int.siglent.com... -
Page 62: Multiple Approaches To Recall Functions
SDS7000A User Manual Multiple Approaches to Recall Functions The oscilloscope can recall functions through different approaches. 10.1. Menu Bar If you are familiar with common computer programs, you may first choose to access a function by the drop-down menu from the menu bar at the top of the display. For example, to open the trigger setup dialog box, you can follow the steps below: Trigger >... -
Page 63: Shortcut Button On The Front Panel
Most of the functions of the oscilloscope can be recalled directly by the shortcut buttons on the front panel. See the chapter “Front Panel” for details. To open the trigger setup dialog box, press the Setup button in the trigger control area on the front panel. int.siglent.com... -
Page 64: Quickly Capture The Signal
SDS7000A User Manual Quickly Capture the Signal This is an example of how to acquire a signal quickly. In this example, we assume the signal is connected to channel 1 and channel 1 is turned off. First, press the channel 1 button to turn on channel 1. The LED on the button lights and the descriptor box of channel 1 is displayed at the bottom of the screen. -
Page 65: Vertical Setup
Touch the + button and then select the expected channel to turn it on, and its channel descriptor box and a dialog box will appear on the display. Touch the channel descriptor box and then touch the Off button to disable it. Turn on C1 Turn off C1 int.siglent.com... -
Page 66: Channel Setup
SDS7000A User Manual 12.2. Channel Setup Click the channel descriptor box, a quick dialog will pop up. Vertical scale and offset can also be set from this dialog box. A. Click the region to set the vertical scale with the mouse wheel or virtual keypad. - Page 67 AC signals with DC offset, such as power ripple. GND: The channel is grounded by an internal switch. GND coupling is used to observe the zero-offset error of the analog channels or determine the source of noise in the waveform (from int.siglent.com...
- Page 68 SDS7000A User Manual the signal or from the oscilloscope itself) Bandwidth Limit Full bandwidth passes through signals with high-frequency components, but it also means that noise with high-frequency components can pass through. When the frequency component of the signal is very low, better signal-to-noise ratios (SNR) can be obtained by turning on a bandwidth limit.
- Page 69 Before deskew After deskew Note: When the channel with delay compensation is the trigger source, the trigger delay indicator will not change at any time when the deskew value changes. int.siglent.com...
- Page 70 SDS7000A User Manual Invert When invert is enabled, the waveform is rotated 180 degrees around earth potential (0 Volts). Before invert After invert Trace When the trace is hidden, the channel waveform is no longer displayed on the screen, while the acquisition is still running in the background.
-
Page 71: Digital Channels
The equipment shall be used only for the purposes specified by the manufacturer. The SPL2016 probe is used only for SIGLENT's special series of oscilloscopes. Protection mechanisms can be compromised if the way the devices connected by the SPL2016 are not used for their intended purpose. -
Page 72: Enable/Disable The Digital Channels
SDS7000A User Manual SDS7000A-16LA Option The software option adds the following functions to the oscilloscope: Digital channel acquisition and analysis - Acquire and analyze the signals connected to the digital logic probe, including waveform display, save, parameter measurement, etc. ... -
Page 73: Digital Channel Setup
E. ▲ to increase and ▼ to decrease the number of divisions occupied by the digital channels Reset the height to the default value G. Turn off the digital channels H. Open the digital dialog box on the right side Height=8div, Position=0div Height=4div, Position=1div int.siglent.com... - Page 74 SDS7000A User Manual The quick menu only covers the height range and position of the digital channels display area. More settings can be found in the dialog box. A. Turn on/off the digital channels B. Labels can be set to data, address, or custom characters. C.
- Page 75 SDS7000A User Manual The configurable logical level includes TTL, CMOS, LVCMOS 3.3 V, LVCMOS 2.5 V, and Custom. The setting range of the custom threshold is - 10.0 V to + 10.0 V. int.siglent.com...
-
Page 76: Horizontal And Acquisition Setup
SDS7000A User Manual Horizontal and Acquisition Setup 14.1. Timebase Setup The timebase setup is used to adjust the scale and offset of the X (horizontal) axis. This setting applies to all analog, and digital channels as well as all math traces except FFT. Click the timebase descriptor box and the quick menu of the timebase settings will pop up. -
Page 77: Acquisition Setup
(Measure, Math, Decode, cursors, etc.) are turned off, C1/C2 is turned off and C3/C4 is turned on. At full memory depth, the SDS7000A can still operate at full speed sampling on a time base of 5 ms/div, achieving a balance between overall and detail. int.siglent.com... -
Page 78: Acquisition
SDS7000A User Manual Interpolation -- At small timebase settings, the number of original points on the screen may be less than the number of display pixels in the grid area, so interpolation is necessary to display a continuous waveform. For example, at 1 ns/div timebase and 10 GSa/s sample rate, the number of original points is 100, but the number of pixels in the grid area is far greater than 100. - Page 79 Note: Average acquisition is only valid for periodic signals, and it is important to ensure that the waveform is triggering stably when using average mode. ERES: In this mode, the oscilloscope digitally filters the sampling points, which can reduce the int.siglent.com...
- Page 80 SDS7000A User Manual broadband random noise on the input signal and improve the signal-to-noise ratio, to improve the effective resolution (ENOB) of the oscilloscope. The ERES processing of the SDS7000A is realized by the hardware engine, so it can still maintain a high waveform refresh rate when ERES is turned on. Normal mode ERES mode (3-bit) ERES acquisition does not require the signal to be periodic, nor does it require stable triggering, but...
-
Page 81: Memory Management
Stop mode. Note: When the status is Run, the scope only processes the data on the display, which means measure, math, decode, search, etc. only analyzes the data on the display. This is identical to the "Auto" memory management mode. int.siglent.com... -
Page 82: Roll Mode
SDS7000A User Manual Roll Mode 14.2.4. Click Acquire > Roll to enter roll mode. In this mode, the waveform moves across the screen from right to left, similar to a strip chart recorder. The horizontal delay control of the waveform will be disabled when roll mode is active. - Page 83 (43,231 in this example, up to 124,000 depending on the number of samples at the current time base). Wait patiently until the acquisition completes, then all the waveforms satisfying the trigger conditions are displayed on the screen. int.siglent.com...
- Page 84 SDS7000A User Manual In Sequence mode, there is no waveform displayed on the screen until the acquisition is completed. During acquisition, there is a counter on the screen indicating the number of segments that have been acquired. In the example, 43231 pulses can be obtained with the sample rate of 20 GSa/s at the maximum memory depth.
-
Page 85: History
Continue with the example in the section above. In Sequence mode, all waveforms that satisfy the trigger conditions are mapped to the display. If you need to observe a single frame, you can use history mode. int.siglent.com... - Page 86 SDS7000A User Manual To enable history mode, click the Frame No . area twice, then the virtual numeric keypad pops up. Input the number "52" to specify the 52th segment (frame). Observing the 52th frame captured by Sequence in history mode Click the List area and turn on the list.
- Page 87 Click the Interval Time area to control the speed of automatic play. In the process of automatic play, the list will automatically scroll to the current frame. int.siglent.com...
-
Page 88: Zoom
SDS7000A User Manual Zoom The SDS7000A supports waveform zoom in the horizontal and vertical directions. Press button, or press the horizontal scale knob, or perform Acquire > Zoom to turn on Zoom. When the Zoom function is on, the oscilloscope will open a separate window specifically to display the Zoom waveform. - Page 89 Adjust the horizontal scale of Zoom window by horizontal pinch and spread in the zoom area of the main window or the Zoom window. Adjust the vertical position of the zoom area by dragging up and down in the zoom area of the main window or waveform in the Zoom window. int.siglent.com...
- Page 90 SDS7000A User Manual Adjust the horizontal/vertical scale of the main window by using a pinching or spreading gesture in the gray area of the main window. Double click a location in the main window to quickly set the center of the zoom area. i n t .
-
Page 91: Trigger
Trigger settings should be based on the features of the input signal. For example, a sine wave with a repeatable period can be triggered on the rising edge; for capturing hazards in a combinational logic circuit, the pulse trigger can be set. You need to have some knowledge of the signal-under-test to quickly capture the desired waveform. int.siglent.com... -
Page 92: Trigger Setup
SDS7000A User Manual 16.2. Trigger Setup Click the trigger descriptor box to display the quick menu of trigger settings. The trigger setup dialog box is displayed on the right side of the screen. A. Click the level region and roll the mouse wheel to adjust the trigger level. -
Page 93: Trigger Level
When the signal with a positive slope crosses the trigger level, the trigger condition is satisfied and the time point the signal crosses the level is the trigger position. In some special triggers, the system will automatically set the trigger level, such as using AC Line as the trigger source. int.siglent.com... -
Page 94: Trigger Mode
SDS7000A User Manual 16.4. Trigger Mode The trigger mode determines how the oscilloscope acquires waveforms. Auto: An internal timer triggers the sweep after a preset timeout period if no trigger has been found so that the oscilloscope continuously updates the display whether a trigger happens or not. Auto mode is suitable for unknown signals or DC signals. -
Page 95: Trigger Type
Nth Edge –Trigger on the Nth edge of a burst that occurs after a specified idle time Delay --Trigger when the delay time between source A and source B meets the limit condition Setup/Hold --Trigger when the setup time or hold time meets the limit condition int.siglent.com... -
Page 96: Edge Trigger
SDS7000A User Manual Edge Trigger 16.5.2. Edge trigger distinguishes the trigger points by seeking the specified edge (rising, falling, alternating) and trigger level. The trigger source and slope can be set in the trigger dialog box. Click the Source area to select the trigger source, and click the Slope area to select rising, falling, or alternating. - Page 97 Upper Value / Lower Value area. Less than a time value(≤) -- Trigger when the positive or negative slope time of the input signal is lower than the specified time value. int.siglent.com...
-
Page 98: Pulse Trigger
SDS7000A User Manual Great than a time value(≥) -- Trigger when the positive or negative slope time of the input signal is greater than the specified time value. Within a range of time values ([--,--]) -- Trigger when the positive or negative slope time of the input signal is greater than the specified lower limit of time and lower than the specified upper limit of time value. -
Page 99: Video Trigger
NTSC (National Television Standards Committee), PAL (Phase Alternating Line), HDTV (High- Definition Television), and a custom video signal trigger. Source, standard, and synchronization mode can be set in the video trigger dialog box. When the synchronization mode is "Select", line and field can be specified. int.siglent.com... - Page 100 SDS7000A User Manual Click the Standard and select the video standard. The SDS7000A supports the following video standards: TV Standard Scan Type Sync Pulse NTSC Interlaced Bi-level Interlaced Bi-level HDTV 720P/50 Progressive Tri-level HDTV 720P/60 Progressive Tri-level HDTV 1080P/50 Progressive Tri-level HDTV 1080P/60 Progressive...
- Page 101 Standard Field 1 Field 2 NTSC 1 to 263 1 to 262 1 to 313 1 to 312 HDTV 720P/50, 720P/60 1 to 750 HDTV 1080P/50, 1080P/60 1 to 1125 HDTV 1080i/50, 1080i/60 1 to 563 1 to 562 int.siglent.com...
- Page 102 SDS7000A User Manual To gain familiarization with the video trigger, try these two examples: Trigger on a specific line of video (NTSC standard) Use “Custom” to trigger video signals Trigger on a Specific Line of Video Video trigger requires that any analog channel can be used as the trigger source with a synchronization amplitude greater than 1/2 grid.
-
Page 103: Window Trigger
If the upper trigger level is within the waveform amplitude range while the lower trigger level is out of the waveform amplitude range, the oscilloscope will trigger on the rising edge only. int.siglent.com... -
Page 104: Interval Trigger
SDS7000A User Manual If the lower trigger level is within the waveform amplitude range while the upper trigger level is out of the waveform amplitude range, the oscilloscope will trigger on the falling edge only. To set window trigger via the Absolute window type Refer to "Adjust Upper/Lower Level"... -
Page 105: Dropout Trigger
Trigger when the time interval (△T) from when the rising edge (or falling edge) of the input signal passes through the trigger level to when the neighboring falling edge (or rising edge) passes through the trigger level is greater than the set time, as shown in the figure below: int.siglent.com... -
Page 106: Runt Trigger
SDS7000A User Manual Trigger source, slope (rising, falling), dropout type, and time value can be set in the trigger dialog box. Holdoff, coupling, and noise reject can be set in the dropout trigger, see the sections "Holdoff", "Trigger Coupling" and "Noise Reject" for details. Note: Under dropout trigger, selecting the upper or lower edge refers to calculating the timeout time from the edge, and the waveform may not necessarily be triggered on the edge. - Page 107 The logical setting of analog channels The logical setting of digital channels Limit Range This setting is particularly useful to filter the hazard signals of combinational logic. When multiple triggering positions simultaneously meet the pattern trigger conditions, a specific time value can be set int.siglent.com...
-
Page 108: Qualified Trigger
SDS7000A User Manual to trigger the oscilloscope at the code type combination position that meets the time value. This setting is particularly useful when filtering hazards in a combinational logic. Holdoff can be set in pattern trigger, see the section "Holdoff" for details. Qualified Trigger 16.5.11. -
Page 109: Nth Edge Trigger
Slope of the combined logical results in the Source Setting . Click the SourceB Setting region to set the edge trigger source and slope. Click the Limit Range and Upper / Lower Value region to set the delay time condition. int.siglent.com... -
Page 110: Setup/Hold Trigger
SDS7000A User Manual Setup/Hold Trigger 16.5.14. The clock and data sources need to be set in the setup/hold trigger setting. The set-up time starts when the data signal crosses the trigger level and ends when the specified clock edge arrives. The holding time starts when the specified clock edge arrives and ends when the data signal crosses the trigger level again (as shown in the figure below). -
Page 111: Trigger Source
Dropout × × √ Runt × × × √ √ Pattern × × √ √ Serial × × √ √ Qualified × × √ √ Nth Edge × × √ √ Delay × × √ √ Setup/Hold × × int.siglent.com... -
Page 112: Holdoff
SDS7000A User Manual 16.7. Holdoff Holdoff is an additional condition for triggers and can be used to stabilize the triggering of complex waveforms (such as a pulse series). It can be set to a time or number of events. Holdoff by Time Holdoff time is the amount of time that the oscilloscope waits before re-arming the trigger circuitry. -
Page 113: Trigger Coupling
(used for triggering on low frequencies). See the datasheet for details of the cut-off frequency. LFR: The signal is coupled through a capacitive high-pass filter network, DC is rejected and low frequencies are attenuated. For stable triggering on medium to high-frequency signals. See the datasheet for details of the cut-off frequency. int.siglent.com... -
Page 114: Noise Reject
SDS7000A User Manual 16.9. Noise Reject Noise Reject adds additional hysteresis to the trigger circuitry. By increasing the trigger hysteresis, the noise immunity becomes better but the trigger sensitivity degrades. Noise Reject = Off Noise Reject = On 1 0 2 i n t . -
Page 115: Zone Trigger
The zones can be created and moved by the mouse or by setting Zone Setting in the dialog box. The color of the zone’s outline is consistent with the color of the specified source (Channel 1 = Yellow, etc...). int.siglent.com... - Page 116 SDS7000A User Manual Mouse When the zone trigger is turned on, click-and-hold on any position within the waveform area and draw a rectangular box, as shown in the following figure: Once a zone is created, it can be moved by dragging. Select C1 as the source, turn on zone1, Select C1 as the source, turn on zone1, and set the property as "Intersect"...
- Page 117 With a simple edge trigger, it is unlikely to trigger consistently on this anomaly. Thanks to the high waveform update rate of the SDS7000A, we can confirm there is bus contention happening by enabling the persistence display, as shown in the figure below: int.siglent.com...
- Page 118 SDS7000A User Manual In this case zone trigger is a quick and simple way to capture the waveform. Enable the zone trigger, and draw a box to intersect with the bus contention part, as shown in the figure below: Now, we can accurately capture the exact bus contention waveform: 1 0 6 i n t .
-
Page 119: Serial Trigger And Decode
Click the trigger descriptor box, and then select the Type as Serial in the trigger dialog box to set the serial trigger: A. Select the type as Serial B. Select the serial bus protocol C. Set the signal, including the mapping relation between channels and bus signals, and the thresholds D. Trigger setting int.siglent.com... - Page 120 SDS7000A User Manual Perform Analysis > Decode to turn on the serial decode dialog box: A. Set the list of decoded results B. Select the bus to set, Bus1 or Bus2 C. Turn on/off the bus D. Set the bus display format (Binary, Decimal, Hex, and ASCII) E.
-
Page 121: I2C Trigger And Serial Decode
C. Set the source of SDA. In the example above, SDA is connected to C4. D. Set the threshold level of the SDA channel. E. Return to the previous menu. Threshold level line. It only appears when adjusting the threshold level. int.siglent.com... -
Page 122: I2C Trigger
SDS7000A User Manual Copy Setting Click the Protocol Copy in the decode dialog box to synchronize the settings between the trigger and decode. A. Copy the decode settings to trigger B. Copy the trigger settings to decode C. Return to the previous menu. Note: The synchronization is not automatic. - Page 123 7 Address & Data -- the oscilloscope will be triggered on the read or write frame in 7-bit address mode. Frame (Start: 7-bit address: R/W: Ack) -- Data1 and Data2 are set to “0xXX”. If all bits match, then trigger on the Ack bit followed by the R/W bit. int.siglent.com...
- Page 124 SDS7000A User Manual Frame (Start: 7-bit address: R/W: Ack: Data: Ack: Data2) -- If all bits match, then trigger on the Ack bit followed by the Data2. 10 Address & Data -- If all bits match, then trigger on the Ack bit followed by the Data. Frame (Start: Address 1st byte: R/W: Ack: Address 2nd byte: Ack: Data) If you set the trigger condition to 7 address &...
-
Page 125: I2C Serial Decode
C. List display area. The decode result of multiple frames can be displayed in the list, in which each row shows the time label and decode result of a frame. Click Result List to set the parameters of the list. D. Decode dialog box int.siglent.com... - Page 126 SDS7000A User Manual The beginning of a frame, displayed in yellow green. The address value is displayed at the beginning of a frame. The write address is displayed in green and the read address is in yellow. W/R bit is represented by (W) and (R), followed by the address value.
-
Page 127: Spi Trigger And Serial Decode
SPI bus. Referring to the following figure, when the falling edge of the clock is aligned with the data, the rising edge is selected to latch the data. When the rising edge of the clock is aligned with the data, the falling edge is selected to latch the data. int.siglent.com... - Page 128 SDS7000A User Manual The CS signal should be set to correct CS Type , including CS, ~CS, and Clock Timeout. CS – Active high. The CS signal needs a complete rising edge in the screen to be regarded as active.
- Page 129 When the CS type is set to Clock Timeout, turn on Cursor, measure the clock idle time between frames as 0.3 us, and measure the interval between clock pulses as 30 us, then set the timeout to a value between 0.3 us and 30 us. In this example it is set to 1 us: int.siglent.com...
-
Page 130: Spi Trigger
SDS7000A User Manual If the data width is set to be greater than 8 bits (such as 16 bits), measure the clock idle time between 8-bit data packets as 2.5 us, and then set the timeout time to a value between 2.5 and 30 us. In this example, it is set to 5 us: SPI Trigger 17.3.2. -
Page 131: Spi Serial Decode
D. Select the number of stop bits (1, 1.5, 2) E. Set the idle level Set the bit order G. Return to the previous menu The method of copying settings is the same as I2C signal settings. See "I2C Signal Settings" for details. int.siglent.com... -
Page 132: Uart Trigger
SDS7000A User Manual UART Trigger 17.4.2. Click Trigger Setting in the dialog box to set the trigger condition: A. Source Type: RX or TX B. Trigger condition: Start, Stop, Data or Error C. When the "trigger condition" is Data, set the compare type to =, >, <... -
Page 133: Uart Serial Decode
Time -- The horizontal offset of the current data frame head relative to the trigger position. RX -- Receive data. RX Err -- Receive error type. TX -- Send data. Data -- Send error type. int.siglent.com... -
Page 134: Can Trigger And Serial Decode
SDS7000A User Manual 17.5. CAN Trigger and Serial Decode This section covers triggering and decoding CAN signals. Please read the following for more details: "CAN Signal Settings", "CAN Trigger" and "CAN Serial Decode". CAN Signal Settings 17.5.1. Connect the CAN_H and CAN_L signals to the oscilloscope, set the mapping relation between channels and signals, and then set the threshold level of each signal. -
Page 135: Can Serial Decode
Time -- The horizontal offset of the current data frame head relative to the trigger position. Type -- Type of the frame. The Data frame is represented by “D” and the Remote frame is represented by “R”. int.siglent.com... -
Page 136: Lin Trigger And Serial Decode
SDS7000A User Manual ID -- ID of the frame, 11-bits or 29-bits ID are automatically detected. Length -- Data length. Data -- Data values. CRC -- Cycle redundancy check. Ack -- Acknowledge bit. 17.6. LIN Trigger and Serial Decode This section covers triggering and decoding LIN signals. -
Page 137: Lin Serial Decode
The configuration of LIN decoding is similar to that of I2C decoding. On the bus: ID is displayed in frames and displayed in green. LEN (data length) and CHK are displayed in frames and displayed in white. DATA are displayed in frames and displayed in blue. int.siglent.com... -
Page 138: Flexray Trigger And Serial Decode
SDS7000A User Manual In the list view: Time -- The horizontal offset of the current data frame head relative to the trigger position. ID -- ID of the frame. Data length -- Data length. ID Parity -- ID parity check. ... -
Page 139: Flexray Trigger
17.7.3. The configuration of FlexRay decoding is similar to that of I2C decoding. On the bus: The signatures (CAS/MTS, WUP) are displayed in yellow-green. TSS transmission start sequence, displayed in yellow-green. The null frame indicator, the Sync int.siglent.com... - Page 140 SDS7000A User Manual frame indicator, and the Startup frame indicator are displayed in the frame and displayed in pink. The ID is displayed in the frame and displayed in green. PL (Valid Data Length) is displayed in frames, in words, and in light yellow. ...
-
Page 141: Can Fd Trigger And Serial Decode
B. When the "Frame Type" is CAN FD, turn on or off ISO C. When the "Frame Type" is CAN FD, set the BRS (Bit Rate Switch) to Both, Normal or FD D. Trigger Condition: Start, Remote, ID, ID + Data, Error E. Return to the previous menu int.siglent.com... -
Page 142: Can Fd Serial Decode
SDS7000A User Manual Trigger Condition Start -- The oscilloscope triggers at the beginning of the frame. Remote -- The oscilloscope triggers on a remote frame with a specified ID. ID, ID Bits (11-bit or 29-bit), and Curr ID Byte (1st, 2nd, 3rd, or 4th byte) can be set. Curr ID Byte is used to specify the byte to be adjusted when using the mouse wheel. -
Page 143: I2S Trigger And Serial Decode
In addition to specifying the source and the threshold level, BCLK signals also require the specification of the Edge Select . Rising– Data latched on the rising edge of the clock. Falling– Data latched on the falling edge of the clock. int.siglent.com... - Page 144 SDS7000A User Manual In addition to specifying the source and the threshold level, WS signals also require the specification of the Left CH . Low– Select the left channel when WS is low and the right channel when WS is high. ...
-
Page 145: I2S Trigger
Data -- Trigger on data. ✓ Click Compare Type to select "=", ">" or "<". ✓ Click Value to set the data value by the virtual keypad. The range of data value is related to the number of Data Bits . int.siglent.com... -
Page 146: I2S Serial Decode
SDS7000A User Manual Mute -- Trigger on the mute signal. Mute signal: Volume is less than the set value and duration reaches the set value. ✓ Click MNF to set the mute threshold by the mouse wheel or virtual keypad. The range of values is related to the number of Data Bits . -
Page 147: Mil-Std-1553B Trigger And Serial Decode
When the oscilloscope is set to capture MIL-STD-1553B signals, it can be triggered on Transfer, Word, Error, or triggered on frames that meet the specified message sending interval and response time. Click Trigger Setting in the dialog box to set the trigger conditions: int.siglent.com... - Page 148 SDS7000A User Manual Trigger on Transfer: All -- Trigger at the end of the Sync pulse of any word. BC-RT (Rcv) – Trigger on the specified transmission messages from bus controller to remote terminal. RxCmd + Word Count + DW, RxStat can be specified, and the response time should be less than 14us.
- Page 149 Response Time -- Trigger on the status word that meets the response time requirement. The response time range is [4us, 12us]. Inter Message Gap -- Trigger on the messages that meet the message interval requirement. The minimum message interval is 4us. int.siglent.com...
-
Page 150: Mil-Std-1553B Serial Decode
SDS7000A User Manual MIL-STD-1553B Serial Decode 17.10.3. The configuration of MIL-STD-1553B decoding is similar to that of I2C decoding. On the bus: is displayed in green. RTA is displayed in light yellow. The remaining data value of the C/S is displayed in white. ... -
Page 151: Sent Signal Settings
Return to the previous menu SENT Trigger 17.11.2. When the protocol is set to SENT, the following trigger conditions can be set: Start, Slow Channel, Fast Channel, and Error. Click Trigger Setting in the SENT trigger dialog box to select the trigger condition: int.siglent.com... - Page 152 SDS7000A User Manual Start -- The oscilloscope will be triggered at the start of the message (after 56 Sync ticks). You can select the type of message: Fast Channel Message, Slow Channel Message, or any. Fast Channel -- The oscilloscope will be triggered on a Fast Channel Message when the Status & Communication nibble and the data nibbles match the specified values.
- Page 153 (serial data bit #3, serial communication nibble No. 8): Frame (enhanced serial message with 4bits ID) --16-bit data and 4-bit message ID, the configuration bit is 1. Frame (enhanced serial message with 8bits ID) —12-bit data and 8-bit message ID, the configuration bit is 0. int.siglent.com...
-
Page 154: Sent Serial Decode
SDS7000A User Manual If you set the trigger condition to Slow Channel: ID can be selected in the hexadecimal range of 0x0 to 0xF (short serial / enhanced serial with 4 bits ID) or 0x00 to 0xFF (enhanced serial with 8 bits ID). If it is selected as "0xXX", the ID is ignored. - Page 155 DATA is displayed in white CRC and Pause are displayed after the data and displayed in blue For Slow Channel: ID is displayed in green DATA is displayed in white CRC is displayed in blue int.siglent.com...
-
Page 156: Manchester Serial Decode
SDS7000A User Manual In the list view: Time — The horizontal offset of the current data frame head relative to the trigger position. Sync — Sync pulse width (only fast channel) State — Status & Communication nibble (only fast channel) ... - Page 157 Set the header size, from 0 to 32 Set the number of words in the data field, from 1 to 255 K. Set the data word size, from 2 to 8 Set the trailer size, from 0 to 32 M. Return to the previous menu int.siglent.com...
-
Page 158: Manchester Serial Decode
SDS7000A User Manual Manchester Serial Decode 17.12.2. The configuration of Manchester decoding is similar to that of I2C decoding. On the bus: SYNC is displayed in pink The header is displayed in green DATA is displayed in white ... -
Page 159: Usb2.0 Serial Decode
For Token packet, the endpoint number follows the address field and is displayed in yellow-green. For Data packet, the data field follows the PID and is displayed in white. CRC is displayed in blue. EOP is the end of the data packet field, displayed in light yellow. int.siglent.com... -
Page 160: Arinc 429 Trigger And Serial Decode
SDS7000A User Manual In the list view: Time -- The horizontal offset of the current data frame head relative to the trigger position PID -- Data packet type Address -- Address value, only Token packets have this field ... -
Page 161: Arinc 429 Trigger
Word Start – The oscilloscope triggers at the start of the word. Word End - The oscilloscope triggers at the end of the word. Label - The oscilloscope triggers when the specified label value appears. int.siglent.com... -
Page 162: Arinc 429 Serial Decode
SDS7000A User Manual ✓ Click Compare Type to select: “=”, “>” or “<” ✓ Click Label(Octal) to set the data value by the virtual keypad. The range of the data value is 0x00 to 0xff. Label + Data - The oscilloscope triggers when the specified label value and other word fields appear. Label value, data value, SDI, and SSM can be set. - Page 163 Time -- The horizontal offset of the current data frame head relative to the trigger position. Label -- Octal format, used to indicate data type. SDI – Indicate the origin/destination of data. Data -- Data values. SSM – Describe the data properties of a transmission. Error – Error type. int.siglent.com...
-
Page 164: Cursors
SDS7000A User Manual Cursors 18.1. Overview Cursors are important tools when measuring signals. Rapid measurements can be performed using cursors in both horizontal and vertical directions. The cursor types include X1, X2, X1-X2, Y1, Y2, and Y1-Y2, used to indicate X-axis values (time or frequency) and Y-axis values (amplitude) on a selected waveform (C1~C4/F1~F4/M1~M4/Histogram). - Page 165 Track -- The cursor type is automatically set to "horizontal + vertical". In this mode, only horizontal cursors are adjustable, while the vertical cursors automatically attach to the cross-point of the cursor and the source waveform. Measure – Automatically indicates the measured item using cursors. Manual Mode Track Mode int.siglent.com...
- Page 166 SDS7000A User Manual Measure Mode Cursors Type X (horizontal) -- Vertical dotted lines that measure horizontal time (when the source is an FFT waveform, X cursors measure frequency). X cursors (time) X cursors (frequency) X1 -- The left (default) vertical dotted line. It can be manually moved to any horizontal position on the screen.
- Page 167 Y1- Y2 -- The difference between Y1 and Y2. After this option is selected. Change the value to move both Y1 and Y2 simultaneously. X+Y (horizontal + vertical) -- Both the X cursors and Y cursors are enabled. int.siglent.com...
- Page 168 SDS7000A User Manual Display Mode Display Mode M1 Display Mode M2 M1 -- The position information of each cursor is attached to the cursor, and the difference information is between the two cursors with arrows connected to the cursors. This mode is more intuitive.
- Page 169 Take the X cursors reference as an example to demonstrate the scaling effect of different settings: Timebase=50ns/div,X1=-200ns (-4div),X2=100ns (2div) Fixed position, timebase is changed to 100 ns/div, and the grid number of X cursors (-4div, 2div) remains fixed. The value of X1 and X2 is changed to -400 ns, 200 ns. int.siglent.com...
-
Page 170: Select And Move Cursors
SDS7000A User Manual Fixed delay, timebase is changed to 100 ns/div, and the value of X cursors (-200 ns, 100 ns) remains fixed. The grid number of X cursors is changed to -2div, 1div. 18.2. Select and Move Cursors The cursors can be selected and moved directly by the mouse, in addition, they can be selected in the cursor’s value dialog box. - Page 171 Dialog Box Click the cursor value area of the dialog box, and then roll the mouse wheel to adjust the position, or set through the pop-up Virtual keyboard. int.siglent.com...
-
Page 172: Measurement
SDS7000A User Manual Measurement 19.1. Overview The SDS7000A features a strong automatic measurement list. These parameters can be automatically measured without cursors and include common measurements such as rise time, fall time, peak-peak, and period. The SDS7000A can also measure multiple channels at the same time, showing up to 9 parameter measurements with statistics while in the M1 display mode and up to 12 parameters in the M2 mode. -
Page 173: Set Parameters
H. Statistics settings: count limit, reset statistics, and histogram. This item is not displayed under “Simple” mode 19.2. Set Parameters Click Type in the measure dialog box, or click + in the measurement parameters and statistics display area to open the parameter selection window: int.siglent.com... - Page 174 SDS7000A User Manual A. Set the source of the current setting. B. Measurement parameter classification tabs, including Favorite, Vertical, Horizontal, Miscellaneous, and CH Delay. Click a tab and the area will display the corresponding parameters C. Parameters area. Click the parameter to be measured to activate it, and click it again to close the parameter.
- Page 175 Long-click an item to add or remove it from the “Favorite” tab. For example, to add Pk-Pk to the “Favorite” tab: Advanced > Type > Vertical > Pk-Pk > Add to favorite To remove Period from the “Favorite” tab: Advanced > Type > Favorite > Period > Delete from favorite int.siglent.com...
-
Page 176: Type Of Measurement
SDS7000A User Manual 19.3. Type of Measurement Vertical Measurement 19.3.1. Vertical measurement includes 19 parameters: Max: Highest value in the input waveform Min: Lowest value in the input waveform Pk-Pk: Difference between maximum and minimum data values ... - Page 177 Overshoot (FOV): Overshoot following a falling edge; 100%* (min- base)/amplitude Overshoot (ROV): Overshoot following a rising edge; 100%*(max-top)/amplitude Preshoot (FPRE): Overshoot before a falling edge. Equal to 100 %*( max-top)/amplitude. Preshoot (RPRE): Overshoot before a rising edge. Equal to 100 %*( min- base)/amplitude. int.siglent.com...
-
Page 178: Horizontal Measurement
SDS7000A User Manual L@T: Level measured at trigger position Horizontal Measurement 19.3.2. Horizontal measurement includes 17 parameters: Period: Time between the middle threshold points of two consecutive like-polarity edges. Freq: Reciprocal of the period Time@max: First time of maximum value ... -
Page 179: Miscellaneous Measurements
+Area@DC: Area of the waveform above zero -Area@DC: Area of the waveform below zero Area@DC: Area of the waveform AbsArea@DC: Absolute area of the waveform +Area@AC: Area of the waveform above average -Area@AC: Area of the waveform below average int.siglent.com... -
Page 180: Delay Measurement
SDS7000A User Manual Area@AC: Area of the waveform above the average minus the area of the waveform below average AbsArea@AC: Area of the waveform above the average plus the area of the waveform below the average Cycles: Number of cycles in a periodic waveform ... -
Page 181: Trend
Th@F: Data hold time after the clock falling edge 19.4. Trend After adding a measurement parameter, a Trend can be used to observe the long-term change of the selected measurement value over time. A. Measurement parameter display area B. Trend plot display area int.siglent.com... -
Page 182: Track
SDS7000A User Manual C. Extend the range of time. Click it to expand the time range. D. Current value E. Maximum value Minimum value G. Average value H. Number of measurements, up to 200000 supported Reset statistics Click Reset Statistics in the measure dialog box, or click the symbol in the statistics display area to clear and restart statistics. -
Page 183: Display Mode
Click a column to add or replace a measurement. In M2 mode, up to 12 parameter measurements are displayed at a time. When statistics are enabled, they are distributed on the right side of the measurement item. Click a row to add or replace a measurement. int.siglent.com... -
Page 184: Measurement Statistics
SDS7000A User Manual 19.7. Measurement Statistics Measurement statistics are based on the total number of captured waveforms. In Roll mode, measurement statistics increase over time. Click Statistics Setting in the measure dialog box to recall the Statistics Config dialog box: A. -
Page 185: Statistics Histogram
Click the histogram area of a parameter to enlarge it for details. You can move the large histogram window position around the display by dragging. Click the histogram of another parameter to switch to the corresponding enlarged histogram. int.siglent.com... -
Page 186: Simple Measurements
SDS7000A User Manual A. Parameter B. Histogram display area. The X-axis represents measured values and Y-axis represents the probability C. Current measurement point. Different measurement sources may indicate different colors of indicator points D. Count of statistics E. Current value The bin that includes the maximum value and the probability of a value falling into it G. -
Page 187: Gate
D. Return to the previous menu int.siglent.com... -
Page 188: Threshold
SDS7000A User Manual 19.12. Threshold Measurement thresholds can be defined by the user. Changing the default threshold may change the measurement results of relevant measurement items, such as Period, frequency, +width, -width, +duty, -duty, +BWidth, -BWidth, delay, T@M, rise time, fall time, CCJ, cycles, rising edges, falling edges, edges, Ppulses, Npulses, and delay measurement. -
Page 189: Math
E. Set the label text of the math trace. Click to enter the label setting box, where users can customize the label content and display Set the vertical position of the math operation, referring to "Vertical Setup" G. Enable/Disable Invert, similar to the process used in "Vertical Setup" int.siglent.com... -
Page 190: Arithmetic
SDS7000A User Manual Units for Math Waveform Different operations have different dimensions. Therefore, the specific units displayed in Scale depend on the operation: Math Operation Unit V, A, or U* Addition (+) or Subtraction (-) *(used when the units of two sources are not consistent) ∧... -
Page 191: Addition / Subtraction / Multiplication / Division
The following figure shows an example of F1 = C1 + C3: Identity / Negation 20.2.2. The values of Source A are computed point-by-point when an identity or negation operation is chosen in any analog channel. The following figure shows an example of F1 = -C1: int.siglent.com... -
Page 192: Average / Eres
SDS7000A User Manual Average / ERES 20.2.3. Average/ERES can be set in acquisition mode and arithmetic function as well, but with different computing methods. Average and ERES in acquisition mode are computed by hardware with a higher speed than if they were computed by software in the arithmetic mode. Average and ERES in acquisition mode can only be based on data from analog channels, while the Average/ERES arithmetic function can use analog channels, zoom traces, math, and memory traces as the source. -
Page 193: Integral
Integral with Offset In addition, the integral operation can be performed within a specified gate. Click Analysis > Analysis Gate to enable the gate function, then set Gate A and Gate B to define the gate. See "Analysis Gate" for details. int.siglent.com... -
Page 194: Square Root
SDS7000A User Manual Square Root 20.3.3. Square root (√) calculates the square root of the selected source. If the waveform value is negative (the waveform is below the ground level), the result is displayed as zero. Absolute 20.3.4. Absolute (|x|) calculates the absolute value of the selected trace. 1 8 2 i n t . -
Page 195: Sign
Sign(x) = -1 if x < 0, if x = 0, if x > 0. exp/exp10 20.3.6. �� The exponential operation includes the exponential operation �� based on constant e and the �� exponential operation 10 based on 10. int.siglent.com... -
Page 196: Ln/Lg
SDS7000A User Manual �� For example: y(x) = �� ln/lg 20.3.7. Logarithmic operation includes natural logarithm base e (ln) and common logarithm base 10 (lg). In logarithmic operation, if the waveform value is negative (the waveform is below the ground level), the result is displayed as zero. -
Page 197: Filter
The 1022-tap FIRs applied in the SDS7000A provide roll-off as fast as 0.00125*fs (where fs is the sample rate), this means some limitations in the setting of corner frequency at a specified sample rate. The figures below show the limitations in detail: int.siglent.com... - Page 198 SDS7000A User Manual 0.00125fs 0.00125fs 0.00125fs 0.00125fs fs/2 fs/2 Low pass High pass 0.0025fs 0.00125fs 0.00125fs fs/2 Bandpass Band reject Take a Low pass filter as an example. It requires that the corner frequency (fc) is not less than 0.00125*fs (i.e. fc ≥ 0.00125*fs), and the 0.00125*fs wide roll-off does not exceed the 1st Nyquist zone (i.e.
-
Page 199: Frequency Analysis
The horizontal axis of the FFT display is labeled using frequency (Hz) units instead of time (seconds). In addition, the vertical axis provides the option of logarithmic scaling (dBVrms/dBArms or dBm). A. Time-domain waveform display area B. Spectrum (FFT) waveform display area C. FFT parameter display area D. Dialog box int.siglent.com... - Page 200 SDS7000A User Manual Parameter Display Area The FFT parameters are displayed in the upper right of the spectrum waveform display area: FFT sample rate (Sa): FFT operation results present the first Nyquist zone (DC ~ Sa/2) of the frequency spectrum. Be aware that the FFT sample rate may be inconsistent with the sample rate in the time domain.
- Page 201 Flattop window with the best amplitude resolution. Main lobe Side lobe Maximum Window Characteristics width suppression amplitude error Rectangle The best frequency resolution The worst amplitude resolution 4π/N -13 dB 3.9 dB It is equivalent to the case of no window int.siglent.com...
- Page 202 SDS7000A User Manual Main lobe Side lobe Maximum Window Characteristics width suppression amplitude error Hanning Better frequency resolution 8π/N -32 dB 1.4 dB Poor amplitude resolution Hamming Better frequency resolution 8π/N -43 dB 1.8 dB Poor amplitude resolution Blackman Poor frequency resolution 12π/N -58 dB 1.1 dB...
- Page 203 Based on the peak tool, the markers tool can automatically search the qualified harmonics, and users can control the position of each marker. Up to 8 markers are supported. Click Tools in the math dialog box to recall the FFT tools dialog box: int.siglent.com...
- Page 204 SDS7000A User Manual When the FFT tool peaks is selected, the dialog box is as follows: A. Turn on or off the table. Turn on the table, the peaks searched with the limit of Search Threshold and Search Excursion will be displayed in a table B.
- Page 205 H. Set the difference between the peak value and the minimum amplitude on both sides. The difference should be greater than the search excursion, which can be determined as the peak Return to the previous menu int.siglent.com...
- Page 206 SDS7000A User Manual The following screenshot shows the peaks of the FFT waveform: Measure the FFT waveform Turn on the cursor function, and then specify the source as "F1". Measure the difference between the FFT waveform frequency value and two frequency values using the X1 and X2 cursors( Δ X) ; Y1 and Y2 cursors measure amplitude (in dB or Vrms) and amplitude difference(...
-
Page 207: Formula Editor
E. The Keyboard area contains the basic arithmetic operators addition (+), subtraction (-), multiplication (*), division (/) Confirm button. After the formula is input, press the button to apply it The following is an example of F1 = (3*C1) + 1V through the formula editor: int.siglent.com... - Page 208 SDS7000A User Manual The following is an example of implementing nested operations among operators through the formula editor: This example uses two nested operations to achieve FFT analysis of the differential operation results of C1 waveform: Use nested operations between mathematical waveforms: F2=d(C1)/dt, F3=FFT(F2) Use the formula editor to directly input the formula F1=FFT(d(C1)/dt) From the comparison of the results of F1 and F3 in the above figure, it can be seen that they are equivalent.
-
Page 209: Memory
Click the menu Utility > Save/Recall to open the Save/Recall dialog box, select Mode as "Save”, and Type as "To Memory". Click the menu Utility > Save/Recall to open the Save/Recall dialog box, select Mode as "Recall", Type as "Waveform", and then import the file to memory. int.siglent.com... - Page 210 SDS7000A User Manual Details of the dialog box are as below. A. Select the location of the memory (M1 / M2 / M3 / M4) B. Select the source (C1 ~ C4 / F1 ~ F4 / M1 ~ M4 / File) C.
- Page 211 If you want to save the waveform as non volatile data, please use the operation of storing data files to store the data in the specified storage path (see chapter "Save/Recall" for details). The saved binary files (*. bin) can be imported into the memory waveform. int.siglent.com...
-
Page 212: Analysis Gate
SDS7000A User Manual Analysis Gate 22.1. Overview SDS7000A supports analysis gate and can perform measurement, mathematical operations, decoding, and other analysis functions on waveforms within the gate. Users can manually open the analysis gate based on actual testing scenarios. It should be noted that when the storage depth is greater than 100Mpts, the analysis gate will be automatically opened and cannot be manually closed at this time. - Page 213 (M1-M4), and the gates of each source are independent of each other. Gates of analog and digital channels are displayed as dashed white lines, and gates of memory waveforms are displayed as dashed rectangular boxes in the same color as their waveforms, as shown below: int.siglent.com...
-
Page 214: Gate Setup
SDS7000A User Manual analog and digital channels memory waveform Gate Reference Delay -- When the horizontal scale is changed, the gate cursor value remains fixed Screen position -- When the horizontal scale is changed, the gate cursor remains fixed to the grid position on the display 22.2. -
Page 215: Search
A. Search event indicator, white triangle indicators, marking the time point of an event B. Total number of events marked on the display, here is 11 in this example C. The search dialog box, hidden in this example int.siglent.com... - Page 216 SDS7000A User Manual In the stop state, the area shows the index of the current event/total number of events. The current event is the one in the center of the display. Click the menu Analysis > Search to recall the search dialog box and turn it on.
- Page 217 Copy to Trigger: Synchronize the current search settings to the trigger settings. Cancel Copy: Cancel the last synchronization and restore the settings before it. Note: When copying from the trigger, if the trigger type is not supported by search, the operation is invalid. int.siglent.com...
-
Page 218: Navigate
SDS7000A User Manual Navigate Click the menu Analysis > Navigate to recall the navigate dialog box. The SDS7000A provides three navigate types: Search Event, Time, and History Frame. Navigate by Time The oscilloscope automatically adjusts the trigger delay according to the direction set by the user. Click Type in the navigate dialog box to select the navigate type as “Time”. - Page 219 Click the Event List Switch area to turn the list on or off. The list contains time labels for each event. Clicking a row in the list automatically jumps to the corresponding event. This operation is equivalent to specifying an event in the Event Num area. int.siglent.com...
- Page 220 SDS7000A User Manual Navigate by History Frame When the history function is turned on, Navigate can be used to play history frames (see the chapter "History" for details of the history function). Click Type in the navigate dialog box to select the navigate type as “History Frame”.
- Page 221 Set the horizontal scale to 100 ms/div, then 5 markers with 200 ms interval are shown on the display, indicating that a total of 5 dwarf pulses were found in the full screen of 1 second time range: int.siglent.com...
- Page 222 SDS7000A User Manual Turn on the Zoom function to observe the full view of the frame and the detail of the third dwarf pulse at the same time: Perform Acquire > Run/Stop to stop the acquisition, and then follow the steps Analysis >...
- Page 223 SDS7000A User Manual int.siglent.com...
-
Page 224: Signalscan
SDS7000A User Manual SignalScan 25.1. Overview SignalScan can automatically scan the acquired signals on the software according to the scan conditions set by users, and mark them with red vertical lines or rectangular boxes. Different from hardware scan, the supported scan conditions of software are richer, and the scan speed will be relatively slower. -
Page 225: Scan Mode
This mode supports pattern display in Binary, Decimal, Unsigned Decimal or Hexadecimal. The setting method of each scan mode is similar to the corresponding trigger type. See the sections "Edge Trigger", "Runt Trigger" and ”Pattern Trigger” for details. int.siglent.com... -
Page 226: Scan Tools
SDS7000A User Manual Filter Scan Events By configuring filter, filter out results that match the filter setting. The filtering methods include: less than threshold, greater than threshold, within threshold ± error range, outside threshold ± error range, and rare events. Only non-monotonic mode, runt mode, measure mode and bus pattern mode support this function. -
Page 227: Scan Zoom
Click Auto Adjust Zoom to enable automatic adjustment of Zoom parameters function. Click Acquire > Zoom to turn on Zoom and adjust the time base of Zoom waveform. Select the event in the list, and the horizontal center of the Zoom window will automatically locate int.siglent.com... -
Page 228: Histogram
SDS7000A User Manual the current event. Turn off Auto Adjust Zoom Turn on Auto Adjust Zoom Histogram 25.3.3. According to the scan results, a histogram is generated to provide users with a real-time statistical view. Histograms is only functional in Non-monotonic, Runt and Measure mode. Histogram display area Y axis, the probability of the measured value of the scan event X axis, the measured value of the scan event... -
Page 229: Overlay
SignalScan supports the use of colored overlays to display the location of events matching the scan conditions. When the overlay function is turned on, the overlayed waveform will be displayed in the horizontal center. The overlayed waveform supports persistence and color grade display. int.siglent.com... -
Page 230: Trigger Action
SDS7000A User Manual Markers of the scan event Overlayed waveform Scan Overlay channel parameter area, which can quickly set horizontal/vertical scale and position parameters. Refer to "Vertical Setup" for more details Scan overlay dialog box Trigger Action 25.3.5. After the trigger action is turned on, a trigger action will be generated when any number of events are detected in a frame waveform in the Running mode. -
Page 231: Mask Test
A. Mask area in green. Any dot violating the rule is highlighted in red, instead of the normal waveform color. B. Pass/Fail information display area, including the count of the passed frames, failed frames, total frames, and the fail rate. C. Dialog box int.siglent.com... - Page 232 SDS7000A User Manual Perform Analysis > Mask Test to open the Mask Test dialog box: A. Turn on/off the test B. Select the source (C1 ~ C4、F1~F4、M1~M4) C. Select the rule (All In, All Out, Any In, and Any Out) D.
-
Page 233: Mask Setup
A. Set the spacing of the mask to the trace horizontal B. Set the spacing of the mask to the trace vertical C. Create the mask based on settings in D. Save the mask E. Return to the previous menu int.siglent.com... -
Page 234: Mask Editor
SDS7000A User Manual Under mask testing, the user detects signal changes by creating specific rules for the signal to be detected (including setting the horizontal and vertical adjustment range of the signal), and then observing whether the signal is outside the rule range. Create a signal rule as follows: Set the values for Mask X and Mask Y (in divisions of the display graticule), and then perform Create Mask to generate the mask. - Page 235 Create Polygon: Creates a polygon based on the drawn vertices by the operation Draw Undo Redo Insert Point: Inserts a vertex on a selected side Edit Polygon: Edits a polygon. Vertices, sides, and the polygon are all editable object Delete Polygon: Deletes selected polygon int.siglent.com...
-
Page 236: Pass/Fail Rule
SDS7000A User Manual To edit a vertex, side, or polygon object, select it first, and then move it by mouse or by entering the desired value in coordinate edit area. For a side, the value is for its middle point. For a polygon, the ordinate is for its geometric center. -
Page 237: Dvm
Sources of DVM and Measurement can be different, and DVM can work well even if the acquisition of the oscilloscope is stopped. A. Bar display area B. Histogram display area C. Trend display area D. DVM dialog box int.siglent.com... -
Page 238: Mode
SDS7000A User Manual Click the menu Analysis > DVM to open the DVM dialog box: A. Turn on or off the DVM B. Select the source (C1 ~ C4) C. Select the mode: DC Mean, DC RMS, AC RMS, Peak-Peak, or Amplitude D. -
Page 239: Diagrams
The bar diagram accurately displays the current measured value. Click Bar in the DVM dialog box to display it. A. Mode B. Current value C. Bar corresponding to the current value Histogram A histogram visually indicates the probability distribution of the measured values. Click Histogram in the DVM dialog box to display it. int.siglent.com... - Page 240 SDS7000A User Manual A. Mode B. Histogram display area C. Current value D. The bin includes the maximum value and probability with which values fall into it E. Statistics counts Reset statistics Trend The trend diagram indicates the trend of the measured values over time. Click Trend in the DVM dialog box to display it.
- Page 241 When all the 3 diagrams are closed, there is a simple information bar on the top-left of the waveform display area to show the current value of the DVM: int.siglent.com...
-
Page 242: Counter
SDS7000A User Manual Counter 28.1. Overview The counter is used to measure the frequency and period of a signal or count the events happening within it. The counter is asynchronous to the acquisition system of the oscilloscope. It can work well even if the acquisition of the oscilloscope is stopped. -
Page 243: Mode
Count – Number of counts obtained Level – Counter level Click Reset Statistics in the measure dialog box to clear and restart statistics. 28.2. Mode The counter provides 3 modes. Click Mode in the counter dialog box to open the mode selection window: int.siglent.com... - Page 244 SDS7000A User Manual Frequency: Average frequency over a set period Period: The reciprocal of the average frequency over a set period Totalizer: Cumulative count When the mode is set to totalizer, the edge of the counting source needs to be set. When the counting gate is turned on, the counter can count only when the gate-source meets the specified conditions.
-
Page 245: Histogram
Vertical – Displays histogram in the vertical direction. The oscilloscope counts waveform data falling into every vertical (amplitude) bin defined by the histogram region and shows the histogram at the left of the waveform area. Both – Displays both horizontal and vertical histograms int.siglent.com... - Page 246 SDS7000A User Manual Horizontal Vertical Both Region Setting See the section “Region Setting” for details. Histogram Statistics When histogram statistics is turned on, the oscilloscope will show the statistical parameters of the histogram on the display. 2 3 4 i n t . s i g l e n t . c o m...
-
Page 247: Region Setting
Region Setting in the dialog box. The border color of the histogram region is consistent with the color of the specified source. By the Mouse Click any position of the waveform area and draw a rectangular box, as follow: int.siglent.com... - Page 248 SDS7000A User Manual A menu pops up at the end of the drawing action. Select "Histogram" in the menu: After the region is created, it can be moved by dragging action. Dialog Box Click Histogram > Region Setting to recall the dialog box. A.
-
Page 249: Power Analysis
Transient Response, PSRR, Efficiency, SOA, etc. Full use of the Power analysis requires a differential voltage probe like the SIGLENT DPB series, a current probe like the SIGLENT CP series, the SIGLENT DF2001A deskew fixture, and the power analysis activation license (part number SDS7000A-PA). - Page 250 SDS7000A User Manual The various power-related parameters and their respective units are as follows: ��−1 ∗ ∑ ���� ∗ ���� P: Active Power = ��=0 �� S: Apparent Power = Vrms * Irms Q: Reactive Power = √Apparent Power −...
- Page 251 Click Signal > Connection Guide to recall the connection guide of power quality, as shown in the figure below. Please follow the instructions in this figure for correct connections. Click the icon on the top right of the guide to close. int.siglent.com...
-
Page 252: Current Harmonics
SDS7000A User Manual 30.3. Current Harmonics Current harmonics are used to analyze the input current harmonics. An FFT of the selected channel is performed to get the harmonic components. The signal settings and connection guide are the same as the power quality test. Configuration Click Config to recall the configuration dialog box: A. - Page 253 / fail state. When the value is greater than 85% of the limit but less than 100% of the limit, it is defined as a critical state. √ X +⋯+X , where X �� Total Harmonic Distortion(THD)= 100% ∗ is the nth harmonic, and X is the basic component. int.siglent.com...
-
Page 254: Inrush Current
SDS7000A User Manual 30.4. Inrush Current A large current far greater than the stable current may flow through at the moment of switching on a power supply. The large current is called the inrush current. The current waveform when switching on is shown in the figure below: Signal Settings Click Input Setup to recall input setup dialog box:... -
Page 255: Switching Loss
Connect the current probe to the loop with the direction of the arrow indicating the direction of the current flow Make sure the switch S1 on the deskew fixture is set to the appropriate side of the fixture (either “small loop” or “large loop”) int.siglent.com... - Page 256 SDS7000A User Manual Connect the deskew fixture to a USB port on your oscilloscope or a PC using a USB cable. The USB port supplies power to the deskew fixture C. Connect the voltage and current probes to the oscilloscope input channel D.
- Page 257 Vce(sat) -- In the on area (where the voltage level is lower than the voltage reference (adjustable)), the power calculation formula is P = Vce(sat) * I. In the off area (where the current level is lower than the current reference (adjustable)), the power calculation formula is P = 0 watt. int.siglent.com...
-
Page 258: Slew Rate
SDS7000A User Manual Connection Guide Click Signal > Connection Guide to recall the connection guide of switching loss, as shown in the figure below. Please follow the instructions in this figure for connection. Click the icon on the top right of the guide to close. 30.6. -
Page 259: Modulation
Click Input Setup > Connection Guide to recall the connection guide of output ripple, as shown in the figure below. Please follow the instructions in this figure for connection. Click the icon on the top right of the guide to close. int.siglent.com... -
Page 260: Turn On/Turn Off
SDS7000A User Manual 30.9. Turn On/Turn Off Turn-on analysis determines the time taken for the power supply to reach 90% of its steady-state output. Turn-off analysis determines the time taken for the power supply to fall to 10% of its maximum output voltage. -
Page 261: Transient Response
This time starts from the first time that the output voltage exits the stable band and ends at the last time that the output voltage enters the stable band. Signal Settings int.siglent.com... - Page 262 SDS7000A User Manual Click Input Setup to recall input setup dialog box: A. Set the output voltage source B. Set the output current source C. Set the duration. The oscilloscope will set the appropriate time base according to the duration D.
-
Page 263: Psrr
Click Input Setup > Connection Guide to recall the connection guide of PSRR, as shown in the figure below. Please follow the instructions in this figure for connection. Click the icon on the top right of the guide to close. int.siglent.com... -
Page 264: Power Efficiency
SDS7000A User Manual 30.12. Power Efficiency Power efficiency analysis can test the overall efficiency of the power supply by measuring the output power and input power. Connection Guide Click Input Setup > Connection Guide to recall the connection guide of power efficiency, as shown in the figure below. - Page 265 Turn on Test State . The oscilloscope will begin to acquire the voltage and current waveforms, and display the SOA measurement, showing if the measured stresses are in the SOA or not. Users can adjust horizontal, vertical, and trigger settings during the test for the best observation. int.siglent.com...
- Page 266 SDS7000A User Manual Below is an example of testing the power-up stresses on a MOSFET and judging if the stresses are safe for the MOSFET using the SOA: Voltage and current waveforms on the MOSFET at power-up SOA, in which the mask is created according to the voltage limit, current limit, and power limit.
-
Page 267: Bode Plot
At this time, either the built-in waveform generator or one of the SIGLENT SDG series arbitrary function generators are supported. During the sweep, the oscilloscope configures the generator output frequency and amplitude and then compares the input signal to the output of the DUT. -
Page 268: Configuration
SDS7000A User Manual 31.2. Configuration Connection 31.2.1. A. DUT input and output channels B. Channel gain. When it is set to Auto, the oscilloscope will automatically adapt the vertical scale according to the signal amplitude; when it is set to Hold, it will always keep the vertical scale before the test operation C. - Page 269 Set the signal amplitude unit. When it is set to dB, the reference level and load need to be G. Set the sweep as Continue or Single H. Variable level signal display area Click Edit to turn on the profile editor int.siglent.com...
-
Page 270: Display
SDS7000A User Manual Click Nodes to set the signal node number through the mouse wheel, or click ▲ to increase the nodes and ▼ to decrease. Click the cell in the table area to set the frequency and amplitude of the corresponding node. Click to activate the cell, adjust the value through the mouse wheel, or click the cell again to call up the virtual keypad for setting. - Page 271 C. Set the reference level, the max value of the phase coordinate axis D. Set the phase unit (Degree or Rad) E. Auto-Set. According to the output signal phase curve, the oscilloscope automatically sets the scale and reference level Return to the previous menu int.siglent.com...
-
Page 272: Data Analysis
SDS7000A User Manual Cursors SDS7000A can use the cursor to measure the Bode plot curve. The cursor of the Bode plot is similar to the ordinary cursor, see the chapter "Cursors" for details. Click Display > Cursors to recall the cursor setting dialog box. - Page 273 SDS7000A User Manual A. Data list display area B. Cursors C. Data point location line D. Cursor information display area E. Measurement parameters display area Bode plot dialog box int.siglent.com...
- Page 274 SDS7000A User Manual Data List Click Data to recall the data setting dialog box: A. Turn on/off the data list B. Set the selected row in the list. Adjust the mouse wheel to set, or directly click the list display area to select a specific line C.
- Page 275 E. Clear the current measurement Close the measurement configuration window For example, to add UF measurements for C2 and GM measurements for C3, follow the steps below: Measure > Position > Source > UF Measure > Position > Source > GM int.siglent.com...
-
Page 276: Eye Diagram
SDS7000A User Manual Eye Diagram 32.1. Overview An eye diagram is an oscilloscope display in which a high-speed digital signal is repetitively sampled and applied to the vertical input, while the data rate is used to trigger the horizontal sweep. It is called an Eye because the pattern looks like a series of eyes between a pair of rails. - Page 277 Mask test G. Turn on / off the operation. It is allowed to enter the Y- T mode without exiting the eye diagram if run off the operation H. Run / Stop eye diagram when the operation is active int.siglent.com...
-
Page 278: Signal Setting
SDS7000A User Manual 32.2. Signal Setting Click Signal Setting to open the signal setup dialog box. A. The signal type can be NRZ, 100BASE-TX, 100BASE-T1, 100BASE-T2 B. The source can be C1~C4 C. Set the trigger level manually D. The hysteresis of the trigger level has a unit of division in the vertical direction. - Page 279 The oscilloscope will perform clock recovery under the expected Data Rate as Manual your input. Suitable for the situations in which the oscilloscope cannot recover the clock accurately when the signal-to-noise ratio is poor. int.siglent.com...
-
Page 280: Measurement
SDS7000A User Manual 32.4. Measurement Click Measure under the eye diagram menu to open the measurement setting dialog. The measurement under the eye diagram mode is similar to measurements in normal mode. Refer to Chapter “Measurement” to see the operating instructions. Table 32.3 Description of Eye Diagram Parameters Parameters Description... -
Page 281: Mask Test
Refer to “Mask Test” 32.6. Other Operation Some operations are supported under both the eye diagram analysis and normal mode. Part of the compatible operations are listed in the following table. For details of their operations, please refer to their respective sections. int.siglent.com... - Page 282 SDS7000A User Manual Table 32.4 Operations that be supported under the eye diagram Operation Note Vertical Control The vertical scale (volts/div) and vertical position can be adjusted. Horizontal Control The horizontal scale (time/div) and trigger delay can be adjusted. Memory and Sampling depth will adjust according to the time base under the highest sampling rate.
-
Page 283: Jitter Analysis
Its user interface is similar to the UI in an eye diagram or normal mode. A. Menu Bar B. The grid area displays the waveform in normal or eye diagram modes. C. Dialog Box D. Measurement parameter display area E. Clock or data rate information area Timebase and Trigger descriptor box int.siglent.com... -
Page 284: Signal Configuration
SDS7000A User Manual Jitter Analysis Dialog Box A. Turn on/off the Jitter Analysis B. Set the display mode, including Waveform and Eye diagram C. The signal setting, including source and trigger level D. Quick view. After setting the channel source and performing a quick view, the oscilloscope will automatically adjust the vertical/horizontal scale and trigger level, the frequently-used measurement types... -
Page 285: Clock Recovery
RJ estimation is correct. Jitter decomposition is a key tool to accurately derive each type of jitter as well as total jitter in a system and identify the root causes of jitter quickly. int.siglent.com... -
Page 286: Jitter Measure
SDS7000A User Manual Click Jitter Decomposition to enter the jitter decomposition configuration menu. A. Set the pattern mode between Auto and Manual. In the Manual mode, the pattern length in bits, which represents the repetition period of the data sequence, can be set as user input. - Page 287 Difference between the positive duty cycle of two adjacent cycles. For clock +Duty@C2C data only. Difference between the negative duty cycle of two adjacent cycles. For clock -Duty@C2C data only. Decomposition Time Interval Error (TIE) is the time difference between the signal edge and the reference clock. int.siglent.com...
- Page 288 SDS7000A User Manual Random jitter (RJ) also called Gaussian jitter, is unpredictable electronic timing noise. RJ is caused by thermal noise in an electrical circuit or due to the central limit theorem. Random jitter is unbounded and commonly specified by the standard deviation σ.
-
Page 289: Other Operation
This indicates that we should use signals with edges as fast as possible during jitter testing, and keep the signal at full scale of the oscilloscope by adjusting the vertical scale. int.siglent.com... -
Page 290: Compliance Test
SDS7000A User Manual Compliance Test Click Analysis > Compliance Test to enter the Compliance Test setting menu. The SDS7000A can perform automatic and semi-automatic compliance tests according to the specified protocol test specifications. The supported protocols include USB2.0, 100M Ethernet, 1000M Ethernet, Automtive Ethernet, etc. -
Page 291: Waveform Generator
B. Select the waveform type (Sine, Square, Ramp, Pulse, Noise, DC, and Arb) C. Set the frequency D. Set the amplitude E. Set the offset Other AWG settings: Output load, overvoltage protection, and so on. G. AWG system information and firmware upgrade int.siglent.com... -
Page 292: Wave Type
SDS7000A User Manual 35.2. Wave Type The AWG function provides six standard waveforms and multiple arbitrary waveforms. The standard waveforms are Sine, Square, Ramp, Pulse, Noise, and DC. The following table shows all waveform types and corresponding parameters. Wave Type Parameters Sine Frequency, Amplitude, Offset... -
Page 293: Other Setting
Common, Math, Engine, Window, and Trigo. Stored waveforms are located in the Stored menu. Users can edit arbitrary waveforms using SIGLENT EasyWaveX PC software, send the stored waveforms to the instrument through the remote interface, or import the stored waveforms through a U disk. -
Page 294: System
SDS7000A User Manual Zero Adjust The output zero error of the AWG can be calibrated by using auto mode or manual mode. The object of the Zero Adjust is: when AWG outputs a 0 V DC signal, the measured mean value of the corresponding channel is within ±... - Page 295 Click Upgrade to start the upgrade progress. A progress bar shows the percentage finished. After the upgrade, reboot the oscilloscope. Enter the System dialog box again to check if the upgraded hardware version number is consistent with the target version. Warning: Don't cut off the power during the upgrade ! int.siglent.com...
-
Page 296: Display
SDS7000A User Manual Display Display settings include display type of waveform, color, persistence, grid type, trace brightness, graticule brightness, etc. Click the menu Display > Menu to recall the display dialog box. A. Switch the waveform display type to Vectors (line display) or Dots B. -
Page 297: Display Type
See the section of "Acquisition Setup" for details of interpolation. Dots: Displays the raw samples directly. You can visually see each sampling point and use the cursor to measure the X and Y values of that point. Vector Display Dot Display int.siglent.com... -
Page 298: Color Grade
SDS7000A User Manual Note: In the Run state, due to the high waveform update rate of the oscilloscope, the waveform displayed is the superposition of multiple frames. Therefore, what is seen using the dots display is not the discrete sampling points, but the display effect similar to equivalent sampling. -
Page 299: Set Persist
When the display dialog box and persist are off, performing Display > Persistence can turn on persist. Click Persist in the display dialog box to set the persistence time. Off: Turn off persist. Variable persist time (100ms, 200ms, 500ms, 1s, 5s, 10s, 30s): Choose different persist times. int.siglent.com... -
Page 300: Set Grid
SDS7000A User Manual The oscilloscope updates with the newly acquired waveform display. Acquired waveforms will be cleared after the corresponding time has expired. Infinite: Select “Infinite”, previous acquisitions will never be erased until a Clear Display operation is performed. 36.4. -
Page 301: Color Setting
Click the Default area to restore the default color for all channels. Select a color directly on the palette and preview its hue, saturation, light, and RGB values or directly modify the color parameters to customize the color. After the change, click OK to confirm. int.siglent.com... -
Page 302: Axis Label Setting
SDS7000A User Manual 36.6. Axis Label Setting Turn on the axis label, the horizontal axis label will be displayed at the bottom of the grid, and the vertical axis label will be displayed at the left of the grid. There are two display modes of the axis labels: moving and fixed. -
Page 303: Window Layout Setting
Zoom window (refer to the chapter "Zoom" for details). The fast-refreshed Zoom waveform can only be displayed in the Zoom window. In addition to the fast-refreshed Zoom waveform, the amplified waveforms of other waveforms (ZF1~ZF4, ZM1~ZM4, etc.) can also be displayed in this window. Main window Zoom window int.siglent.com... - Page 304 SDS7000A User Manual When the window layout scheme is "Auto", if Zoom is closed, only one default window will be displayed; If Zoom is open, two windows will be displayed in 2x1 mode, with the main window at the top and the Zoom window at the bottom.
-
Page 305: Multiple Displays Setting
" Duplicate ", the external monitor displays the same content as the oscilloscope. When the display mode is "Extend", the external monitor acts as an extension of the oscilloscope's main dispaly and a window in the main display can be dragged to the external monitor. int.siglent.com... -
Page 306: Save/Recall
SDS7000A User Manual Save/Recall The SDS7000A supports saving setups, screenshots, and waveform data files to internal storage, external USB storage devices (e.g. U disk), or network storage. Saved setups and waveforms can be recalled as needed. For details on network storage, refer to the section “SMB File Share”. Save Type 37.1. - Page 307 The following table shows the relationship between the save types and save/recall operations. Type Save to External Recall √ √ Setup √ × √ × √ × √ Binary Data × √ CSV Data × √ Matlab Data × √ FileConverter × √ Memory × int.siglent.com...
-
Page 308: File Manager
SDS7000A User Manual 37.2. File Manager The SDS7000A's file manager has a similar style and operation to the Windows© operating systems. A. Address bar, displays the path where the current file list is located. It includes some shortcut operations on paths, as shown in Table below. B. -
Page 309: Save And Recall Instances
Click File Manager to open the file manager Select the “\Udisk0\sds6l\” directory in the file manager. Click Save As , click the pop-up text box to recall the virtual keyboard and input the file name, and then click OK : int.siglent.com... - Page 310 In step 4, if Save is selected instead of Save As , the system saves the file as the default file name SDS7xxxA_BMP_n.bmp, where n is an integer incrementing from 1. The default save path is \SIGLENT\. Recall the setup file " Track.xml" stored in path “Udisk0\sds6l\”...
-
Page 311: Quick Save And Screenshot
See the section "Save Button" for details. For simple screenshot requirements, perform Utility > Print to quickly save screenshots, or directly click the icon at the top right of the window to take a screenshot for the specified window. int.siglent.com... -
Page 312: Utility
SDS7000A User Manual Utility This function module supports the auxiliary functions of oscilloscope, such as viewing system status, setting interface language and sound, and some advanced settings, such as performing self-calibration, upgrading software version and setting interface communication. 38.1. System Information Operate Utility >... -
Page 313: Screen Saver
Date/Time 38.2.4. The SDS7000L has an RTC clock, which helps to record absolute time information for screenshots, history frames, and so on. Operate Utility > Menu > System Setting > Date/Time to open the Date/Time dialog box: int.siglent.com... -
Page 314: Reference Position
SDS7000A User Manual Click the text box of Hour, Minute, Second, Day, Month, and Year to edit these fields. Click the text box of Time Format to select the event format. Click the Modify Date/ Time button to perform the change. ... - Page 315 Take Horizontal Ref as an example to demonstrate the scaling effect of different settings: Timebase = 10 ns/div, Horizontal Delay = -20 ns = - 2 div Fixed position, timebase is changed to 5 ns/div, the grid number of delay (-2div) remains fixed, while the horizontal delay changes to -10 ns int.siglent.com...
-
Page 316: Touch Screen
SDS7000A User Manual Fixed delay, timebase is changed to 5 ns/div, the horizontal delay value remains fixed, while the grid number of delay changes to -4div Touch Screen 38.2.6. Perform Utility > Menu > System Settings > Touch Screen or press the Touch button on the front panel to enable the touch screen function. -
Page 317: I/O Setting
IP. Set the static IP address, subnet mask, and gateway separately. D. When accessing more than two SIGLENT instruments through the web browser, it is necessary to set a different VNC port number for each instrument. The range is from 5900 to 5999. -
Page 318: Install Options
The clock source is external, but no valid external clock is detected. 38.4. Install Options The SDS7000A provides a few options to enhance its functionality. Contact your local SIGLENT sales representative or SIGLENT technical support to get the corresponding option key. -
Page 319: Maintenance
(*.ads) to the local memory and parses it. If the parse succeeds, it will show the following dialog. Users can choose Cancel to cancel the upgrade or Reboot to restart the oscilloscope immediately and continue the upgrade. Otherwise, the oscilloscope will restart automatically to finish the upgrade. int.siglent.com... -
Page 320: Self-Calibration
SDS7000A User Manual After the reboot, check if the version number is in the "System Information". Warning: Do not turn off the power during upgrading. Otherwise, the oscilloscope may not boot up! Self-Calibration 38.5.2. The self-calibration program can quickly calibrate the oscilloscope to reach the best working state and the most precise measurement. -
Page 321: Self Test
Perform Utility > Menu > Maintenance > Self Test > Screen Test , and the oscilloscope will enter the screen test interface as shown below. The screen displays in pure red at first. Press the Single button to switch to green and blue display mode. Observe whether there is any int.siglent.com... - Page 322 SDS7000A User Manual color distortion, bad pixels, or scratches on the screen. Press the Run/Stop button to exit the screen test mode. Keyboard Test The keyboard test is used to check whether the oscilloscope front panel buttons or knobs are responsive or sensitive.
-
Page 323: Developer Options
Press the Single button to check the next button. Press the Single button consecutively until all the backlights are tested. Press the Run/Stop button to exit the LED test. Developer Options 38.5.4. This function is used for internal development by SIGLENT. int.siglent.com... -
Page 324: Service
SDS7000A User Manual 38.6. Service SMB File Share 38.6.1. Perform Unity > Menu > Services > SMB file share to enter the “Mount SMB File Share” interface. SDS7000A supports two types of SMB settings: Client and Server. When the SDS7000A serves as Client, set the network storage path and the content related to access permissions, then the SDS7000A can store or recall files on the specified path. -
Page 325: Web
When the “Emulation” option is set to “Tektronix”, the SCPI command set of the instrument is changed to be compatible with Tek. This setting can help the user switch from a Tek scope with minimum changes to the existing code. int.siglent.com... -
Page 326: Save Button
SDS7000A User Manual 38.7. Save Button Press the Save button to save a screenshot or the specified type file to the path where the last file was saved. Perform Unity > Save Button to enter the “Save Button” settings dialog box: Set the type of the button: ScreenShot or Save to. -
Page 327: Troubleshooting
Check whether the power switch is on. Check whether the fuse is burned out. If the fuse needs to be changed, please contact SIGLENT timely and return the instrument to the factory for replacement by the maintenance personnel authorized by SIGLENT. - Page 328 Make sure that the U disk system format is FAT32. Restart the instrument and then insert the USB storage device to check it. If the USB storage device still cannot be used normally, please contact SIGLENT. 3 1 6 i n t . s i g l e n t . c o m...
- Page 329 DC power supplies, electronic loads and other general purpose test instrumentation. Since its first oscilloscope was launched in 2005, SIGLENT has become the fastest growing manufacturer of digital oscilloscopes. We firmly believe that today SIGLENT is the best value in electronic test & measurement. Headquarters: SIGLENT Technologies Co., Ltd...
Need help?
Do you have a question about the SDS7000A Series and is the answer not in the manual?
Questions and answers