Table of Contents
Advertisement
Advertisement
Table of Contents
Troubleshooting

Related Manuals for SIGLENT SDS1022DL


Summary of Contents for SIGLENT SDS1022DL
- Page 1 User Manual Digital Storage Oscilloscope Version No.: V 1.6...
- Page 2 Declaration Copyright © MY COMPANY. All rights reserved. Contents in this Manual are not allowed to copy, extract and translate before being allowed by MY Company.
-
Page 3: Digital Storage Oscilloscope Brief Introduction
Digital Storage Oscilloscope Brief Introduction Model: 500MSa/s real-time sampling rate Series Bandwidth: 25MHZ,40MHZ,60MHZ,100MHZ,200MHZ 1GSa/s real-time sampling rate Series Bandwidth: 40MHZ,60MHZ,100MHZ, 150 MHZ,200MHZ 2GSa/s real-time sampling rate Series Bandwidth: 60MHZ,100MHZ, 200 MHz,300MHz Characteristic: ● The volume of the oscilloscope is cabinet and it is portable ●... - Page 4 ● Support Multilingual help system online ● Standard setup interface: USB Host: Support USB flash drive storage/recall function and update firmware; USB Device: Support PictBridge compatible printer and support PC remote control; RS-232/ RJ-45 Connector ;Pass/Fail output Digital Storage Oscilloscope Accessories: ●...
- Page 5 General safety summary General Safety Summary Review the following safety precautions to avoid injury and prevent damage to this product or any products connected to it. To avoid potential hazards, use this product only as specified. Only qualified personnel should perform service procedures. 1.
- Page 6 ● Avoid Exposed Circuitry. Do not touch exposed connections and components when power is present. ● Do Not Operate With Suspected Failures. If you suspect there is damage to this product, have it inspected by qualified service personnel. ● Do Not Operate in Wet/Damp Conditions. ●...
- Page 7 preface Preface This manual contains operating information for the Digital Storage Oscilloscopes. The manual consists of the following chapters: ◆ “Accidence” chapter describes the front panel; display area of the oscilloscope; Functional Check and Probe Compensation briefly. ◆ “Functions Instruction and Operation” chapter describes function and operation of the Oscilloscope systemically.
-
Page 9: Table Of Contents
Catalogue Storage Digital Oscilloscope introduction............... II General Safety Requirement............... ….....IV Preface..........................VI User Manual ........................I Digital Storage Oscilloscope Brief Introduction ............III Chapter 1 Accidence ......................3 1.1 Accidence of the front panel and user interface..........4 1.2 Function checking....................8 1.3 Probe........................9 1.3.1 Probe Safety.....................9 1.3.2 Probe Attenuation Setting................9 1.3.3 Probe Compensation ..................10... - Page 10 2.13.6 Update Firmware ..................97 2.13.7 Pass/Fail.......................97 2.13.8 Waveform Record ..................101 2.13.9 Recorder.....................104 2.14 Online Help Function .................107 Chapter3 Application Examples.................. 108 3.1Taking Simple Measurements .................109 3.2 Taking Cursor Measurements ................. 111 3.2.1 Measuring Ring Frequency................111 3.2.2 Measuring Ring Amplitude ................. 112 3.3 Catch the single signal ..................
-
Page 11: Chapter 1 Accidence
Chapter 1 Accidence Digital Storage Oscilloscope is mini-type and portable bench type instruments, which could be used for measuring as the GND voltage. This Chapter shows you how to operate following tasks: ◆ Accidence of the front panel and user interface ◆... -
Page 12: Accidence Of The Front Panel And User Interface
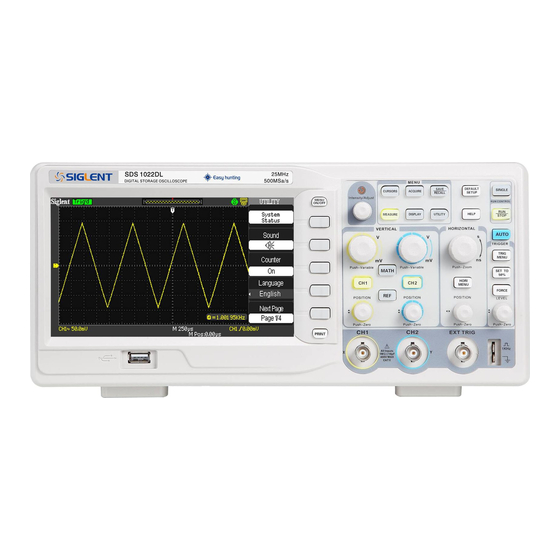
1.1 Accidence of the front panel and user interface It is important for you to understand the DSO’s front panel before operating it. The following contents are the brief introduction for the front panel function, which is useful to be familiar with the operation of the Digital Storage Oscilloscope in short time. - Page 13 Menu Universal Common Function AUTO Button Knob Button Button Horizontal Control Option Button Vertical Control Trigger Control USB Host Print Signal input Trigger button channel input channel Picture 1-1.1 Front Panel Controls(4 Channel model) Picture 1-2 Display area(5.7’ LCD model)
- Page 14 1. Trigger status Armed:The oscilloscope is acquiring pre-trigger data. All triggers are ignored in this state. Ready: All pre-trigger data has been acquired and the oscilloscope is ready to accept a trigger. Trig’d: The oscilloscope has seen a trigger and is acquiring the posttrigger data. Stop: The oscilloscope has stopped acquiring waveform data.
- Page 15 1.1.2 Back and Side Connections Oscilloscope Picture 1- 3(2 Channel model) 1、 Pass/Fail Output 2、 RS-232 Connector 3、 Back USB Connector 4、 Power Input Connector Picture 1- 3.1(4 Channel model) 1、 Security Lock Receptacle 2、 Pass/Fail Output 3、 RJ-45 Connector 4、...
-
Page 16: Function Checking
1.2 Function checking When you check whether or not the oscilloscope could work smoothly, please operate as following: 1. Power On the oscilloscope. Press “DEFAULT SETUP” to show the result of the self check. The probe default attenuation is 1X. 2. -
Page 17: Probe
1.3 Probe 1.3.1 Probe Safety A guard around the probe body provides a finger barrier for protection from electric shock. Picture 1-6 Connect the probe to the oscilloscope and connect the ground terminal to ground before you take any measurements. Note:... -
Page 18: Probe Compensation
Note. The default setting for the Probe option is 1X. Be sure that the attenuation switch on the probe matches the Probe option in the oscilloscope. Switch settings are 1X and 10X. Note. When the attenuation switch is set to 1X, the probe limits the bandwidth of the oscilloscope to 10MHz. - Page 19 . Check the shape of the displayed waveform. under compensated Compensated correctly over compensated Picture 1-8 4. If necessary, adjust your probe. Repeat as necessary.
-
Page 20: Chapter 2 Functions Instruction And Operation
Chapter 2 Functions Instruction and Operation To use your oscilloscope effectively, you need to learn about the following oscilloscope functions: Menu and control button ◆ Connector ◆ Auto Setup ◆ Default Setup ◆ Universal knob ◆ Vertical System ◆ Horizontal System ◆... - Page 21 Picture 2-1 All models: ■ CH1、CH2: Channel 1, channel 2 menu control button. ■ MATH: MATH function control button. ■ REF: Reference waveforms control button. ■ HORI MENU: Horizontal control button. ■ TRIG MENU: Trigger control button. ■ SET TO 50%: Set the trigger level to midpoint of the signal amplitude. ■...
-
Page 22: Connector
button), the SEC/DIV control expands or compresses the waveform. ■ SINGLE: Acquire a single waveform and then stops. 2.2 Connector Picture 2-2 ■ CH1、CH2: Input connectors for waveform display. ■ EXT TRIG: Input connector for an external trigger source. Use the Trigger Menu to select the “Ext”... -
Page 23: Auto Setup
2.3 Auto setup The Digital Storage Oscilloscopes have auto setup function, which can identify the type of waveform and adjust controls to produce a usable display of the input signal. “AUTO” is the auto Set up button. Table 2-1 Auto set function Menu: Option Introduction Auto set the screen and display several... - Page 24 Picture 2-3 Table 2-2 Auto set the function item Function Setting Acquire Mode Adjusted to Sampling Display Format Display Type Set to Dots for a video signal, set to Vectors for an FFT spectrum; otherwise, unchanged Vertical Coupling Adjusted to DC or AC according to the input signal Bandwidth Limit Off(full)
-
Page 25: Default Setup
2.4 Default setup The oscilloscope is set up for normal operation when it is shipped from the factory. This is the default setup. To recall this setup, press the DEFAULT SETUP button. The options, buttons and controls that change settings when you press the DEFAULT SETUP button, refer to appendix C. -
Page 26: Universal Knob
2.5 Universal knob Universal knob Picture 2-4 The Digital Storage Oscilloscope has a special knob-the “Universal” knob, Using this knob can adjust the holdoff time, move cursors, set the pulse width, Set the Video Linage, adjust frequency upper limit or frequency lower limit of the digital filter, adjust x mask and y mask in pass/fail function and adjust the record frame or play back frame in waveform record menu etc. -
Page 27: Vertical System
2.6 Vertical System Showing as follow picture, the buttons and knobs are useful in the vertical system Volt/div knob Vertical POSITION knob Picture 2-5 The vertical control, which each channel has, could be used for displaying waveform, rectify scale and position. 2.6.1 CH1、CH2、CH3、CH4 Channel Table 2-3 CH1、CH2、CH3、CH4 function menu 1: Option... - Page 28 Table 2-4 CH1 、 CH2 、 CH3、 CH4 function menu 2: Option Setting Instruction Invert Turn on invert function. Turn off invert function. Input Setup 1MΩ as input impedance 1MΩ Digital Filter Press this button to enter the “Digital Filter menu”.(See table 2-5) Next Page Page 2/2...
- Page 29 Setting up the CH1、CH2、CH3、CH4 Channels Each channel has its own separate Menu. The items are set up separately according to each channel. 1. Set up the channel couple Take the CH1 for example; the tested signal is a sine wave signal with DC deflection: ●...
- Page 30 Picture 2-7 ● Press“CH1”→“Coupling”→“GND”, Set to GROUND mode. It disconnects the input signal. Set to GND coupling Picture 2-8 GND Status 2. Set up the channel bandwidth limit Take the CH1 for example; the tested signal is a pulse signal with the high frequency surge: ●...
- Page 31 Set off bandwidth Picture 2-10 3. Volts/Div settings Vertical scale adjust have Coarse and fine two modes, Vertical sensitivity range is 2mV/div~5V/div scale or 2mV/div~10V/div scale Take the CH1 for example: ● Press“CH1”→“Volts/Div”→“Coarse”. It is the default setting of Volts/Div, and it makes the vertical scaling in a 1-2-5-step sequence from 2mv/div, 5mv/div, 10mv/div to 10v/div.
- Page 32 Set to Fine Picture 2-12 4. Probe attenuation set In order to assort the attenuation coefficient, you need to response in the channel operation Menu. If the attenuation coefficient is 10:1, the input coefficient should be set to 10X, so that the mistake of the Volts/div information and measure testing should be forbidden.
- Page 33 Picture 2-14 ● Press“CH1”→“Invert”→“Off”: Picture 2-15 6. Digital Filter Press “CH1”→“Next Page”→ “Filter”, display the digital filter menu. Select “Filter Type”, then select “Upper Limit” or “Lower Limit” and turn the “Universal” knob to adjust them. ● Press “CH1”→“Next Page”→ “Filter” →“Off”. Turn off the Digital Filter function.
-
Page 34: The Using Of The Vertical "Position" Knob And "Volt/Div" Knob In The Vertical System
Picture 2-16 ● Press “CH1”→ “Next Page”→ “Filter” → “On”. Turn on the Digital Filter function. Picture 2-17 2.6.2 The Using of the Vertical “Position” knob and “Volt/div” knob in the vertical system ■ Vertical “POSITION” knob 1. Use the Vertical “POSITION” knobs to move the channel waveforms up or down on the screen. -
Page 35: Math Functions
■ “Volts/div” knob 1. Use the “Volts/div” knobs to control how the oscilloscope amplifies or attenuates the source signal of channel waveforms. When you turn the “volts/div” knob, the oscilloscope increases or decreases the vertical size of the waveform on the screen with respect to the ground level;... - Page 36 CH1 waveform add CH2waveform, see picture 2-18: MATH Waveform Picture 2-18 1. FFT Spectrum Analyzer The FFT process mathematically converts a time-domain signal into its frequency components. You can use the Math FFT mode to view the following types of signals: ●...
- Page 37 Table 2-9 FFT function menu 2: FFT Option Setting Introduction Scale Vrms Set Vrms to be the Vertical Scale unit. dBVrms Set dBVrms to be the vertical Scale unit. Split Display FFT waveform on half screen. Display Full screen Display FFT waveform on full screen. Page 2/2 Return the first page of FFT menu.
- Page 38 2. Displaying the FFT Spectrum Press the MATH button to display the Math Menu. Use the options to select the Source channel, Window algorithm, and FFT Zoom factor. You can display only one FFT spectrum at a time. You can select “Full screen” or “Split” in “Display” option to display FFT waveform on full screen or display channel waveform and its FFT waveform on half screen at a time.
- Page 39 waveform starts and ends at the me amplitude and there are no discontinuities in the signal shape A non-integral number of cycles in the YT waveform causes the signal start and end points to be at different amplitudes. The transitions between the start and end points cause discontinuities in the signal that introduce high-frequency transients.
- Page 40 frequency (in Hz). Magnitude is referenced to 0 dB, where 0 dB equals 1 VRMS. You can use the cursors to take measurements at any zoom factor. (Refer to cursor measure2.11.2) Use horizontal cursors to measure amplitude and vertical cursors to measure frequency.
- Page 41 Picture 2-21 2. Measure FFT Frequency 1) Press the CURSOR button. 2) Press the “Cursor Mode” button to select “Manual”. 3) Press the “Type” option button to select “Time”. 4) Press the “Source” option button to select “MATH”. 5) Press the “CurA” option button, turn the “Universal” button to move Cursor A to the highest position of the FFT waveform.
-
Page 42: Using Ref
● The FFT of a waveform that has a DC component or offset can NOTE: cause incorrect FFT waveform magnitude values. To minimize the DC component, choose AC Coupling on the source waveform. ● To display FFT waveforms with a large dynamic range, use the dBVrms scale. - Page 43 Picture 2-23 Operation step: 1. Press the “REF” menu button to display the “Reference waveform menu”. 2. Press the “Source” option button to select input signal channel. 3. Turn the ” knob and “Volt/div” knob to adjust the vertical “POSITION vertical position and scale to conformable positions.
-
Page 44: Horizontal System
2.7 Horizontal System As follow Picture, there are one button and two knobs in the HORIZONTAL area. S/div knob Horizontal “POSITION” knob Picture 2- 25 Table 2- 12 4Kpts memory depth Series Horizontal system function menu: Option Introduction Main Display the waveform. Win Zone Two Cursors define one window;... -
Page 45: Horizontal Control Knob
2.7.1 Horizontal control knob You can use the horizontal controls to change the horizontal scale and position of waveforms. The horizontal position readout shows the time represented by the center of the screen, using the time of the trigger as zero. Changing the horizontal scale causes the waveform to expand or contract around the screen center. - Page 46 You can turn the Horizontal Position and SEC/DIV controls to enlarge or minish waveforms in the Window Zone. If you want to see a section of the waveform in detail, follow these steps: 4K/18K/24Kpts memory depth Series Operate steps: 1. Press the “HORI MENU” button to enter the “Horizontal menu”. 2.
- Page 47 Picture 2-28 32K/40K/2Mpts memory depth Series operate steps: (1) Press the “HORI MENU” button to enter the “Horizontal menu”. (2) Turn the “S/div” knob to change the main timebase scale. (3) Press the “Delayed” option button to select “On”. Turn the “Horizontal Position” knob (adjust window’s position) to select the window that your need and expanded window waveform display on the below half screen at the same time(See picture 2-28-1) Picture 2-28-1...
-
Page 48: Trigger System
2.8 Trigger System The trigger determines when the oscilloscope starts to acquire data and display a waveform. When a trigger is set up properly, the oscilloscope converts unstable displays or blank screens into meaningful waveforms. Here are three buttons and one Knob in the Trigger area. Showing as Picture.2-29: LEVEL knob Picture 2-29 ■... -
Page 49: Signal Source
The feature is very useful because you can see the events that led up the trigger point everything to the right of the trigger point is called posttrigger information the amount of delay range (pre-trigger and posttrigger information) available is dependent on the sweep speed selected. - Page 50 Auto Use this mode to let the acquisition free-run in the Mode absence of a valid trigger; This mode allows an untriggered, scanning waveform at 100 ms/div or slower time base settings. Normal Use this mode when you want to see only valid triggered waveforms;...
- Page 51 2) Press the “Type” option button to select “Edge”. 2. Set up Source According to input signal, press the “Source” option button to select “CH1”, “CH2”, “CH3” , “CH4” , “EXT”, “EXT/5”or “AC Line”. 3. Set up Slope Press the “Slope” option button to select “ ”...
- Page 52 When Select how to compare the (Positive pulse width less than pulse trigger pulse relative to the width setting) value selected in the Set Pulse Width option. (Positive pulse width larger than pulse width setting) (Positive pulse width equal to pulse width setting) (Negative pulse width less than pulse width setting)
- Page 53 Picture 2-32 Operate Instruction: 1. Set up Type 1) Press the “TRIG MENU” button to display “Trigger menu”. 2) Press the “Type” option button to select “Pulse”. 2. Set up condition Press the “When” option button to select “ ”、“ ”、“...
- Page 54 All lines Select appropriate video sync. Odd field Even Field Next Page Page 1/2 Enter the second page of “Video trigger menu”. Picture 2-33 Table 2-18 Functional Manu of Video Trigger 2: Option Setting Instruction Type Video When you select the video type, put the couple set to the AC, then you could trigger the NTSC,PAL and SECAM video...
- Page 55 Picture 2-34 Operate Instruction: 1. Set up Type 1) Press the “TRIG MENU” button to display “Trigger” 2) Press the “Type” option button to select “Video”. 2. Set up Polarity Press the “Polarity” option button to select “ ” or “ ”.
- Page 56 EXT/5 When Select trigger condition. Time Turn the “Universal” knob to set slope time. Time setup range is 〈Set time〉 20ns-10s. Next Page Page 1/2 Enter the second page of slope trigger. Picture 2-35 Table 2-20 Slope trigger function menu 2 Option Setting Instruction...
- Page 57 oscilloscope does not display a waveform until after the first trigger. when you want the oscilloscope to Single acquire a single waveform, press the “SINGLE ”button. Enter the “Trigger setup menu”(See Set up table 2-14). Next Page Page 2/2 Return the first page of slope trigger. Picture 2-36 Operate Instruction: Follow nest steps if you select “Slope trigger”:...
- Page 58 Alternative trigger ■ The trigger signal comes from two vertical channels when you use alternative trigger. In this mode, you can observe two irrelative signals at the same time. You can select different trigger types for two vertical signals, and selected types cover edge, pulse, video and slope trigger.
- Page 59 Set trigger type information for CHX signal Source Set trigger type information for CHY signal Set trigger type of the vertical channel signal to Mode Pulse Pulse trigger. Select how to compare the trigger pulse relative to the value selected in the Set Pulse Width When option.
- Page 60 Next Page Page 1/2 Enter the second page of Alternative trigger menu. Table 2-26 Set trigger mode to slope trigger function menu 1 Option Setting Instruction Type Alternative The trigger signal comes from two vertical channels when you use alternative trigger. In this mode, you can observe two irrelative signals at the same time.
-
Page 61: Coupling
8. Set the trigger according to trigger edge. 9. Press the “Source” option button to select “CHY”. 10. Turn the “S/div” knob to optimize waveform display. 11. Repeat steps 7 and 8. 2.8.3 Coupling Use the “Coupling” to make sure the signal that passes the trigger circuit. It is useful for us to gather a steady wave form. -
Page 62: Trigger Holdoff
Picture 2-38 Note: ● Press the SINGLE button when you want the oscilloscope to acquire a single waveform. ●. Trigger coupling affects only the signal passed to the trigger system. It does not affect the bandwidth or coupling of the signal displayed on the screen. -
Page 63: Acquiring Signals System
2.9 Acquiring Signals system Showing as the follow picture,the “ACQUIRE” button for Acquiring Signals system is at the menu. Acquire button Picture 2-40 Table 2-28 The Function manual of Acquiring Signals: Option Setting Introduction Acquisition Sampling Use for sampling and accurately display most of the waveform. - Page 64 spaced intervals to construct the waveform. This mode accurately represents signals most of the time. Advantage: You can use this mode to reduce random noise. Disadvantage: This mode does not acquire rapid variations in the signal that may occur between samples. This can result in aliasing may cause narrow pulses to be missed.
- Page 65 Average: The oscilloscope acquires several waveforms, averages them, and ■ displays the resulting waveform. Advantage: You can use this mode to reduce random noise. Picture 2-43 Average mode Equivalent Time Sampling: ■ The equivalent time sampling mode can achieve up to 20 ps of horizontal resolution (equivalent to 50GSa/s).
- Page 66 2). Continue to acquire data while waiting for the trigger condition to occur. 3). Detect the trigger condition. 4). Continue to acquire data until the waveform record is full. 5). Display the newly-acquired waveform. ■ Base time: The oscilloscope digitizes waveforms by acquiring the value of an input signal at discrete points.
- Page 67 “On” is sin interpolation Picture 2-45 “Off”is linear interpolation. Picture 2-46 Set up Sampling mode Press the “Mode” option button to select “Real Time” or “Equ Time”. Set up Sampling rate In “Real time” mode, turn the “S/div” knob to display the real time sampling rate at corresponding time base scale;...
-
Page 68: Display System
2.10 Display System The display function could be expressed by the “DISPLAY” Button. Display System Picture 2-47 Table 2-29 Display system function menu 1: Option Setting Introduction Type Vectors Vectors fills the space between Dots adjacent sample points in the display. - Page 69 Table 2-30 Display system function menu 2: Option Setting Introduction Format YT format displays the vertical voltage in relation to time (horizontal scale). XY format displays a dot each time a sample is acquired on channel 1 and channel 2. Screen Normal set to normal mode.
- Page 70 Picture 2-50 Operate Introduction: 1. Set up waveform display type 1) Press the “DISPLAY” button to enter the “Display” menu. 2) Press the “Type” option button to select “Vectors” or “Dots”. 2. Set up Persist Press the “Persist” option button to select “Off”, “1 Sec”, “2 Sec”, “5Sec” or “Infinite”.
-
Page 71: X-Y Format
adjust grid brightness. 4. Set up display format 1) Press the “Next Page” option button to enter second display menu. 2) Press the “Format” option button to select “YT” or “XY”. 5. Set up Screen Press the “Screen” option button to select “Normal” or “Inverted” to set the screen display color. - Page 72 Operation steps : ● Channel 1“Volt/div”and vertical “POSITION” set up the horizontal scale and position. ● Channel 2“Volt/div”and vertical “POSITION” set up the horizontal scale and position. ● Turn the “S/div” knob to adjust the sampling rate ● The following functions are forbidden at XY display form: ●...
-
Page 73: Measure System
2.11 Measure System The Oscilloscope displays the voltage in relation to time and test the wave form displayed. There are scale, Cursor and auto measure modes. 2.11.1 Scale Measurement This method allows you to make a quick, visual estimate. For example, you might look at waveform amplitude and determine that it is a little more than 100 mV. - Page 74 Option Setting Instruction Cursor Mode Manual In this menu, set the manual cursor measure. Type Voltage Use cursor to measure voltage parameters. Time Use cursor to measure time parameters. Source Select input signal channel. CH1、 CH2 CH3、 CH4 MATH REFA REFB REFC REFD...
- Page 75 7. The measurement values are displayed on the top of the left corner: If the measurement type is set to “Voltage”, the values are: The value of Cur A: CurA The value of Cur B: Cur B The voltage increment between Cursor A and Cursor B: △V If the measurement type is set to “Time”, the values are: The value of Cur A: CurA The value of Cur B: Cur B...
- Page 76 In this mode, the screen displays two cross cursors. The cross cursor sets the position on the waveform automatically. You could adjust cursor’s horizontal position on the waveform by turning the “Universal” knob. The oscilloscope displays the values on the top of the right screen. To do track cursor measurement, follow these steps: 1.
- Page 77 Picture 2-54 Auto mode Table 2-34 Auto mode function menu: Option Setting Instruction Cursor Mode Auto Set to auto cursor measure mode. This mode will take effect with automatic measurements. The instruments will display cursors while measuring parameters automatically. These cursors demonstrate the physical meanings of these measurements.
-
Page 78: Auto Measurement
2.11.3 Auto Measurement “MEASURE” is Automatic measure function button. Auto Measurement button Picture 2-56 When you take automatic measurements, the oscilloscope does all the calculating for you. Because the measurements use the waveform record points, they are more accurate than the graticule or cursor measurements. Press the ‘MEASURE’... - Page 79 Picture 2-57 Table 2-36 Auto measure function 2-Voltage measure menu: Option Setting Instruction Source Select input signal source for CH1 、CH2、CH3、CH4、MATH、 Voltage measure. REFA、REFB、REFC、REFD Type Vmax, Vmin, Vpp, Vamp, Press the “Type” button or turn Vtop, Vbase, Cycle Mean, the “Universal” knob to select Mean, Cycle Vrms, Vrms, Voltage measure parameter.
- Page 80 Type Press the “Type” button or turn the Phase、 FRR、FRF、FFR、FFF、 “Universal” knob to select Delay LRR、LRF、LFR、LFF measure parameter. Display the corresponding icon 、 、 、 measure value your 、 、 、 selected Delay measure parameter. 、 、 Return Return to the first page of auto measurement menu.
- Page 81 Defined as (Vmax-Vhig)/Vamp after the ROVShoot waveform rising. Defined as (Vmin-Vlow)/Vamp after the FOVShoot waveform falling. Defined as (Vmin-Vlow)/Vamp before the RPREshoot waveform rising. Defined as (Vmax-Vhig)/Vamp before the FPREshoot waveform falling. Rise Time Measures the time between 10% and Rise Time 90% of the first rising edge of the waveform.
- Page 82 2). Press the top first option button to enter the “second measurement menu”. 3). Select measure type. If you press the “Voltage” option button, “Voltage measurement” menu will display on the screen. 4). Press the “Source” option button to select “CH1” or “CH2” according to input signal channel.
- Page 83 parameters value will display on the screen at the same time.(See Picture 2-59) Picture 2-59...
-
Page 84: Storage System
2.12 Storage System Showing as following picture, The SAVE/RECALL is the Storage System Functional Button. Storage system control button Picture 2-60 The scope can save 2 groups’ reference waveforms, 20 groups’ setups and 20 groups’ waveforms to the oscilloscope’s internal memorizer. There is a USB Host interface in the front panel of the oscilloscope and you can save setup data, waveform data, waveform interface image, CSV file to a USB flash drive furthest at a time. - Page 85 Select operating object Create new files in present directorys Delete present file Recall stored files or present settings Picture 2-62 Modify the file name Return to the last menu Picture 2-63 In this module,Setting stores to File,Waveform stores to File,storing pictures and CSV stores to USB flash drive all have this function.Users can modify the name of the file or the directorys , then store the files.
- Page 86 Type Setups Menu for the Storage/Recall setting in the oscilloscope Save to Device Save setup to the oscilloscope’s internal memorizer. Setup No.1 to No.20 Press the “Setup” option button or turn the “universal” knob to select storage position. Save Accomplish the storage Recall Recall the storage in the “Setup”...
- Page 87 1) Press the “SAVE/RECALL” button to enter the “SAVE/RECALL” display menu. 2) Press the “Type” option button to select “Setups”. 3) Press the “Save to” option button to select “Device”. 4) Press the “Setup” option button or turn the “Universal” knob to select “No.1”. 5)...
- Page 88 5) Press the “New folder” button to creat a new folder 6) Press the “Del folder” option button to delete a folder 7) Press the “Modify” option button to modify a folder. 8) Press the “New file” option button to creat a new file 9)...
- Page 89 Picture 2-66 SAVE/RECALL WAVEFORM SAVE/RECALL CAPTURED WAVEFORM: The oscilloscope must ■ display any waveform that you want to save. The oscilloscopes can store twenty captured waveforms in nonvolatile memory. Save waveforms to Device ■ Table 2-44 Save waveform to device function menu: Option Setup Introduction...
- Page 90 Picture 2-67 Save waveforms to the oscilloscope’s internal memorizer, follow these steps: 1). Input a sine signal to channel 1 and press the “Auto” button. 2). Press the “SAVE/RECALL” button to enter “SAVE/RECALL” display menu. 3). Press the “Type” option button to select “waveforms”. 4).
- Page 91 ■ Save waveforms to USB flash drive Table 2-45 Save waveforms to USB flash drive function menu: Option Setup Introduction Type Waveforms Menu for the Storage/Recall waveforms. Save to File Save waveforms to USB flash drive. Save Accomplish the storage. Picture 2-68 Save waveforms to USB flash drive, follow these steps: 1)...
- Page 92 6) . Choose the file you want then press the “Load” option button (about five seconds, there is a prompting message that “Recall data success” displaying on the screen), now waveform data have been recalled from USB flash drive. Save Picture ■...
- Page 93 oscilloscope has initialized USB flash drive (about ten seconds). 5). Press the “Print Key” option button to select “Save Picture”. 6). Press the “Save” option button then go into the Save/Recall interface”. 7). Press the “Save” buton then you’ll go into the Save/Recall interface 8).
- Page 94 Picture 2-70 Save CSV file to USB flash drive, follow these steps: 1). Press the “SAVE/RECALL” button to enter “SAVE/RECALL” menu. 2). Press the “Type” option button to select “CSV”. 3). Insert USB flash drive to USB host port of the oscilloscope and wait that the oscilloscope has initialized USB flash drive(about ten seconds).
-
Page 95: Utility System
2.13 Utility System “UTILITY”: The Utility System Button。 Utility Setup button Picture 2-71 Table 2-48 Utility System function menu 1: Option Setting Introduction System Displays summaries of the oscilloscope Status settings. Sound Open the key-press voice. Close the key-press voice. Counter Turn on Frequency Counter Turn off Frequency Counter. - Page 96 Picture 2-72 Table 2-49 Utility System function menu 2: Option Setting Introduction Do self cal Auto self emendation. Do Self Test Screen Test Run the screen detect program Keyboard Test Run the keyboard detect program LED Test Run the dot lighten detect program. Print Setup Enter the print setup menu to set print options.
- Page 97 Table 2-50 Functional Menu of the Utility System 3: Option Setting Introduction Update You can update the oscilloscope use USB flash firmware Driver (About need two minutes). Pass/Fail Pres this button to enter the “Pass/Fail menu”. Record Press this button to enter the waveform record menu.
-
Page 98: System Status
Picture 2-75 2.13.1 System status Selecting “System Status” from the Utility Menu to display a series of information about this oscilloscope Picture 2-76 Table 2-52 System status instruction: Option Introduction Startup Times List the boot-strap times. Software version List the software version. Hardware Version List the hardware version. -
Page 99: Language
2.13.2 Language The oscilloscopes have twelve languages’ user menu to be selected. Press the “Utility” button →“language” to select language. Picture 2-77 2.13.3 Print The oscilloscopes support PictBridge compatible printers. You can connect the back USB port of the oscilloscope to the USB port of the PictBridge compatible printer using the USB cable. - Page 100 Print Key Print Key Select “Print Picture” option when Print Picture the oscilloscope connects to the printer, press the “S/div” knob to print the picture. Select “Save Picture” option when you insert the USB flash, press the “S/div” knob to save the picture. Next Page Page 1/2 Press this option button to enter next...
- Page 101 Picture 2-79 To print screen picture, follow these steps: 1. Connect the oscilloscope to a PictBridge compatible printer. 1) Insert one end of a USB cable into the USB Device port on the oscilloscope. 2) Insert the other end of the cable into the PictBridge port on a PictBridge compatible printer.
-
Page 102: Self Calibration
Note: 1. Before connecting the oscilloscope to the printer, you must be sure that “Back USB” option having been settled to “Printer”. 2. You can use the oscilloscope while the printer is using. 3. If printing fails, check wthether the USB cable is connected to the PictBridge port on the printer or not. -
Page 103: Self Test
2.13.5 Self Test Press “UTILITY”→ “Do Self Test” Table2-55 Option Introduction Screen Test Run Screen Test Program. Keyboard Test Run Keyboard Test Program. LED Test Run LED Test Program. Operation Steps: 1. Screen Test: Select “Screen Test” to enter the screen test interface. The clew words “Press ‘SINGLE’... - Page 104 (single LCD) repose. ● The tested button or knobs corresponding area would display green (Color LCD) or white (single LCD). ● At the bottom of the screen display “Press‘ RUN/STOP’ Key Three Times to exit” information prompt to show that press “RUN/STOP” three times for quiting the test .
-
Page 105: Update Firmware
Picture 2-83 2.13.6 Update Firmware The software of the oscilloscope can be updated directly via USB Flash drive, this process needs about two minutes. Follow next steps: 1. Insert USB Flash Drive with firmware procedure to USB Host interface on the front panel of the oscilloscope. - Page 106 Source Select signal input channel CH1、CH2 CH3、CH4 Operate Press to run the Pass/Fail test. Press to stop the Pass/Fail test. Msg Display On Turn on times information display of the waveform pass/fail. Turn off times information display of the waveform pass/fail. Next Page Page 1/2 Press this button to enter second page of...
- Page 107 Picture 2-85 Table 2-58 Mask Setting function menu 1: Option Setting Instruction X Mask Turn the “Universal” knob to set the range of horizontal clearance waveform. <0.04div-4.00div> xdiv Y Mask Turn the “Universal” knob to set the range of vertical clearance waveform.
- Page 108 Table 2-59 Mask Setting function menu 2: Option Setting Instruction Save Store created mask setting. Load Recall stored mask setting. Return Return to the main menu of mask setting. Last Page Page 2/2 Return to the first page of the “Mask Setting menu”.
-
Page 109: Waveform Record
11) Press the “Create Mask” button to create mask and you also can enter the next page of “Mask menu” to recall the stored mask. 12) Enter the second page of “Pass/Fail function menu”, press the “Output” option button to set the output option. 13) Enter the first page of “Pass/Fail function menu”, press the “Operate”... - Page 110 Picture 2-89 To record waveforms, follow these steps: 1. Press the UTILITY button to enter “Utility menu”. 2. Press the “Next Page” option button to enter the third page of “Utility menu”. 3. Press the “Record” button to enter “Waveform Record Menu”. 4.
- Page 111 Picture 2-90 Table 2-62 Waveform play back function menu 2: Option Setting Instruction Start Frame Set start frame. Curr_Frame Select current frame to be played. End Frame Set End frame. Return Press to return the waveform recorder main menu. Next Page Page 2/2 Return to the first page of Play Back function menu.
-
Page 112: Recorder
6. Select the “Start Frame” option, turn the “Universal” knob to adjust the start frame of play back waveform. 7. Select the “End Frame” option, turn the “Universal” knob to adjust the end frame of play back waveform. 8. Press the “Next Page 2/2” option button to return the first page of “Play Back menu”. - Page 113 Previous Recall the waveform again Next Fast forward play the recalled waveform again Return Quit the recalling interface Table2-67 Recorder’s setting menu Option Setting Description Viewer Full Screen Waveform of Full screen recording and channel recalling Waveform of recording on split screen and channel recalling,CH1 is Split displayed in...
- Page 114 Picture 2-93 Recorder Operation step: 1. Press the UTILITY button to enter “Utility menu”. 2. Press the “Next Page” option button to enter the four page of “Utility menu. 3. Press the “Recorder” button to enter the Recorder manual. 4. Press the “Option” button to select the parameter which you want by yourself 5.
-
Page 115: Online Help Function
2.14 Online Help Function The oscilloscope has an online help function that supplies multi-language help information, and you can recall them to help you operate the oscilloscope when you need. Press the “HELP” button to enter the help status, then press every button to recall the corresponding help information. -
Page 116: Chapter3 Application Examples
Chapter3 Application Examples This section presents a series of application examples. These simple examples highlight the features of the oscilloscope and give you ideas for using it to solve your own test problems. Taking simple measurements ◆ Taking cursor measurements ◆... -
Page 117: Taking Simple Measurements
3.1Taking Simple Measurements Observe a unknown signal in a circuit, display the signal quickly and measure the frequency and peak-to-peak amplitude. 1. Using Auto set To quickly display a signal, follow these steps: 1. Press the CH1 button, set the Probe option attenuation to 10X and set the switch to 10X on the probe. - Page 118 Measure signal peak -to-peak amplitude ⑵ ● Press the “MEASURE” button to display “auto measure menu”. ● Press the top second option button. ● Press the “Voltage” option button to enter the “Voltage measure menu”. ● Press the “Source” option button to select input signal channel. ●...
-
Page 119: Taking Cursor Measurements
3.2 Taking Cursor Measurements You can use the cursors to take time and voltage measurements of a waveform. quickly 3.2.1 Measuring Ring Frequency To measure the ring frequency at the rising edge of a signal, follow these steps: 1). Press the “CURSORS” button to see the “Cursor Menu”. 2). -
Page 120: Measuring Ring Amplitude
3.2.2 Measuring Ring Amplitude To measure the amplitude, follow these steps: 1). Press the “CURSORS” button to see the Cursor Menu. 2). Press the “Mode” button to select “Manual”. 3). Press the “Type” option button and select “Voltage”. 4). Press the “Source” option button and select “CH1”. 5). -
Page 121: Catch The Single Signal
3.3 Catch the single signal To capture a single event, you need to gather some pre-test knowledge of the signal in order to correctly set up the trigger level and slope .if you are not sure the instance of the signal, you can observe it through auto or normal trigger mode to ensure the trigger level and slope. -
Page 122: Analyze The Signal Detail
3.4 Analyze the signal detail You have a noisy signal displayed on the oscilloscope and you need to know more about it. You suspect that the signal contains much more detail than you can now see in the display. 3.4.1 Looking at a Noisy Signal The signal appears noisy and you suspect that noise is causing problems in your circuit. -
Page 123: Triggering On A Video Signal
3.5 Triggering on a Video Signal Observe the video circuit in a piece of medical equipment and Use the video trigger to obtain a stable display. 3.5.1Triggering on Video Field To trigger on the video fields, follow these steps: 1). Press the “TRIGGER MENU” button to see “trigger menu” 2).Press the top option button and select “Video”. -
Page 124: Application Of X-Y Function
3.6. Application of X-Y function Viewing Impedance Changes in a Network Connect the oscilloscope to monitor the input and output of the circuit To view the input and output of the circuit in an XY display, follow these steps: 1)Press the “CH 1” MENU button and set the Probe option attenuation to 10X. 2) Press the “CH 2”... - Page 125 The signal must be medical horizontal Picture 3-3 Sin θ=A/B or C/D where θ=phase shift (in degrees )between the two signals From the formula above ,you could get: θ=±arcsine (A/B) or ±arcsine (C/D) If the main axis of the ellipse is at quadrant , θ...
-
Page 126: Analyzing A Differential Communication Signal
3.7 Analyzing a Differential Communication Signal You are having intermittent problems with a serial data communication link, and you suspect poor signal quality. Set up the oscilloscope to show you a snapshot of the serial data stream so you can verify the signal levels and transition times. Because this is a differential signal, you use the math function of the oscilloscope to view a better representation of the waveform. -
Page 127: Chapter 4 Prompting Messages And Troubleshooting
Chapter 4 prompting messages and troubleshooting 4.1 Prompting messages: ■ Trig level at limit! : Mention you that the trigger Level is at a limit when you turn the Trig level knob. ■ Horizon position at limit! : Mention you that the horizontal position is at a limit when you turn the horizon position knob. - Page 128 USB Flash Drive to the USB Host port. ■ USB Flash Drive Pull Out! : This information will appear when you pull out the USB Flash Drive. ■ Store Data Success! : Save setup data, waveform data or picture data to the internal of the oscilloscope or USB flash successful.
-
Page 129: Troubleshooting
4.2 Troubleshooting 1. After the oscilloscope is powered on,the screen remains dark ,please do as following steps: Check the power cable’s connection. ⑴ ⑵ Ensure the power switch is turned on. After the inspections above ,restart the oscilloscope. ⑶ If the oscilloscope is still not used after the checking, please connect with ⑷... - Page 130 Check the trigger mode on the trigger interface whether or not in the “normal” or “single”, and check the trigger level is whether or not over the wave range. If yes, please put the trigger level to the middle position or set the trigger mode to the “Auto”...
-
Page 131: Chapter 5 Service And Support
Chapter 5 Service and Support 5.1 Maintain summary MY Company warrants that the products that it manufactures and sells will be free from defects in materials and workmanship for a period of three (3) years from the date of shipment from an authorized MY company’s distributor. If a product or CRT proves defective within the respective period, MY company will provide repair or replacement as described in the complete warranty statement. -
Page 132: Appendix A: Specifications
Appendix A: Specifications All specification applies to 10X probe and All the Digital Storage Oscilloscopes. To verify that the oscilloscope meets specifications, the oscilloscope must first meet the following conditions: ● The oscilloscope must have been operating continuously for thirty minutes within the specified operating temperature. - Page 133 206mV-10V: ±40V Vertical Resolution 8 bit Channels Analog 25MHz ,40MHz,60 MHz,100 MHz,150 MHz, 200 MHz,300 Bandwidth Single-shot 25MHz ,40MHz,60 MHz,100 MHz,150 MHz, 200 MHz,300 Bandwidth Lower frequency limit (AC -3dB) ≤10Hz(at input BNC) DC Gain Accuracy ≤±3.0%: 5mv/div to 10V/div in Fixed Gain Ranges ≤±4.0%:typical for 2mv/div and Variable Gain Ranges DC Measurement Accuracy: ±[3%X(|reading|+|offset|)+1% of |offset| +0.2div+2mv]...
- Page 134 Measure System Auto Measure Vpp, Vmax, Vmin, Vamp, Vtop, Vbase, Vavg, Mean,Crms, (32 Types) Vrms, ROVShoot, FOVShoot, RPREShoot, FPREShoot, Rise time, Fall time, Freq, Period,+ Wid,-Wid, +Dut, -Dut, BWid, Phase, FRR, FRF, FFR, FFF, LRR, LRF, LFR, LFF Cursor Measure Manual mode, Track mode and Auto mode Trigger System Trigger Types...
- Page 135 X-Y Mode X-pole Input / Y-Pole Input Channel 1 (CH1) / Channel 2 (CH2) or Channel 1 (CH3) / Channel 2 (CH4) Phase Error ±3 degrees Sample Frequency XY mode has a breakthrough that trad oscilloscopes restrict sampling rate at 1MSa/s and 4Kpts memory depth Series supports 5KSa/s~200MSa/;...
- Page 136 Generic Specification Display System Display Mode Color TFT 5.7in(145mm)diagonal Liquid Crystal Display Color TFT 7in(178mm)diagonal Liquid Crystal Display Resolution 320 horizontal by 234 vertical pixels 480 horizontal by 234 vertical pixels Display Color 64K color Display Contrast 150:1 (Typical state) Backlight Intensity 300nit...
-
Page 137: Appendix B: Default Setup
Appendix B: Default setup Menu or system Default setup Options,knobs buttons Coupling CH1、CH2 CH3、CH4 BW limit Volts/div Coarse Probe Invert Filter Volts/div 1.00V MATH Operation CH1+CH2 CH1 invert CH2 invert CH3 invert CH4 invert FFT operation: Source Window Hanning FFT Zoom Scale dBVrms Display... - Page 138 Format Menu Display infinite Type Setups SAVE/RECALL Save To Device Setup No.1 REFA/REFB/REFC/ REFD REFA Source REFA REFB REFC REFD Sound UTILITY Counter Back USB Computer Pass/Fail Record RS-232 Baud 9600 TRIGGER (edge) Type edge Source Slope Rising Mode Auto Coupling LEVEL 0.00V...
-
Page 139: Appendix C: Daily Maintain And Cleaning
Appendix C: Daily Maintain and Cleaning Daily Maintain DO not store or leave the instrument in where the LCD display will be exposed to direct sunlight for long periods of time. CAUTION: To avoid damage to the instrument or probes, do not expose them to sprays, liquids, or solvents Cleaning If this instrument requires cleaning, disconnect it from all power sources and... -
Page 140: Index
Index - Width Probe component + Width Probe Safety Accessories Real Time Sampling Acquiring Signals system Aliasing Rise Application of X-Y function RUN/STOP 13, 59 AUTO Sampling auto setup SAVE/RECALL Average SAVE/RECALL WAVEFORM 83, 87 Base time Scale Measurement Coarse Screen Connector Self Test...
Need help?
Do you have a question about the SDS1022DL and is the answer not in the manual?
Questions and answers