Table of Contents
Advertisement
Quick Links
Advertisement
Table of Contents

Related Manuals for EXFO OSA20


Summary of Contents for EXFO OSA20
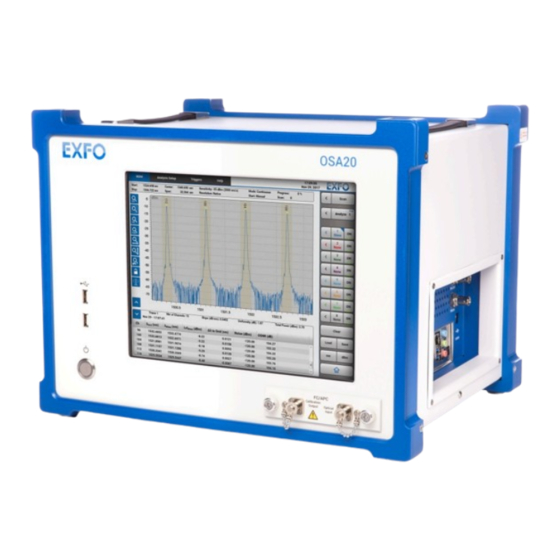
- Page 1 User Guide OSA20 Optical Spectrum Analyzer Optical Spectrum Analyzer www.EXFO.com...
-
Page 2: Copyright
Information provided by EXFO is believed to be accurate and reliable. However, no responsibility is assumed by EXFO for its use nor for any infringements of patents or other rights of third parties that may result from its use. No license is granted by implication or otherwise under any patent rights of EXFO. -
Page 3: Table Of Contents
Connecting a Light Source to the OSA20 ......................23 Connecting a Mouse and Keyboard to the OSA20 .....................24 Sharing the OSA20 Display with an External Screen ..................25 Turning on the OSA20 and Accessing the Home Window .................26 Turning off the OSA20 ............................27 Updating the OSA20 System Version .........................28 Updating the Operating System Version (Security Updates) ................30... - Page 4 Saving Analysis Settings and Results ........................127 Loading Measurement and Analysis Settings ....................129 Handling Files Saved ............................130 Deleting all User Data from the OSA20 Internal Drive ..................130 Restoring Factory Settings ..........................131 9 Using the OSA20 in Remote Control ................133 Preparing the OSA20 for Remote Control ......................133 Entering/Exiting the Remote Mode ........................136...
- Page 5 Contents 12 Warranty ..........................153 General Information ............................153 Gray Market and Gray Market Products ......................153 Liability ................................154 Exclusions ................................154 Certification ..............................154 Service and Repairs ............................155 EXFO Service Centers Worldwide ........................156 OSA20...
-
Page 6: Regulatory Information
USA Electromagnetic Interference Regulatory Statement Electronic test and measurement equipment is exempt from FCC part 15, subpart B compliance in the United States of America. However, EXFO Inc. makes reasonable efforts to ensure compliance to the applicable standards. The limits set by these standards are designed to provide reasonable protection against harmful interference when the equipment is operated in a commercial environment. - Page 7 Your product is compliant with industrial electromagnetic environments. European Declaration of Conformity The full text of the EU declaration of conformity is available at the following Internet address: www.exfo.com/en/resources/legal-documentation. OSA20...
-
Page 9: Introducing The Osa20
Introducing the OSA20 The OSA20 is a diffraction-grating based optical spectrum analyzer, using a touch sensitive display with multi-touch gesture control. It provides an extensive suite of built-in analysis functions enabling input signal measurement and analysis for many common applications. - Page 10 Except ±0.35 dB in -55 dBm and Burst sensitivities, except for water absorption lines, over 18–28°C all sensitivity settings. Sweep cycle /100 nm at -60 dBm sensitivity at center wavelength of 1475 nm. The validity of specifications depends on operating conditions (see Recalibrating the OSA20 on page 142).
- Page 11 Introducing the OSA20 Technical Specifications Interfaces and Electrical Optical interfaces Optical input SMF-28 type fiber User calibration output Built-in ELED (safety class 1) + Acetylene cell (user calibration by patch cord) Connector (input and FC/APC or FC/PC or SC/APC or SC/PC...
-
Page 12: Product Overview
Connector’s plate Optical connectors On/Off button label identifies the On/Off button that enables you to turn on or off the OSA20 (see Turning on the OSA20 and Accessing the Home Window on page 26). Multi-touch Screen The multi-touch screen enables you to perform all possible operations on the OSA20. - Page 13 USB 2.0 type-A ports located on the front panel. They enable you to connect USB devices such as: Keyboard and mouse if needed (see Connecting a Mouse and Keyboard to the OSA20 on page 24) USB key or hard disk to export your measurement results ...
- Page 14 Introducing the OSA20 Product Overview Left-side Panel: Cooling Fan The cooling fan, located on the left-side panel of the OSA20, extracts warm air from inside. A cover grid protects it. Cooling Fan Right-side Panel: Connectors The right-side panel of the OSA20 contains: A complete set of communication ports and interfaces for remote control and export of ...
- Page 15 HDMI port For more details on how to configure the external screen settings, see Sharing the OSA20 Display with an External Screen on page 25. Trigger Ports The trigger ports enable you to synchronize scans with a signal (see Interfaces and Electrical on page 3 for more details on signal levels).
- Page 16 You can configure this port manually or automatically through a remote DHCP server. For more information, Using the OSA20 in Remote Control on page 133. MPORTANT The Ethernet ports can only be used for remote control of the OSA20. Any other use is not possible. Audio and Serial Ports Unused ports.
- Page 17 It is plugged to the 48 V DC connector, identified by the label. AUTION To ensure the smooth functioning of the OSA20, you must only use the power adapter provided by EXFO. The 48 V DC connector is SELV classified and must only be connected to interfaces of the same type.
- Page 18 The fuse type is described in Technical Specifications on page 1. Windows license label: The OSA20 embeds Windows 10. Warranty seal: Warranty void The OSA20 cover must not be open, otherwise the if seal broken. warranty is not valid anymore. OSA20...
-
Page 19: Conventions
Introducing the OSA20 Conventions Conventions Before using the product described in this guide, you should understand the following conventions: ARNING Indicates a potentially hazardous situation which, if not avoided, could result in death or serious injury. Do not proceed unless you understand and meet the required conditions. -
Page 21: Safety Information
If the equipment is used in a manner not specified by the manufacturer, the protection provided by the equipment may be impaired. ARNING Use only accessories designed for your unit and approved by EXFO. For a complete list of accessories available for your unit, refer to its technical specifications or contact EXFO. -
Page 22: Other Safety Symbols On Your Unit
Direct current Alternating current The unit is equipped with an earth (ground) terminal. The unit is equipped with a protective conductor terminal. The unit is equipped with a frame or chassis terminal. On (Power) Off (Power) On/off (Power) Fuse OSA20... -
Page 23: Laser Safety Information
CLASS 1 CLASS 1 LASER PRODUCT LED PRODUCT APPAREIL A LASER APPAREIL A DEL DE CLASSE 1 DE CLASSE 1 Complies with standards 21 CFR 1040.10, except for deviations pursuant to Laser Notice No. 50, dated June 24, 2007. OSA20... -
Page 24: Electrical Safety Information
disconnected from its electrical supply. ARNING Use only the listed and certified AC/DC power adapter provided by EXFO with your unit. It provides reinforced insulation between primary and secondary, and is suitably rated for the country where the unit is sold. - Page 25 ; 50/60 Hz; 1.5 A (Output power: 48 V ; 3.13 A) Scan stops if temperature > 35°C AUTION The use of voltages higher than those indicated on the label affixed to your unit may damage the unit. OSA20...
-
Page 27: Getting Started With Your Osa20
The procedure to install the OSA20 into a 19-inch rack is available in the manual delivered with the rack mount kit. The OSA20 is designed for indoor use only, and is not dedicated to wet locations. It must be operated under proper environment conditions, as explained in the following procedure. - Page 28 8b. Slightly splay the lateral edges of the protective cover to unfasten the two side tabs from the back of the front frame. 8c. Gently pull horizontally the protective cover out of the front panel. 9. To tilt the OSA20 upward, deploy the two retractable legs located below it. OSA20...
-
Page 29: Connecting The Osa20 To A Power Source
Connecting the OSA20 to the Wall Socket Using the Power Adapter The OSA20 has a chassis connected to ground via the power supply cord. A protective ground connection by way of the grounding conductor in the power cord is essential for safe operation. - Page 30 Connecting the OSA20 to a Power Source Connecting the OSA20 to a 48 V DC Power Source You can directly connect the OSA20 to a 48 V DC power source by following the instructions given in this section. The following figure describes the 48 V connector located on the rear panel:...
-
Page 31: Connecting A Light Source To The Osa20
MPORTANT Keep protective caps on optical connectors when not in use. 2. Connect the light source to the optical input of the OSA20 with the appropriate jumper corresponding to the connector type mounted on your product, as indicated on the connector’s plate (see Front Panel on page 4). -
Page 32: Connecting A Mouse And Keyboard To The Osa20
Connecting a Mouse and Keyboard to the OSA20 To operate the OSA20, you can connect a USB mouse and keyboard to the USB-A 2.0 and USB-A 3.0 ports located on the front and right-side panels of the OSA20 (see Product Overview on page 4). -
Page 33: Sharing The Osa20 Display With An External Screen
You can connect an external screen to the OSA20 to share the display and control (you do not need to restart the OSA20). Make sure the screen you want to connect to the OSA20 can connect to a VGA, DVI or HDMI port, and make sure you have the appropriate connection cable to connect your external screen. -
Page 34: Turning On The Osa20 And Accessing The Home Window
After a few seconds, the button lights up. The startup procedure takes approximately 1 minute and 30 seconds. Once started, the OSA20 home window appears. If the OSA20 is turned on and you have selected an analysis mode or a configuration window: Touch the button. -
Page 35: Turning Off The Osa20
Turning off the OSA20 The following procedure explains how to correctly turn the OSA20 off. AUTION Never turn the OSA20 off by directly setting the power switch to O. To turn the OSA20 off: 1. Do one of the following:... -
Page 36: Updating The Osa20 System Version
Package versions 1.x are only compatible with OSA20s embedding Windows 7. OSA20 with serial number starting with EO can be upgraded to Windows 10. If you want to migrate your OSA20 to Windows 10, please contact EXFO (see Contacting the Technical Support Group on page 150). - Page 37 Getting Started with Your OSA20 Updating the OSA20 System Version The OSA20 automatically detects the .pkg file on the USB device and starts the update wizard. AUTION To avoid serious system problems: Do not turn the OSA20 off during the update.
-
Page 38: Updating The Operating System Version (Security Updates)
Updating the operating system may take a significant amount of time. To update the operating system version: 1. Make sure that your OSA20 is connected to the Internet with an Ethernet cable, on Ethernet port #2 (see Right-side Panel: Connectors on page 6). -
Page 39: Setting Up Your Osa20
1. In the OSA20 home window, touch the Settings button. The Backlight cursor enables you to define the screen brightness. 2. Slide the Backlight cursor to increase or decrease the brightness of the OSA20 screen. 3. Touch the button to go back to the OSA20 home window. - Page 40 1. In the OSA20 home window, touch the Settings button. The Date & Time area enables you to set the date and time of the OSA20. 2. Touch the Date and Time (hours and minutes) fields to enter date and time.
-
Page 41: Accessing An Analysis Mode
Accessing an Analysis Mode Accessing an Analysis Mode The OSA20 provides eight analysis modes. Each mode has its own available traces and analysis tools, which are adapted to the tested application. The available analysis tools by analysis mode are detailed in Analyzing Traces on page 61. - Page 42 Period: 0.2 … 100 ms To access an analysis mode: 1. If you are using the OSA20 for the first time, calibrate it as explained in Performing a User Calibration on page 140 before accessing an analysis mode. 2. In the OSA20 home window, touch the right or left blue arrows to navigate to the wanted analysis mode.
- Page 43 Optical Spectrum Acquisition on page 46 (trigger IN) and Generating Output Trigger Signals on page 47 (trigger OUT). Help tab This tab displays the OSA20 User Guide. Using the Help tab during a scan may slow it down. OSA20...
-
Page 45: Performing Measurement Scans
The spectrum acquisition is performed on all available traces, according to the type of trace set. MPORTANT If you are using the OSA20 for the first time, you must calibrate it before performing scan measurements, as explained in Performing a User Calibration on page 140. - Page 46 Setting Description Resolution Native (default value) The spectral resolution is automatically set to the OSA20’s monochromator factory-calibrated optical resolution bandwidth (see Technical Specifications on page 1). Calculated The spectral resolution is set to the value you specify in the value field.
- Page 47 The scan speed depends on the T value (the typical speed corresponding sensitivity is -75 dBm to High): at low T value, the scan speed is faster and it decreases as the value increases. 5. Touch the button or anywhere on the screen outside the menu to exit. OSA20...
- Page 48 The OSA20 performs a single scan of the optical spectrum (according to the defined trace types) and then stops. If a trace is set to Roll Average: n, the OSA20 performs n scans to be able to calculate the average value and then stops.
- Page 49 I: period of time between the beginning of two successive scans. If the interval set is greater than the scan time, the OSA20 waits before the next scan. If the period of time is lower than the scan time, the OSA20 immediately performs the next scan.
- Page 50 You can apply a compensation value to the detected power upon acquisition, from -2.00 dB to 2.00 dB. To apply a power offset: 1. In the OSA20 home window, touch the Settings button. The Offset area enables you to apply a power offset on the detected power upon acquisition.
-
Page 51: Zeroing The Dark Current
The zeroing function uses a shutter to perform a dark current measurement on the detection system. It usually takes 2 to 5 seconds. The OSA20 can automatically perform zeroing while scanning, or you can perform it manually as explained in the following sections: Automatically Zeroing the Dark Current on page 43 ... - Page 52 Scan button. 2. In the Scan menu, touch the Zero button. The dark current is measured and the corresponding offset is applied to the OSA20 detection system. If the Auto Zero check-box in the Settings window is cleared (see Automatically Zeroing the Dark Current on page 43), a notification appears below the button.
-
Page 53: Manually Starting/Stopping The Optical Spectrum Acquisition
The button label switches to Abort until the acquisition stops (at the end of the current scan). If you touch the Abort button while the acquisition is stopping, the acquisition does not finish the spectrum scan and stops as quickly as possible. OSA20... -
Page 54: Triggering The Optical Spectrum Acquisition
5. Select the wanted scanning parameters (see Defining the Scan Parameters on page 37), and set the Start parameter to Triggered. The OSA20 will scan the optical spectrum according to the parameters set in the scan menu and in the Triggers tab. -
Page 55: Generating Output Trigger Signals
Generating Output Trigger Signals The TRIG OUT BNC connector (see Right-side Panel: Connectors on page 6) allows you to output trigger signals when the OSA20 performs a scan, as explained in the following procedure. To generate an output trigger signal: 1. -
Page 57: Configuring And Displaying Scan Traces
For more detail on mask setup, see Setting Up Mask Test Analysis on page 125. Each trace is represented by a different color. Trace configuration button Trace information Trace display Trace activation button button Trace handling buttons Trace types OSA20... - Page 58 - (LIN): Subtraction of two traces in mW, leading to a result in dBm/mW. - (LOG): Subtraction of two traces expressed in dBm, leading to a result in dB/ratio. None Clears the trace content and deactivates the trace. OSA20...
- Page 59 A flag appears on the corner of the trace button. Deleting Traces You can delete all trace content and analysis results, except for Store type traces. To delete trace data from the graph and all analysis results: In the Analysis mode window, touch the button. OSA20...
- Page 60 Paste button. The trace type is automatically set to Store. Saving/Loading Traces Traces can be saved in .csv, .xcsv (decimated data) or .tra (OSA20 specific format) formats on the following media: The internal OSA20 drive (D:\ ( USER )).
- Page 61 For example, if the resolution is set to 100 pm, the sampling resolution will be 1 point every 10 pm. MPORTANT If you load this type of trace file on the OSA20, missing points are generated on the graph by interpolation. 7. Touch the Save button.
- Page 62 4. Touch the wanted drive and folder and select the trace file you want to load. 5. Touch Open. The trace is loaded in place of the selected trace and appears on the graph display. The trace type is automatically set to Store. OSA20...
-
Page 63: Handling Traces Files
Handling Traces Files Handling Traces Files You can access the OSA20 internal drive or an external hard drive connected to the OSA20 to handle the saved trace files. You can move trace files from one location to another, for example to copy a trace file saved on the internal drive to an external USB device. You can also delete files you have previously saved on the internal drive. -
Page 64: Adjusting The Graph Display
(from left to right). If you draw a rectangle from right to left, it cancels the last rectangle selection you have made. Draw a rectangle OSA20... - Page 65 Fits the wavelength range to the total range covered by all displayed traces. Fits the power range to the to the total range covered by all displayed traces. Undoes the last zoom action. Disables/Enables all multi-touch screen gestures on the graph. OSA20...
- Page 66 On the graph, touch the letter corresponding to the marker you want to move and slide it to the wanted position. To make it easier to move markers without moving the graph, you can lock the graph by clicking the button. OSA20...
- Page 67 Opens a numeric keypad allowing you to type the exact marker position value (wavelength value or power value). Automatically places the selected marker to the center of the graph. 4. To hide markers, touch the button. The marker positions are kept in memory. OSA20...
-
Page 69: Analyzing Traces
Mean wavelength/ Wavelength/Frequency Frequency Analysis on page 84 Analyzing Peak Peak wavelength/ Wavelength/Frequency frequency Results on page 85 Central Analyzing Central wavelength and Wavelength and Sigma Sigma value Value Results on page 86 Analyzing FWHM FWHM Results on page 87 OSA20... - Page 70 Noise Figure Analysis on page 109 Setting Up Pass Band Pass Band Test Test Analysis on page 113 Setting Up Stop Band Stop Band Test Test Analysis on page 119 Setting Up Mask Test Mask Test Analysis on page 125 OSA20...
- Page 71 (this avoids the detection of unwanted peaks in the noisy regions of the spectrum). To ensure good detection of peaks and troughs, it is recommended to use a value close to sensitivity (e.g. -70 dBm if sensitivity is set to -70 dBm). OSA20...
- Page 72 OSA, BBS, MML, SML and PCT analysis modes OFA analysis mode, if the Experimental Setup parameter of the Gain & NF tool is set to Single Source (see Defining Gain & NF Analysis Parameters on page 109). OSA20...
- Page 73 This type of display is used in the following analysis modes: WDM and RLT analysis modes. OFA analysis mode, if the Experimental Setup parameter of the Gain & NF tool is set to Multichannel (see Defining Gain & NF Analysis Parameters on page 109). OSA20...
-
Page 74: Setting Up Peaks And Troughs Search
3. To make graphical display items of the analysis visible on the graph, select the Display on Graph check box and select the wanted display (see the following Display on Graph description, p. 68). OSA20... - Page 75 (see the following figure, in which Noise Level @1575nm is represented by Calculation Threshold). This noise threshold is then added to the PT threshold for the peak and trough search. : the algorithm does not filter the local noise. OSA20...
- Page 76 In the WDM, RLT, PCT and OFA analysis modes: result values are displayed for each detected peak, in accordance with the value set for the Mode Threshold parameter. In all other analysis modes, no result is displayed on graph. OSA20...
-
Page 77: Selecting The Component Under Test (Pct Mode)
Setting Up Pass Band Test Analysis on page 113 Stop Band Test Setting Up Stop Band Test Analysis on page 119 Loss Measurement Setting Up Loss Measurement Analysis on page 107 Mask Test Setting Up Mask Test Analysis on page 125 OSA20... -
Page 78: Setting Up Channel Detection
The grid channel array is first calculated based on the Start Wavelength, the Stop Wavelength and the Grid Spacing. The reference frequency can be set to any frequency with the Reference Frequency parameter (see below, p. 71). All other channels are then calculated from that reference channel labeled "Channel 0". OSA20... - Page 79 Default value: 193.1 THz (ITU standard) Start Wavelength/Frequency Center wavelength or frequency value (depending on the selected measurement unit, see Setting Spectral and Power Units on page 31) of the first channel on the grid. Default value: 1520 nm / 197.232 THz OSA20...
- Page 80 Power P = P – Bandwidth peak Threshold. For correct identification of channels, it is recommended that this threshold be less than PT Threshold (see p. 67). λ λ Central wavelength/frequency = ( Default value: 3 dB OSA20...
- Page 81 First Channel (WDM, RLT and OFA analysis modes only) Wavelength of the first channel of the CWDM grid: 1270 nm: the first CWDM channel is centered on 1270 nm. 1271 nm (default): the first CWDM channel is centered on 1271 nm. OSA20...
- Page 82 Wavelength/Frequency of channel of the grid starting from the Start Wavelength/Frequency value and stopping at Stop Wavelength/Frequency value. λ ν Measured channel peak wavelength/frequency and its associated Meas Meas power. WDM and RLT modes only. Meas Measured channel peak power. OSA20...
- Page 83 Spacing in wavelength/frequency of the channel N compared to its neighboring channel (N-1). Δλ WDM and RLT modes only. Only if the Spacing display mode is selected. Power difference of the channel N compared to its neighboring channel (N-1). OSA20...
-
Page 84: Setting Up Spectral Width Analysis
The Threshold algorithm detects the wavelengths at which the power falls below [Peak Power]-[Width Threshold]. To account for the multimodal nature of some sources, several options are available for this algorithm (see Fitting Options below), illustrated in the following figure. OSA20... - Page 85 The RMS and RMS Peak algorithms calculate the root mean square value σ of the power data above a given Width Threshold, taking the full power data (RMS) or simply the Power at Peak (RMS Peak) for the calculation. OSA20...
- Page 86 Factor to scale the measured width. Default value: 1 Width Threshold λ Threshold level used in the calculation of the width. It defines two wavelengths - and λ + with Power P = P – Width Threshold. peak OSA20...
- Page 87 Fit to Mode (only for Threshold algorithm, if Modal Analysis check-box is selected). : the calculation of width is fitted to the nearest detected peaks. (default): the calculation of width is fitted to the curve-threshold crossing. OSA20...
- Page 88 (OSA and MML modes only) Calculated mode spacing value. For RMS and RMS Peak algorithms, the spacing is calculated using the peaks above threshold. σ Only for RMS and RMS Peak algorithms. Standard deviation value of the measured peak. OSA20...
-
Page 89: Setting Up Xxdb Width Analysis
[Peak Power]-[Width Threshold]. Width Threshold Wavelength or Frequency σ The RMS algorithm calculates the root mean square value of the power data above a given Width Threshold, taking the full power data for the calculation. OSA20... - Page 90 + with Power P = P – Width Threshold. peak Default value: 20 dB Mode Threshold (only for Envelope, Gaussian Fit and Lorentzian Fit algorithms). Retains peaks with power P > P – Mode Threshold. peak Default value: 20 dB OSA20...
- Page 91 λ λ is displayed between Result Area Result Meaning Δλ Width at Width Threshold using the selected algorithm method. @xxdB/ Δν @xxdB For RMS and RMS Peak algorithms, the width is the standard deviation (ó). OSA20...
-
Page 92: Setting Up Mean Wavelength/Frequency Analysis
In the MML analysis mode, the RMS Peak algorithm is used for the calculation of the mean wavelength with the following default parameters (for more details, see RMS on page 81): Width Threshold: 20 dB Mode Threshold: 40 dB Multiplier: 1 Fit to Mode: No Modal analysis: Yes OSA20... - Page 93 λ λ is displayed on λ λ is displayed between Result Area Result Meaning λ ν Wavelength/frequency of the main mode. peak peak Level Power of the main mode. peak OSA20...
-
Page 94: Analyzing Central Wavelength And Sigma Value Results
The following graphical display items are displayed on graph: is displayed on the center wavelength. λ λ is displayed on λ λ is displayed between Result Area Result Meaning λ ν Central wavelength/frequency. center center σ Standard deviation of the measured peak. OSA20... -
Page 95: Analyzing Fwhm Results
MML Analysis Mode Algorithm: Gaussian Fit Width Threshold: 3 Mode Threshold: 20 Multiplier: 1 Fit to Mode: No Modal Analysis: Yes Result Description Result Meaning FWHM Full width at half maximum value. OSA20... -
Page 96: Analyzing Side Modes Spacing Results
Fit to Mode: No Result Description Analysis results are displayed below the graph (see Result Area Description on page 64). Result Meaning Side Modes Calculated spacing of the residual side mode detected (when possible) Spacing outside of the main peak feature. OSA20... -
Page 97: Setting Up Notch Width Analysis
Factor to scale the measured width. Default value: 1 Width Threshold λ Threshold level used in the calculation of the width. It defines two wavelengths - and λ + with Power P = P – Width Threshold. peak Default value: 3 dB OSA20... - Page 98 Bottom (default): the width is calculated from the trough. Top: the width is calculated from the two surrounding peaks on either side of the notch to be analyzed. Width Threshold Bottom Width Threshold Wavelength or Frequency OSA20...
- Page 99 Calculated central wavelength/frequency and its associated power. notch mean Level notch λ ν Notch Width 1/2/3 tool only. trough trough Calculated trough wavelength/frequency and its associated power. Level trough Δλ Δν Spectral notch width at Width Threshold using the selected algorithm notch notch method. OSA20...
-
Page 100: Setting Up Level Check Analysis
Wavelength/frequency of the point for which the power level is measured. Default values: Reference Point 1: 1520 nm or 197.232 THz Reference Point 2: 1550 nm or 193.414 THz Reference Point 3: 1570 nm or 190.950 THz OSA20... - Page 101 Difference in dB between the power level measured at Reference Lvl2-1 Point 2 and the power level measured at Reference Point 1. Δ Difference in dB between the power level measured at Reference Lvl3-1 Point 3 and the power level measured at Reference Point 1. OSA20...
-
Page 102: Setting Up Smsr Analysis
LR (default): displays the side modes to the left and the right of the main peak. Next: displays only the largest side mode between the identified left and right side modes outside of the Mask exclusion area. OSA20... - Page 103 SMSR Only if Algorithm is set to Next. Difference between the power of the main mode and the power of the side mode. SideBand 1/SideBand 2 Results (only if Algorithm is set to LR) OSA20...
- Page 104 Difference between the wavelength/frequency of the side modes on the left/right of the main mode. Center Offset Only if Algorithm is set to LR. Difference between the wavelength/frequency of the main mode and the middle of the stop band. OSA20...
-
Page 105: Setting Up Osnr Analysis
corr In case of OSA20, a correction factor is added to account for the Gaussian shape of the filtering, instead of the rectangular shape obtained at larger bandwidth. The standard also indicates that the calculation of Ni, usually not measurable due to the presence of the signal peak, needs to be done based on interpolation (i.e. - Page 106 The power s(λ) is the signal power density, excluding the noise, expressed in mW/nm. The noise p(λ) is the noise power density expressed in mW/nm. In case of OSA20, the integration is replaced by a sum of all signal and noise data points, spaced by dλ = 2 pm. OSA20...
- Page 107 4. In OSA, SML and WDM modes, activate the analysis calculation for the next analysis run by selecting the Activate check box. In OFA mode, the tool is automatically activated. 5. To make graphical display items of the analysis visible on the graph, select the Display on Graph check box. OSA20...
- Page 108 Width of the noise area around the Noise Point Selection used for the calculation of the noise fit N Default value (OSA and SML analysis modes): 0.2 nm / 0.024 THz Default value (WDM and OFA analysis mode): 0.01 nm / 0.001 THz OSA20...
- Page 109 Power Integral Range (only if Noise Point Selection is set to Fixed, Nearest Peaks and Nearest Troughs, and if Power Integration check box is selected) The range of integration of the signal around the peak signal. Default value: 10 GHz OSA20...
- Page 110 OSNR/ Value of the OSNR as defined by the calculation given above in IEC standard 61280-2-9 on page 97 for OSA20. OSNR IN/OUT (OFA) WDM analysis mode only. Integrated power measurement within the Power Integral Range if the Power Integration check box is selected.
-
Page 111: Setting Up Ripple Analysis
In case of SLED, the ripple is caused by Fabry-Perot (FP) effect. To display the equivalent FP length estimated based on ripple frequency measurement, the refractive index of the material causing the ripple is required. Default value: 1.00027326 (air @1550 nm) OSA20... - Page 112 Spacing Mean spacing of measured ripple peaks above the detection threshold, after removal of the baseline. Equivalent FP Estimated Fabry-Perot length, based on ripple spacing and on the Length refractive index given as input. OSA20...
-
Page 113: Setting Up Optical Power Analysis
in the equation takes into account the Gaussian filtering response of the monochromator inside the OSA20. is the sum of all the values of power (Pi) of the trace, in mW (conversion if needed) divided by the corresponding resolution bandwidth (Ri). - Page 114 Total Power (xW) Power measured within the scan range in Watt, scaling automatically in pW, nW, uW, mW. If no power (or negative power) is detected, the result displays 0 mW. Average Only for traces in dB. Average gain/loss measured within the scan range in dB. Gain/Loss OSA20...
-
Page 115: Setting Up Loss Measurement Analysis
Analysis results are displayed below the graph (see Result Area Description on page 64). Result Description Result Meaning Average Loss Only for traces in dB. Measured fiber attenuation, in dB. Uniformity Only for traces in dB. Difference between minimum and maximum loss within the analysis range, in dB. OSA20... -
Page 116: Setting Up Peak Power Density Analysis
(see section Setting General Parameters, p. dBm/THz) 22). Power Density Power density measured in µW (or pW, nW, mW)/nm or µW (or pW, (µW/nm or nW, mW)/THz, depending on the selected measurement unit (see section Setting General Parameters, p. 22). µW/THz) OSA20... -
Page 117: Setting Up Gain And Noise Figure Analysis
IN. Default value: 0 dB Output Attenuation Power difference L between power at the amplifier output and power measured in trace OUT. Default value: 0 dB OSA20... - Page 118 If no filter is used, set this parameter to the width of the optical amplifier output used when Noise Figure Selection is set to Full. Set this parameter to 0 to achieve simplified IEC equation with shot noise. Default value: 0 GHz OSA20...
- Page 119 OSNR Optical signal to noise ratio of the output signal power to the ASE noise power (with the Reference Optical BW set in the OSNR tool output). Ratio of signal output power to measured output power. OSA20...
- Page 120 G Slope: slope of a linear fit to all tested channel’s gain. : average gain obtained from all tested channel’s gain. Total P : power of input signal measured within the scan range. Total P : power of output signal measured within the scan range. OSA20...
-
Page 121: Setting Up Pass Band Test Analysis
Center λ: center wavelength found in the Spectral Width 1 tool results (see Analyzing Spectral Width Results on page 80). Peak λ Center λ Wavelength or Frequency IN/OUT Band Method Method used in crosstalk calculation for the estimate of the spectral spacing between in and out bands: OSA20... - Page 122 Avg Loss OUT Avg Loss OUT OUT Ref OUT Ref Wavelength or Frequency % Bandwidth: sets the range to a fraction of the bandwidth measured from the Spectral Width 1 tool (see Analyzing Spectral Width Results on page 80). OSA20...
- Page 123 Fixed Range in nm/THz over which calculations are done. The range is centered on the reference points for in-band and out-band (set in CrossTalk Settings on page 113). A range of 0 takes a single point for the calculation. Default value: 0.1 nm OSA20...
- Page 124 Roll Off @ XdB Max Exclusion Thresh. Max Roll Off Wavelength or Frequency Out-Band: the transition band is defined as the part of the trace between Level@ Transition Reference + Min Exclusion Threshold and Level@ Transition Reference + Max Exclusion Threshold OSA20...
- Page 125 are display on the transition range. Result Area The RollOff measurement is performed on the OSA20 trace, which is a convolution of the filter under test and the OSA20 monochromator. In-Band Results Result...
- Page 126 Wavelength of maximum roll off in nm. Transition Wavelength region between Transition Reference -/+ Minimum Threshold and Reference point -/+ Maximum Threshold. Band a. This result is calculated between the two reference points set in CrossTalk Settings on page 113. OSA20...
-
Page 127: Setting Up Stop Band Test Analysis
Center λ: center wavelength found in the Notch Width 1 tool results (see Analyzing Notch Width Results on page 91). Center λ Trough λ Wavelength or Frequency IN/OUT Band Method Method used in isolation depth calculation for the estimate of the spectral spacing between in and out bands: OSA20... - Page 128 Spectral range used in the analysis of In-band and out-band average loss and ripple. Fixed Range: provides a fixed calculation span (see Calculation Span parameter). OUT Ref OUT Ref Avg Loss OUT Avg Loss OUT Avg Loss IN Ripple IN Slope Calculation Span Wavelength or Frequency OSA20...
- Page 129 Fixed Range in nm/THz over which calculations are done. The range is centered on the reference points for in-band and out-band (set in isolation depth settings). A range of 0 takes a single point for the calculation. Default value: 0.1 nm OSA20...
- Page 130 Roll Off @ XdB Exclusion Avg Loss IN Thresh. Wavelength or Frequency Out-Band: the transition band is defined as the part of the trace between Level@ Transition Reference + Min Exclusion Thresh. and Level@ Transition Reference + Max Exclusion Thresh. OSA20...
- Page 131 Average loss in dB measured across Averaging Range around the In-band reference point. Ripple Uniformity in dB as the min/max level difference measured within Averaging Range around the In-Band reference point. Linear fit slope calculated within Averaging Range around the Slope In-Band reference point. OSA20...
- Page 132 Notch Width 1 tool) from the Transition Reference point. RollOff Maximum roll off in dB/nm (or dB/THz), within the transition band. λ @RollOff Wavelength of maximum roll off in nm. Transition Wavelength region between Transition Reference -/+ Minimum Threshold and Reference point -/+ Maximum Threshold. Band OSA20...
-
Page 133: Setting Up Mask Test Analysis
You can acquire these traces using the OSA20 or prepare them in .csv files. MPORTANT The wavelength/frequency range of the mask traces must be higher than or equal to the wavelength/frequency range of the transfer function trace that is analyzed. - Page 134 Fail HI/LO: the transfer function runs over the high and low limits of the mask. No Masks: no mask is defined. Mask size error: the wavelength/frequency range of the mask traces is lower than the wavelength/f OSA20...
-
Page 135: Handling Files And User Data
Connecting/Disconnecting USB Storage Devices on page 127). To disconnect USB storage devices from the OSA20 If you connect one or more USB storage device(s) to the OSA20, an icon appears on the top right of the screen, next to the date and time. - Page 136 4. If you want to create a new folder: touch the button and type a name for the folder (using the on-screen keyboard or a normal keyboard if connected to the OSA20), and touch the Create button. 5. Select the type of file to save: Settings (*.<analysis mode>): saves all the measurement and analysis...
-
Page 137: Loading Measurement And Analysis Settings
Storage Devices on page 127. To load the default measurement settings 1. In the configuration area of the wanted analysis mode, touch the Load button. The Open window appears. 2. In the drop-down list, select Default Settings and touch the Open button. OSA20... -
Page 138: Handling Files Saved
Handling Files Saved Handling Files Saved You can access the OSA20 internal drive or an external hard drive connected to the OSA20 to handle the settings and screen shot files you have saved. You can move the files from one location to another, for example to copy a file saved on the internal drive to an external USB device. -
Page 139: Restoring Factory Settings
Restoring Factory Settings Restoring factory settings deletes all the user customized settings, parameters and traces displayed on screen in the entire OSA20 system and restores the original default settings. To restore factory settings: 1. In the OSA20 home window, touch the Settings button. -
Page 141: Using The Osa20 In Remote Control
Preparing the OSA20 for Remote Control Setting the GPIB Address If you want to remotely control the OSA20 through the IEEE 488 port, you can modify the GPIB address. The default GPIB address is 10. You can set it out between 1 and 30. - Page 142 :indicates that the port is not connected to any external device. 2. In the Ethernet area, in the TCP Socket Port field, specify specify the TCP destination port to be used by the socket to allow data transmission between the OSA20 and the external controller.
- Page 143 Installing the USB Driver on the Remote Computer To remotely control the OSA20 through the USB-B port, you must install the EXFO USB driver on the computer from which you want to control the OSA20. Make sure your computer runs one of the following operating systems: Windows 7, ...
-
Page 144: Entering/Exiting The Remote Mode
USB port. See OSA20 Programming Guide for details. To enter the remote mode: 1. Connect the external controller to the appropriate connector: For GPIB: the GPIB port located on the rear panel of the OSA20 (see Rear Panel on page 9). -
Page 145: Performing Basic Maintenance Operations
To clean the external cover of the OSA20: 1. Turn the OSA20 off (see Turning off the OSA20 on page 27) and unplug the power supply cable from the wall socket. 2. Slightly damp the cloth with an isopropyl alcohol liquid and gently swipe dirt and dust on the external cover of the OSA20, without applying excessive force onto it. - Page 146 Performing Basic Maintenance Operations Cleaning the OSA20 Cleaning the Fan Grids To ensure proper cooling of the OSA20 from the fan, the fan grid must not be dusty, you must clean it regularly. AUTION Do not use a vacuum cleaner to clean the fan as this may apply excessive force to it and cause damage to the fan.
-
Page 147: Cleaning Optical Connectors
To clean the optical connectors: 1. Turn the OSA20 off (see Turning off the OSA20 on page 27) and unplug the power supply cord from the wall socket. 2. On the front panel, make sure the protective caps of the connector’s plate are in place. -
Page 148: Performing A User Calibration
The user calibration application enables you to calibrate the OSA20 wavelength (not the power). It is available from the home window. To make sure the OSA20 meets the applicable specifications, you must perform a user calibration in the following cases: You are using the OSA20 for the first time. -
Page 149: Replacing The External Power Fuse
1. Make sure the room temperature is stabilized, and the OSA20 is at room temperature. 2. Make sure the OSA20 has been turned on at least for one hour. The user calibration process must only be performed after at least one hour warm-up. -
Page 150: Recalibrating The Osa20
Contact the EXFO customer support service (see Contacting the Technical Support Group on page 150) Carrying the OSA20 The two flexible handles located on the top side of the OSA20 allow you to carry it from one location to another, as explained in the following procedure. AUTION Never carry the OSA20 if it has been abruptly turned off (see section Forcing the OSA20 to Shutdown &... -
Page 151: 11 Troubleshooting
System Error Messages Error codes -1000 to -1002, -1004 to -1007, -1010 to -1013, -1015 Description System error. Possible Turn the OSA20 off, turn it on again and try to perform the action that Resolution caused the error. If the error appears again, turn the OSA20 off immediately (see ... - Page 152 150). Error codes -1008 and -1009 Description System error. Possible Turn the OSA20 off (see Turning off the OSA20 on page 27) and contact the EXFO customer support service (see Contacting the Technical Support Resolution Group on page 150).
- Page 153 Description The calibration shift is greater than 5 nm since last factory calibration, the system cannot calibrate the OSA20. Possible The optical source is not properly connected to the OSA20: Resolution Verify that the jumper is properly connected to the calibration output connector and to the optical input connector, as explained in Performing a User Calibration on page 140.
- Page 154 Error code -2004 Description The calibration procedure has exceeded the allowed period of time. Possible Turn the OSA20 off, turn it on again and try to perform the calibration Resolution procedure as explained in Performing a User Calibration on page 140.
-
Page 155: Forcing The Osa20 To Shutdown & Restart
Modify the analysis parameters. Forcing the OSA20 to Shutdown & Restart In case of system crash and frozen screen, you can abruptly turn the OSA20 off as explained in the following procedure. AUTION Do not stop the OSA20 with this procedure if you can turn it off normally as ... -
Page 156: Using Remote Assistance Tools
The result of the test is displayed on screen. Sending Debug Data to EXFO Support Service Saving debug data and sending it to the EXFO customer support service can be useful for remote assistance. To save and send debug data: 1. -
Page 157: Displaying The User Documentation
The user guide is also available in PDF format on the USB key delivered with the instrument and from the EXFO website: EXFO.com/en/resources/ To open the user documentation from the GUI: In the Analysis mode window, click the Help tab. -
Page 158: Contacting The Technical Support Group
Contacting the Technical Support Group Contacting the Technical Support Group To obtain after-sales service or technical support for this product, contact EXFO at one of the following numbers. The Technical Support Group is available to take your calls from Monday to Friday, 8:00 a.m. to 7:00 p.m. (Eastern Time in North America). - Page 159 Troubleshooting Transportation To package the OSA20 for shipment: If you need to return the OSA20 to EXFO for servicing or factory calibration, use the original packaging. AUTION Before packing the OSA20 in its original packaging: Unplug the cord from the 48 V DC connector and wrap the cord connector to ...
-
Page 161: 12 Warranty
General Information EXFO Inc. (EXFO) warrants this equipment against defects in material and workmanship for a period of 1 year from the date of original shipment. EXFO also warrants that this equipment will meet applicable specifications under normal use. During the warranty period, EXFO will, at its discretion, repair, replace, or issue credit for any defective product, as well as verify and adjust the product free of charge should the equipment need to be repaired or if the original calibration is erroneous. -
Page 162: Liability
Liability Liability EXFO shall not be liable for damages resulting from the use of the product, nor shall be responsible for any failure in the performance of other items to which the product is connected or the operation of any system of which the product may be a part. -
Page 163: Service And Repairs
5. Return the equipment, prepaid, to the address given to you by support personnel. Be sure to write the RMA number on the shipping slip. EXFO will refuse and return any package that does not bear an RMA number. -
Page 164: Exfo Service Centers Worldwide
Fax: +86 (755) 2955 3101 Xintian Avenue, support.asia@exfo.com Fuhai, Bao’An District, Shenzhen, China, 518103 To view EXFO's network of partner-operated Certified Service Centers nearest you, please consult EXFO's corporate website for the complete list of service partners: http://www.exfo.com/support/services/instrument-services/ exfo-service-centers. OSA20... - Page 165 CHINESE REGULATION ON RESTRICTION OF HAZARDOUS SUBSTANCES (RoHS) 中国关于危害物质限制的规定 NAMES AND CONTENTS OF THE TOXIC OR HAZARDOUS SUBSTANCES OR ELEMENTS CONTAINED IN THIS EXFO PRODUCT 包含在本 EXFO 产品中的有毒有害物质或元素的名称及含量 Part Name Lead Mercury Cadmium Hexavalent Polybrominated Polybrominated Chromium biphenyls diphenyl ethers 部件名称...
- Page 166 · info@exfo.com CORPORATE HEADQUARTERS 400 Godin Avenue Quebec (Quebec) G1M 2K2 CANADA Tel.: 1 418 683-0211 · Fax: 1 418 683-2170 TOLL-FREE (USA and Canada) 1 800 663-3936 © 2022 EXFO Inc. All rights reserved. ...
Need help?
Do you have a question about the OSA20 and is the answer not in the manual?
Questions and answers