Table of Contents
Advertisement
Advertisement
Chapters
Table of Contents

Related Manuals for EXFO OSA20


Summary of Contents for EXFO OSA20
- Page 1 OSA20 Optical Spectrum Analyzer User Guide www.EXFO.com OSA20_UG_1.10v1.1...
-
Page 3: About This Manual
About This Manual Subject This manual explains how to install, set-up and use the OSA20 optical spectrum analyzer. It also explains how to perform basic maintenance operations. This document applies to the OSA20 version 1.10.x. Intended Readers Users of this manual must be familiar with fiber optic technology. - Page 4 (electronic, mechanical, magnetic, optical, chemical, photocopying, manual, or otherwise) without the prior written permission of EXFO. Product Warranty For detailed information about the sales terms and conditions, visit the EXFO web site at and Limitation of www.exfo.com/how-to-buy/sales-terms-conditions Warranty...
-
Page 5: Table Of Contents
Unpacking and Installing the OSA20 ....................23 Connecting the OSA20 to a Power Source..................25 2.2.1 Connecting the OSA20 to the Wall Socket Using the Power Adapter ........ 25 2.2.2 Connecting the OSA20 to a 48 V DC Power Source ............26 Connecting a Light Source to the OSA20 ................... - Page 6 6.14.2 Analyzing Ripple Results ..................... 100 6.15 Setting Up Optical Power Analysis ....................101 6.15.1 Defining Optical Power Analysis Parameters ..............101 6.15.2 Analyzing Optical Power / Gain / Loss Results ..............102 6.16 Setting Up Loss Measurement Analysis................... 103 OSA20 User Guide...
- Page 7 Saving Analysis Settings and Results....................121 Loading Measurement and Analysis Settings ................. 122 Handling Files Saved ......................... 123 Using the OSA20 in Remote Control ....................125 Preparing the OSA20 for Remote Control ..................125 8.1.1 Modifying the GPIB Address ....................125 8.1.2...
- Page 8 10.1.2 Dealing with File Handling Error Messages ............... 141 10.1.3 Dealing with User Calibration Error Messages ..............141 10.1.4 Dealing with Trace Analysis Warning Messages............... 143 10.1.5 Forcing the OSA20 to Shutdown & Restart ................ 143 10.2 Using Remote Assistance Tools ....................... 144 10.2.1 Performing a Self-test......................144 10.2.2 Sending Debug Data to EXFO Support Service ..............
-
Page 9: Important Safety Information For Your Product
The product is equipped with a frame or chassis terminal. On (Power) Off (Power) On/Off (Power) Fuse Electrical Safety Information This unit uses an international safety standard three-wire power cable. This cable serves as a ground when connected to an appropriate AC power outlet. OSA20 User Guide... - Page 10 If the equipment is used in a manner not specified by the manufacturer, the protection provided by the equipment may be impaired. • Use only accessories designed for your unit and approved by EXFO. For a complete list of accessories available for your unit, see its technical specifications or contact EXFO.
- Page 11 Do not install or terminate fibers while a light source is active. • Never look directly into a live fiber and ensure that your eyes are protected at all times. Gas Safety The OSA20 contains acetylene gas in a sealed cell of less than 2 cm OSA20 User Guide...
- Page 12 Important Safety Information for Your Product OSA20 User Guide...
-
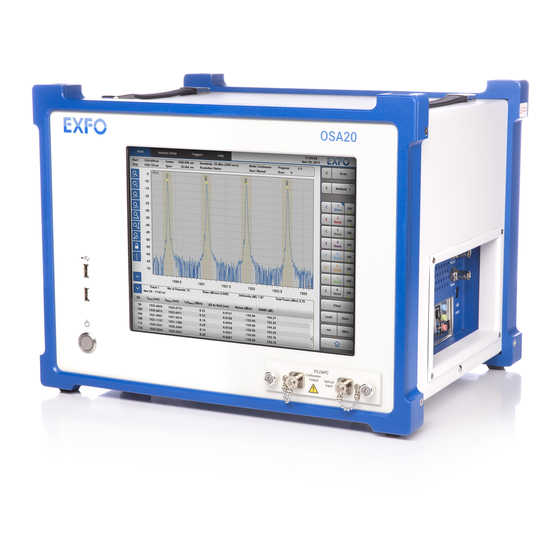
Page 13: Product Presentation
1. Product Presentation The OSA20 is a diffraction-grating based optical spectrum analyzer, using a touch sensitive display with multi-touch gesture control. It provides an extensive suite of built- in analysis functions enabling input signal measurement and analysis for many common applications. - Page 14 Low level: <2 V • Input maximum range: 0–5.5 V Trigger Out (BNC) • High level: 4.5 to 5 V on high-impedance load (>10 kΩ) • Low level: 0 to 0.5 V on high-impedance load (>10 kΩ) OSA20 User Guide...
- Page 15 Dimensions & Weight W 413 x H 314 x D 385 mm, 15 kg Available Accessory Rack mount kit The validity of specifications depends on operating conditions. For more details, see section Calibrating the OSA20, p. 136. OSA20 User Guide...
-
Page 16: Product Overview
Optical connectors Figure 1: Front Panel On/Off button label identifies the On/Off button that enables you to turn on or off the OSA20 (see section Turning on/off the OSA20 and Accessing an Analysis Mode, p. 31). Multi-touch Screen The multi-touch screen enables you to perform all possible operations on the OSA20. - Page 17 USB 2.0 type-A ports located on the front panel. They enable you to connect USB devices such as: • Keyboard and mouse if needed (see section Connecting USB Devices to the OSA20, p. 28) • USB key or hard disk to export your measurement results •...
-
Page 18: Left-Side Panel: Cooling Fan
Product Presentation 1.2.2 Left-side Panel: Cooling Fan The cooling fan, located on the left-side panel of the OSA20, extracts warm air from inside. A cover grid protects it. Cooling Fan Figure 2: Left-side panel – Cooling Fan OSA20 User Guide... -
Page 19: Right-Side Panel: Connectors
HDMI port For more details on how to configure the external screen settings, see section Sharing the OSA20 Display with an External Screen, p. 29. Trigger Ports The trigger ports enable you to synchronize scans with a signal (see section Interfaces &... - Page 20 You can configure this port manually or automatically through a remote DHCP server. For more information, section Using the OSA20 in Remote Control, p. 125. Important The Ethernet ports can only be used for remote control of the OSA20. Any other use is not possible. Audio and Serial Ports Unused ports.
-
Page 21: Rear Panel
This port (also known as GPIB port) enables you to perform remote control operations. For more information, see section Using the OSA20 in Remote Control, p. 125. The IEEE 488 port is SELV classified; you must only connect it to interfaces of the same type. - Page 22 Compliances: see section Certification and Compliance, p. 145. Windows License Label The OSA20 embeds Windows Standard Seven. Warranty Seal Warranty void The OSA20 cover must not be open, otherwise the warranty if seal broken. is not valid anymore. OSA20 User Guide...
-
Page 23: Installing And Connecting The Osa20
The OSA20 is designed for indoor use only, and is not dedicated to wet locations. It must be operated under proper environment conditions, as explained in the following procedure. -
Page 24: Figure 5: Air Flow
Gently pull horizontally the protective cover out of the front panel. 8. To tilt the OSA20 upward, deploy the two retractable legs located below it. Figure 6: Retractable Legs OSA20 User Guide... -
Page 25: Connecting The Osa20 To A Power Source
Connecting the OSA20 to the Wall Socket Using the Power Adapter Subject The OSA20 has a chassis connected to ground via the power supply cord. A protective ground connection by way of the grounding conductor in the power cord is essential for safe operation. -
Page 26: Connecting The Osa20 To A 48 V Dc Power Source
Installing and Connecting the OSA20 2.2.2 Connecting the OSA20 to a 48 V DC Power Source Subject You can directly connect the OSA20 to a 48 V DC power source by following the instructions given in this section. Connector Description... -
Page 27: Connecting A Light Source To The Osa20
Important Keep protective caps on optical connectors when not in use. 2. Connect the light source to the optical input of the OSA20 with the appropriate jumper corresponding to the connector type mounted on your product, as indicated on the connector’s plate (see Figure 1, p. 16). -
Page 28: Handling Usb Devices With The Osa20
Connecting USB Devices to the OSA20 Subject You can connect storage USB devices, mouse and keyboard to the USB 2.0-A and USB 3.0-A ports located on the front and right-side panels of the OSA20 (see Figure 1, p. 16 and Figure 3, p. 19). Procedures Connecting USB Storage Devices •... -
Page 29: Sharing The Osa20 Display With An External Screen
Installing and Connecting the OSA20 Sharing the OSA20 Display with an External Screen Subject You can connect an external screen to the OSA20 to share the display and control (you do not need to restart the OSA20). Before Starting Make sure you have the appropriate connection cable to connect your external screen. - Page 30 Installing and Connecting the OSA20 OSA20 User Guide...
-
Page 31: Turning On/Off The Osa20 And Accessing An Analysis Mode
After a few seconds, the button lights up. The startup procedure takes approximately 1 minute and 30 seconds. Once started, the OSA20 home window appears. • If the OSA20 is turned on and you have selected an analysis mode or a configuration window: • Touch the button. -
Page 32: Setting General Parameters
Enables you to set the OSA20 general parameters. For more details, see section Setting General Parameters, p. 32. Enables you to set the remote control parameters of the OSA20. For more details, see section Using the OSA20 in Remote Control, p. 125. -
Page 33: Figure 9: Osa20 Settings
Only applies if an external screen is connected to one of the screen connectors (see Figure 3, p. 19), and if the External screen setting is selected. Resolution of the screen on which you want to display the OSA20 graphical user interface. The resolution immediately changes on the external screen. - Page 34 OSA20 system and restores the Settings original default settings. Delete All User Deletes all data saved by a user on the internal OSA20 drive. All user Data on Drive customized settings, parameters and traces displayed on screen are not deleted.
-
Page 35: Accessing An Analysis Mode
Accessing an Analysis Mode Subject The OSA20 provides eight analysis modes. Each mode has its own available traces and analysis tools, which are adapted to the tested application. The available analysis tools by analysis mode are detailed in section Analyzing Traces, p. -
Page 36: Figure 10: Rlt Mode - Typical Use
Performing a User Calibration, p. 136 before accessing an analysis mode. Procedure 1. In the OSA20 home window, touch the right or left blue arrows to navigate to the wanted analysis mode. 2. Touch the button corresponding to the analysis mode you want to enter. -
Page 37: Figure 11: Analysis Mode Window
Acquisition, p. 46 (trigger IN) and section Generating Output Trigger Signals, p. 47 (trigger OUT). Help This tab displays the OSA20 User Guide. Using the Help tab during a scan may slow it down. Graph Display Settings This area allows you to adjust the graph display: see section Adjusting the Graph Display, p. - Page 38 Accessing the OSA20 Home Window, p. 31 USB Device Icon icon appears if you connect a USB device to the OSA20. It means that the device is available for loading or saving data, and enables you to safely remove it: see section Handling USB Devices with the OSA20, p.
-
Page 39: Turning Off The Osa20
Turning off the OSA20 Subject The following procedure explains how to correctly turn the OSA20 off. Caution Never turn the OSA20 off by directly setting the power switch to O. Procedure 1. Do one of the following: • Touch the button and in the home window, touch the button. - Page 40 Turning on/off the OSA20 and Accessing an Analysis Mode OSA20 User Guide...
-
Page 41: Defining Scan Measurement Parameters
The spectrum acquisition is performed on all available traces, according to the type of trace set. Important If you are using the OSA20 for the first time, you must calibrate it before performing scan measurements, as explained in section Calibrating the OSA20, p. 136. - Page 42 C/L/U buttons, p. 44). • Resolution • Native (default): the spectral resolution is automatically set to the OSA20’s monochromator factory-calibrated optical resolution bandwidth (see section Technical Specifications, p. 13). • Calculated: the spectral resolution is set to the value you specify in the value field.
- Page 43 The OSA20 performs a single scan of the optical spectrum (according to the defined trace types) and then stops. If a trace is set to Roll Average: n, the OSA20 performs n scans to be able to calculate the average value and then stops.
- Page 44 The OSA20 performs all scans successively with minimum pause between scans. • The OSA20 observes the period of time specified in the I field before starting the next successive scan. I: period of time between the beginning of two successive scans.
-
Page 45: Manually Starting/Stopping The Optical Spectrum Acquisition
The button label switches to Abort until the acquisition stops (at the end of the current scan). • If you touch the Abort button while the acquisition is stopping, the acquisition does not finish the spectrum scan and stops as quickly as possible. OSA20 User Guide... -
Page 46: Triggering The Optical Spectrum Acquisition
5. Select the wanted scanning parameters (see Scanning Parameters: Description, p. 42), and set the Start parameter to Triggered. The OSA20 will scan the optical spectrum according to the parameters set in the scan menu and in the Triggers tab. -
Page 47: Generating Output Trigger Signals
Generating Output Trigger Signals Subject The TRIG OUT BNC connector (see Figure 3, p. 19) allows you to output trigger signals when the OSA20 performs a scan, as explained in the following procedure. Procedure 1. Touch the Triggers tab. The trigger configuration screen appears. -
Page 48: Operating Scan Traces
Up Mask Test Analysis, p. 119. Each trace is represented by a different color. Trace Menu Description Trace configuration button Trace information Trace display Trace activation button button Trace handling buttons Trace types Figure 13: Trace Commands OSA20 User Guide... -
Page 49: Setting Trace Types
The trace pictures the ASE, calculated from the analysis performed on traces IN and OUT. TRANS PCT mode only. Calculated transfer function trace that cannot be modified. The trace pictures the log calculation of the DUT trace - REF trace. OSA20 User Guide... -
Page 50: Displaying/Hiding/Activating Traces
Copy button. 2. Touch the button located to the left of the trace number on which you want to paste the copied trace and touch the Paste button. The trace type is automatically set to Store. OSA20 User Guide... -
Page 51: Saving/Loading Traces
Defining Scan Measurement Parameters 4.2.4 Saving/Loading Traces Subject Traces can be saved in .csv, .xcsv (decimated data) or .tra (OSA20 specific format) formats on the following media: • The internal OSA20 drive (D:\ ( USER )). • An external USB key or hard drive. - Page 52 For example, if the resolution is set to 100 pm, the sampling resolution will be 1 point every 10 pm. Important If you load this type of trace file on the OSA20, missing points are generated on the graph by interpolation. 7. Touch the Save button.
-
Page 53: Handling Traces Files
You can access the OSA20 internal drive or an external hard drive connected to the OSA20 to handle the saved trace files. You can move trace files from one location to another, for example to copy a trace file saved on the internal drive to an external USB device. - Page 54 3. Select the trace you want to copy or cut and touch the button corresponding to the action you want to perform: button. 4. Select the drive and folder in which you want to paste the file and touch button. OSA20 User Guide...
-
Page 55: Adjusting The Graph Display
; the vertical zoom is not taken into account. If you touch the vertical scale while drawing the rectangle, the zoom only applies to the vertical scale ; the horizontal zoom is not taken into account. OSA20 User Guide... - Page 56 Fits the wavelength range to the total range covered by all displayed traces. Fits the power range to the to the total range covered by all displayed traces. Undoes the last zoom action. Disables/Enables all multi-touch screen gestures on the graph. OSA20 User Guide...
-
Page 57: Performing Manual Measurements With Markers
On the graph, touch the letter corresponding to the marker you want to move and slide it to the wanted position. To make it easier to move markers without moving the graph, you can lock the graph by clicking the button. OSA20 User Guide... - Page 58 Opens a numeric keypad allowing you to type the exact marker position value (wavelength value or power value). Automatically places the selected marker to the center of the graph. 4. To hide markers, touch the button. The marker positions are kept in memory. OSA20 User Guide...
-
Page 59: Analyzing Traces
81 Analyzing λcenter and σ λcenter and σ Results, p. 82 Analyzing FWHM Results, FWHM p. 83 Analyzing Side Modes Side Modes Spacing Spacing Analysis, p. 84 Setting Up Notch Width Notch Width Analysis, p. 85 OSA20 User Guide... -
Page 60: Figure 16: Analysis Menu
Tool related sections are indicated in the above table. 3. In the <Analysis Mode> tab, touch the located at the left of the Analyze button. The analysis menu appears. Figure 16: Analysis Menu OSA20 User Guide... - Page 61 6. Make sure the trace to analyze is not empty. If so, perform a scan to get data on the trace. 7. If the Auto Analysis check box is cleared (or if the Between Markers Only parameter is activated and you have moved a marker), touch the Analyze button. OSA20 User Guide...
-
Page 62: Figure 17: Analysis Results - Example Window (Bbs Analysis Mode)
Results are grouped according to occupying the least possible space on screen. If you deactivate a tool, the results reorder. Results Displayed in a Table of Channels This type of display is used in the following analysis modes: • WDM and RLT analysis modes. OSA20 User Guide... -
Page 63: Figure 18: Analysis Results - Example Window (Wdm Analysis Mode)
Multichannel (see section Defining Gain & NF Analysis Parameters, p. 105). Graphical display item Result area sizing buttons Result display area Figure 18: Analysis Results – Example window (WDM Analysis Mode) Once the scan is finished, you can touch a column title to sort it. OSA20 User Guide... -
Page 64: Setting Up Peaks And Troughs Search
Mode Threshold (WDM, OFA, PCT and RLT analysis modes only) Detected Channels Mode Threshold Rejected peaks Wavelength or Frequency Figure 19: WDM Analysis Mode – PT Search The only peaks retained are the ones with power higher than: [Max power]-[Mode Threshold]. OSA20 User Guide... -
Page 65: Figure 20: Pt Search
Peaks (default): graphical items are displayed on peaks. • Troughs: graphical items are displayed on troughs. • Both: graphical items are displayed on peaks and troughs. • (default for BBS, MML, PCT and SML analysis modes): no graphical item is displayed on the graph. OSA20 User Guide... -
Page 66: Analyzing Pt Search Results
In the WDM, RLT, PCT and OFA analysis modes: result values are displayed for each detected peak, in accordance with the value set for the Mode Threshold parameter. • In all other analysis modes, no result is displayed on graph. OSA20 User Guide... -
Page 67: Selecting The Component Under Test (Pct Mode)
Setting Up Pass Band Test Pass Band Test Analysis, p. 109 Setting Up Stop Band Test Stop Band Test Analysis, p. 114 Setting Up Loss Loss Measurement Measurement Analysis, p. 103 Setting Up Mask Test Mask Test Analysis, p. 119 OSA20 User Guide... -
Page 68: Setting Up Channel Detection
The grid channel array is first calculated based on the Start Wavelength, the Stop Wavelength and the Grid Spacing. The reference frequency can be set to any frequency with the Reference Frequency parameter (see below, p. 69). All other channels are then calculated from that reference channel labeled "Channel 0". OSA20 User Guide... -
Page 69: Figure 21: Wdm Display Mode: Grid
Setting General Parameters, p. 32) of the last channel on the grid. Default value: 1620 nm / 185.057 THz • Empty Channels: To avoid slowing the acquisition, empty channels are not displayed on graph. OSA20 User Guide... -
Page 70: Figure 22: Wdm Display Mode: Per Channel
Mode is set to Offset): reference channel for all calculation. • Maximum (default): the peak with maximum power detected is the reference channel for calculation. • Channel Number: the Channel Number entered is the reference channel for calculation. OSA20 User Guide... -
Page 71: Analyzing Wdm Channel Detection Results
32). It does not take the integrated power in channel, it only takes the peak power. • Uniformity: difference between maximum and minimum detected peak power. It does not take the integrated power in channel, it only takes the peak power. OSA20 User Guide... - Page 72 Spacing in wavelength/frequency of the channel N compared to its neighboring channel (N-1). ΔλLvl WDM and RLT modes only. Only if the Spacing display mode is selected. Power difference of the channel N compared to its neighboring channel (N-1). OSA20 User Guide...
-
Page 73: Setting Up Spectral Width Analysis
(see Fitting Options below), illustrated in the following figure. Width Threshold Modal ON Fit ON Modal ON Fit ON Modal ON Modal ON Modal OFF Fit OFF Fit OFF Wavelength or Frequency Figure 23: Threshold Algorithm OSA20 User Guide... -
Page 74: Figure 24: Envelop Algorithm
If Modal Analysis is set to OFF (see Fitting Options below), the curve fits a Gaussian or Lorentzian to the main peak. • If Modal Analysis is set to ON, the curve fits a Gaussian or Lorentzian to all peaks above Mode Threshold. OSA20 User Guide... -
Page 75: Figure 26: Gaussian Algorithm
Fit to Mode (only for Threshold algorithm, if Modal Analysis check-box is selected). • : the calculation of width is fitted to the nearest detected peaks. • (default): the calculation of width is fitted to the curve-threshold crossing (see Figure 23, p. 71). OSA20 User Guide... -
Page 76: Analyzing Spectral Width Results
(OSA and MML modes only) Calculated mode spacing value. For RMS and RMS Peak algorithms, the spacing is calculated using the peaks above threshold. σ Only for RMS and RMS Peak algorithms. Standard deviation value of the measured peak. OSA20 User Guide... -
Page 77: Setting Up Xxdb Width Analysis
Algorithm: method used for the calculation of the width. Description • Threshold (default) λ λ The Threshold algorithm detects the wavelengths at which the power falls below [Peak Power]-[Width Threshold]. Width Threshold Wavelength or Frequency Figure 27: Threshold Algorithm (BBS Analysis Mode) OSA20 User Guide... -
Page 78: Figure 28: Rms Algorithm (Bbs Analysis Mode)
Power P = P – Width Threshold. peak Default value: 20 dB • Mode Threshold (only for Envelope, Gaussian Fit and Lorentzian Fit algorithms). Retains peaks with power P > P – Mode Threshold. peak Default value: 20 dB OSA20 User Guide... -
Page 79: Analyzing Xxdb Width Results
λ+ and λ-. • is displayed between λ- and λ+. Result Area Result Meaning Δλ@xxdB/Δν@xxdB Width at Width Threshold using the selected algorithm method. For RMS and RMS Peak algorithms, the width is the standard deviation (σ). OSA20 User Guide... -
Page 80: Setting Up Λmean Analysis
(for more details, see Figure 28, p. 78): • Width Threshold: 20 dB • Mode Threshold: 40 dB • Multiplier: 1 • Fit to Mode: No • Modal analysis: Yes OSA20 User Guide... -
Page 81: Analyzing Λmean Results
Modal Analysis: No Result Description Results Displayed on Graph The following graphical display items are displayed on graph: • is displayed on the peak wavelength. • is displayed on λ+ and λ-. • is displayed between λ- and λ+. OSA20 User Guide... -
Page 82: Analyzing Λcenter And Σ Results
• is displayed on λ+ and λ-. • is displayed between λ- and λ+. Result Area Result Meaning λ /ν Central wavelength/frequency center center σ Standard deviation of the measured peak. OSA20 User Guide... -
Page 83: Analyzing Fwhm Results
MML Analysis Mode • Algorithm: Gaussian Fit • Width Threshold: 3 • Mode Threshold: 20 • Multiplier: 1 • Fit to Mode: No • Modal Analysis: Yes Result Description Result Meaning FWHM Full width at half maximum value. OSA20 User Guide... -
Page 84: Analyzing Side Modes Spacing Analysis
Result Description Analysis results are displayed below the graph (see section Result Area Description, p. 62). Result Meaning Side Modes Calculated spacing of the residual side mode detected (when Spacing possible) outside of the main peak feature. OSA20 User Guide... -
Page 85: Setting Up Notch Width Analysis
Notch Selection: method used for the selection of the trough to analyze. • Deepest Notch: selection of the feature with biggest difference between trough and adjacent peaks. • Minimum Trough (default): selection of the lowest level trough. OSA20 User Guide... -
Page 86: Figure 30: Notch Width - Notch Selection
Bottom (default): the width is calculated from the trough. • Top: the width is calculated from the two surrounding peaks on either side of the notch to be analyzed. Width Threshold Bottom Width Threshold Wavelength or Frequency Figure 31: Notch Width – Width Reference OSA20 User Guide... -
Page 87: Analyzing Notch Width Results
Level notch λ /ν Notch Width 1/2/3 tool only. trough trough Calculated trough wavelength/frequency and its associated power. Level trough Δλ /Δν Spectral notch width at Width Threshold using the selected notch notch algorithm method. OSA20 User Guide... -
Page 88: Setting Up Level Check Analysis
Wavelength/frequency of the point for which the power level is measured. Default values: • Reference Point 1: 1520 nm or 197.232 THz • Reference Point 2: 1550 nm or 193.414 THz • Reference Point 3: 1570 nm or 190.950 THz OSA20 User Guide... -
Page 89: Analyzing Level Check Results
Difference in dB between the power level measured at Reference Point 2 and the power level measured at Reference Point 1. ΔLvl 3-1 Difference in dB between the power level measured at Reference Point 3 and the power level measured at Reference Point 1. OSA20 User Guide... -
Page 90: Setting Up Smsr Analysis
Mask exclusion area. • Side Mode Calculation • Highest (default): returns the side modes with highest detected power (as required in IEC 61280-1-3). • Nearest: returns the side modes that are closest to the peak, outside the mask area. OSA20 User Guide... -
Page 91: Analyzing Smsr Results
SideBand 1/SideBand 2 Results (only if Algorithm is set to LR) λ 1/ν 1 Only if Algorithm is set to LR. SideMode SideMode Wavelength and power of the side mode on the left/right of Level SideMode the main mode. λ 2/ν SideMode SideMode Level SideMode OSA20 User Guide... - Page 92 Difference between the wavelength/frequency of the side modes on the left/right of the main mode. Center Offset Only if Algorithm is set to LR. Difference between the wavelength/frequency of the main mode and the middle of the stop band. OSA20 User Guide...
-
Page 93: Setting Up Osnr Analysis
In case of OSA20, a correction factor is added to account for the Gaussian shape of the filtering, instead of the rectangular shape obtained at larger bandwidth. The standard also indicates that the calculation of Ni, usually not measurable due to the presence of the signal peak, needs to be done based on interpolation (i.e. -
Page 94: Figure 34: Osnr Analysis - On-Off Method
• The noise ρ(λ) is the noise power density expressed in mW/nm. • In case of OSA20, the integration is replaced by a sum of all signal and noise data points, spaced by dλ = 2 pm. Chan i s(λ)+ ρ(λ) ρ(λ) -
Page 95: Figure 35: Osnr Parameters
Fixed (OSA and SML analysis modes default): fixed distance value from the main peak, entered in the SN Spectral Distance field. • Nearest Peaks: half the distance between the nearest peak and the main peak. If only one peak is detected, the Nearest Troughs method is used. OSA20 User Guide... - Page 96 Power Integration (only if Noise Point Selection is set to Fixed, Nearest Peaks and Nearest Troughs): • (WDM analysis mode default): the signal power is integrated over the defined Power Integral Range. • (OSA, SML and OFA analysis modes default): the signal power is defined as the peak power. OSA20 User Guide...
-
Page 97: Analyzing Osnr Results
Result Description Results Displayed on Graph If you have selected the Display on Graph check box, the following graphical items are displayed on graph: • is displayed on the signal power/wavelength. • is displayed on the noise power. OSA20 User Guide... - Page 98 OSNR/ Value of the OSNR as defined by the calculation given above in IEC standard 61280-2-9 subsection, p 93 for OSA20. OSNR (OFA) IN/OUT WDM analysis mode only. Integrated power measurement within the Power Integral Range if the Power Integration check box is selected.
-
Page 99: Setting Up Ripple Analysis
In case of SLED, the ripple is caused by Fabry-Perot (FP) effect. To display the equivalent FP length estimated based on ripple frequency measurement, the refractive index of the material causing the ripple is required. Default value: 1.00027326 (air @1550 nm) OSA20 User Guide... -
Page 100: Analyzing Ripple Results
Spacing Mean spacing of measured ripple peaks above the detection threshold, after removal of the baseline. Equivalent FP Length Estimated Fabry-Perot length, based on ripple spacing and on the refractive index given as input. OSA20 User Guide... -
Page 101: Setting Up Optical Power Analysis
(in nm) of the trace. • in the equation takes into account the Gaussian filtering response of the monochromator inside the OSA20. • is the sum of all the values of power (Pi) of the trace, in mW (conversion if needed) divided by the corresponding resolution bandwidth (Ri). -
Page 102: Analyzing Optical Power / Gain / Loss Results
Total Power (xW) Power measured within the scan range in Watt, scaling automatically in pW, nW, uW, mW. If no power (or negative power) is detected, the result displays 0 mW. Average Only for traces in dB. Gain/Loss Average gain/loss measured within the scan range in dB. OSA20 User Guide... -
Page 103: Setting Up Loss Measurement Analysis
Analysis results are displayed below the graph (see section Result Area Description, p. 62). Result Description Result Meaning Average Loss Only for traces in dB. Measured fiber attenuation, in dB. Uniformity Only for traces in dB. Difference between minimum and maximum loss within the analysis range, in dB. OSA20 User Guide... -
Page 104: Setting Up Peak Power Density Analysis
Parameters, p. 32). Power Density Power density measured in µW (or pW, nW, mW)/nm or µW (or pW, (µW/nm or nW, mW)/THz, depending on the selected measurement unit (see µW/THz) section Setting General Parameters, p. 32). OSA20 User Guide... -
Page 105: Setting Up Gain And Noise Figure Analysis
OUT. Default value: 0 dB Noise Figure Settings • Noise Figure Selection Equation used for the calculation of the noise figure: • Full (default): the following whole equation is used for the calculation. OSA20 User Guide... - Page 106 If no filter is used, set this parameter to the width of the optical amplifier output used when Noise Figure Selection is set to Full. Set this parameter to 0 to achieve simplified IEC equation with shot noise. Default value: 0 GHz OSA20 User Guide...
-
Page 107: Analyzing Gain And Nf Results
Optical signal to noise ratio of the output signal power to the ASE noise power (with the Reference Optical BW set in the OSNR tool output). Ratio of signal output power to measured output power. In Multichannel experimental setup, the following results are available above the table: OSA20 User Guide... - Page 108 G Slope: slope of a linear fit to all tested channel’s gain. • : average gain obtained from all tested channel’s gain. • Total P : power of input signal measured within the scan range. • Total P : power of output signal measured within the scan range. OSA20 User Guide...
-
Page 109: Setting Up Pass Band Test Analysis
Peak λ Center λ Wavelength or Frequency Figure 38: Pass Band Test – In Reference Selection • IN/OUT Band Method Method used in crosstalk calculation for the estimate of the spectral spacing between in and out bands: OSA20 User Guide... -
Page 110: Figure 39: Pass Band Test - Out Reference Selection
Figure 40: Pass Band Test – Averaging Range: Fixed Range • % Bandwidth: sets the range to a fraction of the bandwidth measured from the Spectral Width 1 tool (see section Analyzing Spectral Width Results, p. 76). OSA20 User Guide... -
Page 111: Figure 41: Pass Band Test - Averaging Range: % Bandwidth 1
Fraction (in %) of the bandwidth calculated in Spectral Width 1 over which calculations are done. The range is centered on the reference points for in-band and out-band (set in CrossTalk Settings, p. 109). Default value: 50 % OSA20 User Guide... -
Page 112: Figure 43: Roll Off Calculation - Transition In Band
Avg Loss OUT Exclusion Thresh. Wavelength or Frequency Figure 44: Roll off calculation – Transition Out Band • Min Exclusion Thresh. (in dB) Minimum threshold for the exclusion of data outside of the transition band. Default value: 3 dB OSA20 User Guide... -
Page 113: Analyzing Pass Band Test Results
• are display on the transition range. Result Area The RollOff measurement is performed on the OSA20 trace, which is a convolution of the filter under test and the OSA20 monochromator. • In-Band Results... -
Page 114: Setting Up Stop Band Test Analysis
• Bandwidth 1 (default): selects the out band reference points to be exactly a bandwidth away from the in-band point, using the result in Notch Width 1 tool (see section Analyzing Notch Width Results, p. 87). OSA20 User Guide... -
Page 115: Figure 46: Stop Band Test - Out Reference Selection
Figure 47: Stop Band Test – Averaging Range: Fixed Range • % Bandwidth: sets the range to a fraction of the bandwidth measured from the Notch Width 1 tool (see section Analyzing Notch Width Results, p. 87). OSA20 User Guide... -
Page 116: Figure 48: Stop Band Test - Averaging Range: % Bandwidth 1
Fraction (in %) of the bandwidth calculated in Notch Width 1 over which calculations are done. The range is centered on the reference points for in-band and out-band (set in isolation depth settings). Default value: 50 % OSA20 User Guide... -
Page 117: Figure 50: Roll Off Calculation - Transition In Band
Roll Off @ XdB Wavelength or Frequency Figure 51: Roll off calculation – Transition Out Band • Min Exclusion Thresh. (in dB) Minimum threshold for the exclusion of data outside of the transition band. Default value: 3 dB OSA20 User Guide... -
Page 118: Analyzing Stop Band Test Results
RollOff Maximum roll off in dB/nm (or dB/THz), within the transition band. λ @RollOff Wavelength of maximum roll off in nm. Transition Band Wavelength region between Transition Reference -/+ Minimum Threshold and Reference point -/+ Maximum Threshold. OSA20 User Guide... -
Page 119: Setting Up Mask Test Analysis
You can acquire these traces using the OSA20 or prepare them in .csv files. Important The wavelength/frequency range of the mask traces must be higher than or equal to the wavelength/frequency range of the transfer function trace that is analyzed. -
Page 120: Analyzing Mask Test Results
Fail HI/LO: the transfer function runs over the high and low limits of the mask. • No Masks: no mask is defined. • Mask size error: the wavelength/frequency range of the mask traces is lower than the wavelength/frequency range of the transfer function trace that is analyzed. OSA20 User Guide... -
Page 121: Saving/Loading Configuration Settings And Handling Files
4. If you want to create a new folder: touch the button and type a name for the folder (using the on-screen keyboard or a normal keyboard if connected to the OSA20), and touch the Create button. 5. Select the type of file to save: •... -
Page 122: Loading Measurement And Analysis Settings
7. Touch the Save button. A confirmation message appears. 8. Safely remove the USB device (if any) as explained in section Disconnecting USB Storage Devices from the OSA20, p. 28. Loading Measurement and Analysis Settings Subject You can restore measurement and analysis parameters you have previously saved, or the default measurement and analysis parameters set for an analysis mode. -
Page 123: Handling Files Saved
You can access the OSA20 internal drive or an external hard drive connected to the OSA20 to handle the settings and screen shot files you have saved. You can move the files from one location to another, for example to copy a file saved on the internal drive to an external USB device. - Page 124 Saving/Loading Configuration Settings and Handling Files OSA20 User Guide...
-
Page 125: Using The Osa20 In Remote Control
8.1.1 Modifying the GPIB Address Subject If you want to remotely control the OSA20 through the IEEE 488 port, you can modify the GPIB address. The default GPIB address is 10. You can set it out between 1 and 30. -
Page 126: Figure 54: Osa20 Remote Parameters
4. Set the corresponding parameters as explained in the following Ethernet Parameter Description subsection, p 126. • Use Port 1 (left) to directly connect a computer to the OSA20. This ports provides an automatic IP address configuration. • Use Port 2 (right) to remotely control the OSA20 from a computer through your company network, or to directly connect a computer to the OSA20 and manually configure the connection parameters. - Page 127 Using the OSA20 in Remote Control Setting Description Port 1 (left) This port enables the direct connection to a computer for remote control. : indicates that the connection is established and displays the connection speed. : indicates that the connection to the external device is not established.
-
Page 128: Installing The Usb Driver On The Remote Computer
USB driver and unzip it to a temporary folder on your computer. 2. Connect your computer to the OSA20 by using a USB-A to USB-B cable. The first time you connect the OSA20 to your computer, it prompts you to install the driver. -
Page 129: Entering The Remote Mode
Procedure 1. Connect the external controller to the appropriate connector: • For GPIB: the GPIB port located on the rear panel of the OSA20 (see Figure 4, p. 21). • For Ethernet: one of the two available Ethernet port located on the right side panel of the OSA20 (see Figure 3, p. - Page 130 Using the OSA20 in Remote Control OSA20 User Guide...
-
Page 131: Performing Basic Maintenance Operations
3. Turn off the OSA20 (see section Turning off the OSA20, p. 39). 4. On the front panel, press the button to turn on the OSA20. The OSA20 automatically detects the .pkg file on the USB device and starts the firmware update wizard. Caution To avoid serious system problems: •... -
Page 132: Cleaning The Osa20
9.2.2 Cleaning the Fan Grid Subject To ensure proper cooling of the OSA20 from the fan, the fan grid must not be dusty, you must clean it regularly. Caution Do not use a vacuum cleaner to clean the fan as this may apply excessive force to it and cause damage to the fan. -
Page 133: Cleaning The Multi-Touch Screen
Isopropyl alcohol Procedure 1. Turn the OSA20 off (see section Turning off the OSA20, p. 39) and unplug the power supply cord from the wall socket. 2. Using an lint-free cloth slightly damped with isopropyl alcohol, gently swipe dirt on the screen. -
Page 134: Cleaning Optical Connectors
Lint-free tissue or cleaning cartridges Procedure 1. Turn the OSA20 off (see section Turning off the OSA20, p. 39) and unplug the power supply cord from the wall socket. 2. On the front panel, make sure the protective caps of the connector’s plate are in place. - Page 135 9. Replace the connector’s plate on the front panel: a. Gently place fibers and labels into the hole on the front panel. b. Screw the plate back it in its location, making sure no fiber is trapped between the front panel and the plate. OSA20 User Guide...
-
Page 136: Calibrating The Osa20
Make sure the room temperature is stabilized, and the OSA20 is at room temperature. • Make sure the OSA20 has been turned on at least for one hour. The user calibration process must only be performed after at least one hour warm-up. •... -
Page 137: Carrying The Osa20
Performing Basic Maintenance Operations Carrying the OSA20 Subject The two flexible handles located on the top side of the OSA20 allow you to carry it from one location to another, as explained in the following procedure. Before Starting Caution Never carry the OSA20 if it has been abruptly turned off (see section Forcing the OSA20 to Shutdown &... - Page 138 Performing Basic Maintenance Operations OSA20 User Guide...
-
Page 139: 10. Troubleshooting
-1010 to -1013 Possible Resolution -1015 • Turn the OSA20 off, turn it on again and try to perform the action that caused the error. • If the error appears again, turn the OSA20 off immediately (see section Turning off the OSA20, p. - Page 140 • The room temperature is higher than 35 °C (95 °F). -> Turn the OSA20 off (see section Turning off the OSA20, p. 39) and make sure the temperature room is lower than 35°C before turning on the OSA20 again.
-
Page 141: Dealing With File Handling Error Messages
EXFO customer support service (see section Contact Information, p. 4). Error Code Description -2003 The input calibration signal power is too low, the system cannot calibrate the OSA20. Possible Resolution • The optical source is not properly connected to the OSA20. OSA20 User Guide... - Page 142 The calibration procedure has exceeded the allowed period of time. Possible Resolution • Turn the OSA20 off, turn it on again and try to perform the calibration procedure as explained in section Performing a User Calibration, p. 136. • If the error appears again, turn the OSA20 off immediately (see section Turning off the OSA20, p.
-
Page 143: Dealing With Trace Analysis Warning Messages
-> Modify the analysis parameters. 10.1.5 Forcing the OSA20 to Shutdown & Restart Subject In case of system crash and frozen screen, you can abruptly turn the OSA20 off as explained in the following procedure. Caution • Do not stop the OSA20 with this procedure if you can turn it off normally as explained in section Turning off the OSA20, p. -
Page 144: Using Remote Assistance Tools
The result of the test is displayed on screen. 10.2.2 Sending Debug Data to EXFO Support Service Subject Saving debug data and sending it to the EXFO customer support service can be useful for remote assistance. Procedure 1. In the OSA20 home window, touch the System button. -
Page 145: Certification And Compliance
Electronic test and measurement equipment is exempt from FCC part 15, subpart B compliance in the United States of America and from ICES-003 compliance in Canada. However, EXFO Inc. makes reasonable efforts to ensure compliance to the applicable standards. The limits set by these standards are designed to provide reasonable protection against harmful interference when the equipment is operated in a commercial environment. - Page 146 X: 表示该有害物质至少在该部件的某一均质材料中的含量超出 GB/T 26572 标准规定的限量要求。 标记 “X” 的部件,皆因全球技术发展水平限制而无法实现有害物质的替代。 a. If applicable. 如果适用。 MARKING REQUIREMENTS 标注要求 Product Logo Environmental protection uses period (years) 产品 标志 环境保护使用期限 (年) This EXFO product 本 EXFO 产品 Battery 电池 a. If applicable. 如果适用。 OSA20 User Guide...
-
Page 147: Table Of Figures
Figure 5: Air Flow ..............................24 Figure 6: Retractable Legs ............................ 24 Figure 7: Rear Panel – 48 V connector ........................ 26 Figure 8: OSA20 – Home Window ........................31 Figure 9: OSA20 Settings ............................33 Figure 10: RLT Mode – Typical Use ........................36 Figure 11: Analysis Mode Window ........................ - Page 148 Figure 51: Roll off calculation – Transition Out Band ..................117 Figure 52: PCT Analysis – Example of Mask Traces ..................119 Figure 53: MSK HI Menu ............................. 120 Figure 54: OSA20 Remote Parameters ......................126 Figure 55: Optical Connectors (FC type) – Cleaning ..................134 OSA20 User Guide...
Need help?
Do you have a question about the OSA20 and is the answer not in the manual?
Questions and answers