
Related Manuals for THORLABS RSBF2


Summary of Contents for THORLABS RSBF2
- Page 1 Raman Spectroscopy Bundle RSB1(/M,) RSBR1(/M), RSBC1(/M), RSBF2, RSBA1 Operation Manual...
- Page 2 Version: Date: 07-Mar-2023 Copyright © 2023 Thorlabs...
-
Page 3: Table Of Contents
3 Operating Elements 3.1 RSB1(/M) Base Unit 3.2 RSBR1(/M) Front End for Reflective Measurements 3.3 RSBC1(/M) Front End for Cuvette Measurements 3.4 RSBF2 Fiber Input Adapter 3.5 RSBA1 Mounting Brackets for Cage System 4 System Setup 4.1 Mounting RSB1(/M) 4.2 Mounting Front Ends and Adapters 4.2.1... - Page 4 RSBC1/M and RSBC1 Dimensions 8.1.4 RSBF2 Technical Data 8.1.4.1 RSBF2 Dimensions 8.1.5 RSBA1 Technical Data 8.1.5.1 RSBA1 Dimensions 8.1.6 Thorlabs Raman Bundle Technical Data 8.1.7 Laser Requirements 8.1.8 Technical Data Explained 8.1.8.1 Signal-to-Noise Characterization 8.1.8.2 Spectral Accuracy and Spectral Resolution 8.1.8.3 Amplitude Correction 8.2 List of Acronyms...
- Page 5 8.5.2.2 Zooming and Scrolling the Vertical Axis 8.5.2.3 Setting the Unit of the Horizontal Axis 8.5.2.4 Setting the Unit of the Vertical Axis 8.5.2.5 Displaying the Secondary Vertical Axis 8.5.2.6 Hiding the Menus and Full Screen Mode 8.5.2.7 Displaying a Split View 8.5.2.8 Displaying a Legend in the Data Display Area 8.5.2.9...
- Page 6 8.5.10 General OSA Raman Settings 8.5.10.1 Basic Settings 8.5.10.2 Saving and Loading Settings 8.6 Safety 8.7 Return of Devices 8.8 Manufacturer Address 8.9 Warranty 8.10 Copyright and Exclusion of Liability 8.11 Thorlabs Worldwide Contacts - WEEE Policy...
- Page 7 Paragraphs preceded by this symbol explain hazards that could damage the instrument and the connected equipment or may cause loss of data. Note This manual also contains "NOTES" and "HINTS" written in this form. Please read this advice carefully! © 2023 Thorlabs...
-
Page 8: General Information
Chapter 1: General Information 1 General Information This manual describes the use of the Thorlabs components for Raman Spectroscopy, a spec- trograph, different front ends and adapters, suitable for varying applications. Raman spectroscopy is a technique that detects and analyzes inelastic photon scattering, known as Raman scattering. -
Page 9: Ordering Codes And Accessories
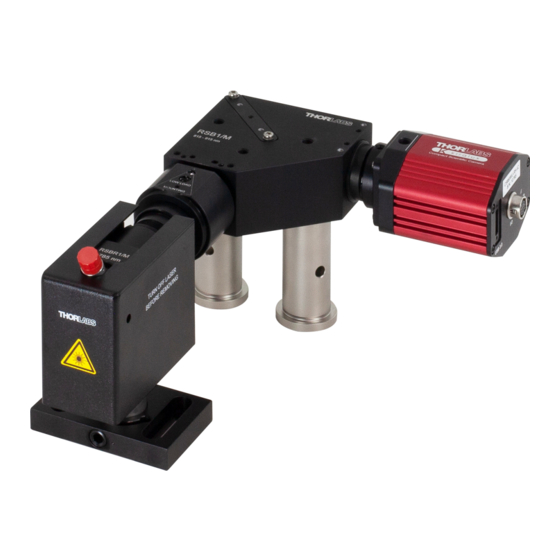
Raman scattering The RSBF2 fiber input adapter is designed for the RSB1(/M) to couple a fiber carrying Raman scattering from a user setup to the RSB1(/M) base unit. The RSBF2 generates a rectangular fo- cus of the Raman Signal which matches the rectangular input aperture of the RSB1(/M) Thorlabs Raman bundle. - Page 10 Raman Spectroscopy Polystyrene Standard Chip (Æ 25 mm) for Instrument Calibration with the RSBR1(/M) Reflective Measurement Front End. CV10Q35F 3500 ml Macro Fluorescence Cuvette with Cap. To purchase the above replacement parts, please contact Thorlabs. Recommended Accessories: Safety Glasses Page 3...
-
Page 11: Requirements
· Windows 10 (32-bit, 64-bit) For operation of the OSA Raman Software, the Microsoft .NET Framework version 4.5.2 or higher is required. This software (version 4.7.2) is included with the Thorlabs OSA Raman Soft- ware installation package. Page 4 Rev: 1.2, 07-Mar-2023... -
Page 12: Getting Started
Raman Spectroscopy Bundle Chapter 2: Getting Started 2 Getting Started 2.1 Parts List Please inspect the shipping container for damage. Please do not cut through the cardboard. You might need the box for storage or for returns. If the shipping container seems to be damaged, keep it until you have inspected the contents for completeness and tested the Raman Spectroscopy Bundle mechanically and electrically. - Page 13 6. RPB Polystyrene Block for Calibration 7. Quick Reference RSBF2 Fiber Input Adapter 1. RSBF2 Fiber Input Adapter with Protective SM1 Cap (Output Aperture) and SMA Protection Cap (Input Aperture) 2. Quick Reference RSBA1 Adapter for 60 mm Cage Systems 1.
-
Page 14: Operating Elements
Raman Spectroscopy Bundle Chapter 3: Operating Elements 3 Operating Elements 3.1 RSB1(/M) Base Unit The RSB1(/M) Base Unit components are labeled in the image below, which shows the RSB1/M model. Aside from the posts and mounting threads, RSB1 and RSB1/M are identical. Attention Do not remove covers! There are no user-serviceable parts inside! RSB1(/M) Features... -
Page 15: Rsbr1(/M) Front End For Reflective Measurements
Raman Spectroscopy Bundle Chapter 3: Operating Elements 3.2 RSBR1(/M) Front End for Reflective Measurements The RSBR1(/M) front end components are labeled in the image below, which shows the RSBR1/M model. Page 8 Rev: 1.2, 07-Mar-2023 © 2023 Thorlabs... - Page 16 Raman Spectroscopy Bundle Chapter 3: Operating Elements RSBR1(/M) Features RSBR1(/M) Output Aperture and RSB1(/M) Base Unit Input Aperture A protective cap covers the apertures upon delivery. Optical Baffle Assembly to the RBS1(/M) SM1 Internal Thread SM1 Locking Ring RSBR1(/M) Main Body with Fiber Connector, Raman Signal Entrance Window, Bandpass Filter and Collecting Mirror for Raman Scattering FC/PC Connector for Laser Input Sample Table...
-
Page 17: Rsbc1(/M) Front End For Cuvette Measurements
FC/PC connector for Laser Input Mounting Post in Post Holder with Spring-Loaded Locking Screw* FC/PC Protection Cap Light-Tight Cover * Post and Holder differ for metric and imperial versions. Please see the packing list. Page 10 Rev: 1.2, 07-Mar-2023 © 2023 Thorlabs... -
Page 18: Rsbf2 Fiber Input Adapter
Raman Spectroscopy Bundle Chapter 3: Operating Elements 3.4 RSBF2 Fiber Input Adapter Attention Do not remove the AD12F adapter! For optimal performance, the position of the Fiber Collim- ator is factory calibrated. Page 11 MTN022733-D02... -
Page 19: Rsba1 Mounting Brackets For Cage System
Chapter 3: Operating Elements 3.5 RSBA1 Mounting Brackets for Cage System The dowel pins which fit into the dowel pin taps shown in the Operating Elements of RSB1(/M) are not shown here. Page 12 Rev: 1.2, 07-Mar-2023 © 2023 Thorlabs... -
Page 20: System Setup
Raman Spectroscopy Bundle Chapter 4: System Setup 4 System Setup The following chapter describes how to mount the base unit, the front ends, adapters and the FPV785M laser. Guidance for custom-made system mounting is also provided. 4.1 Mounting RSB1(/M) Mounting RSB1(/M) on the Breadboard Please mount the RSB1(/M) Base Unit on the provided breadboard using the enclosed posts and clamping forks. - Page 21 Use the mounting taps on the upper side indicated above. Attention Please do not put pressure on the camera or input aperture end as it can only accommodate low-load mounting. Page 14 Rev: 1.2, 07-Mar-2023 © 2023 Thorlabs...
-
Page 22: Mounting Front Ends And Adapters
Weight (£ 0.5 kg) and leverage should not exceed that of RSBR1(/M). Attention Do not mix metric and imperial systems as the post heights vary slightly. Thorlabs does not re- commend to do so as the beam path would need to be carefully adjusted. - Page 23 RSB1(/M) and the edge of the sample table free, as shown below. The RSBR1(/M) sample table might need to be slightly moved in order to fit the screws into the optical table. Page 16 Rev: 1.2, 07-Mar-2023 © 2023 Thorlabs...
- Page 24 Raman Spectroscopy Bundle Chapter 4: System Setup Stage Height To achieve optimal performance, the sample needs to be positioned in the optimal focal plane of the collection mirror for Raman scattered light. This mirror is positioned within the RSBR1(/M) main body. The focal plane for the sample is 54.1 mm (2.14'') above the breadboard for the metric system RSB1/M and RSBR1/M.
- Page 25 The resulting setup with the RSBR1(/M) front end mounted on the RSB1(/M) Base Unit should look as shown in the next picture. Page 18 Rev: 1.2, 07-Mar-2023 © 2023 Thorlabs...
- Page 26 Raman Spectroscopy Bundle Chapter 4: System Setup Alternative RSBR1(/M) Mounting Options The orientation of the RSBR1(/M) may be adapted to the needs of the experiment. Warning Whenever the RSBR1(/M) main unit is not in the upright position, the light shield cover can no longer be used.
-
Page 27: Mounting Rsbc1(/M)
For the correct distance, position the locking ring on the baffle assembly such that the distance between the thick SM1 internal thread end of the baffle assembly and the locking ring measures 17.6 mm (6.93"). Page 20 Rev: 1.2, 07-Mar-2023 © 2023 Thorlabs... - Page 28 Raman Spectroscopy Bundle Chapter 4: System Setup RSBC1(/M) Baffle Assembly 13.Position the connecting ring accordingly. 14.Secure the setup by tightening the locking ring. 15.Secure the mounting post on the RSBC1(/M) main body on the breadboard using the clamp- ing fork. Attention Do not to exert any force on the input of RSB1(/M).
-
Page 29: Mounting Rsbf2
RSB1(/M) base unit all the way to the end stop. 5. The flat edge of the RSBF2 with the engraving should now be parallel to the RSB1(/M) base unit surface. In this position, the rectangular beam profile emitted from the RSBF2 should match the rectanglular input aperture of the RSB1(/M). -
Page 30: Mounting Cage Systems
Chapter 4: System Setup In case the alignment does not match, loosen locking ring and rotate the RSBF2 main body until you reach good alignment. Secure the position with the looking ring. Attention Do not to put any pressure on the input of the RSB1(/M). -
Page 31: Mounting On The Sm1.5 External Thread Of Rsb1(/M)
RSBC1(/M) was built in 2023 or later. RSBR1(/M) and RSBC1(/M) built in 2021 or 2022 will require a different bandpass filter for using a shorter wavelength excitation. For this, please contact techsupport@thorlabs.com. Please be aware that the detection range in wavenumbers ) changes when using a different excitation wavelength while the spectral range of the spectrograph RSB1(/M) remains unchanged. -
Page 32: Laser
If using an alternative laser, it must meet the specifications described in the chapter Laser Re- quirements. 4.3.1.1 Alternative Excitation Wavelength Due to the modular design, it is possible to modify the Thorlabs Raman bundle to target the complementary high-wavenumber region from 2400 cm to 3800 cm by choosing an excita- tion wavelength of 680 nm. -
Page 33: Laser Driver
Please see the drawings for CLD1015 online. This ar- mored fiber patch cable is then connected to the FC/PC connector of the Thorlabs front end. Please coil up the fiber pigtail of the laser and store it within the laser compartment of the CLD1015. -
Page 34: Connecting The Rsb1(/M) To The Pc
Raman Spectroscopy Bundle Chapter 4: System Setup Note We recommend using a power meter, such as the Thorlabs PM400K2, to check the laser driver setting. 4.4 Connecting the RSB1(/M) to the PC After installing the OSA Raman Software on the PC, connect the camera to the PC using the provided USB 3.0 high-speed cable to a USB 3.0 port of the PC. -
Page 35: Operating Instructions
· Note The instructions are given based on a Raman system consisting of a Thorlabs RSB1(/M) bundle with an RSBR1(/M) or RSBC1(/M) front end, using a Thorlabs CLD1015 laser driver and the Thorlabs FPV785M laser. Attention The safety of any system assembled by the customer is the responsibility of the customer. In particular, lasers used in this application likely emit high-power light which may be harmful. -
Page 36: Software And Installation
Thorlabs Raman bundle website: https://www.thorlabs.com/newgrouppage9.cfm?objectgroup_id=14241 Always use the latest OSA Raman Software version. Note Please be aware that the general OSA Software from the Thorlabs website does not support the Raman bundle. Please ensure that the PC matches the requirements stated above. - Page 37 Chapter 5: Operating Instructions After the software installation has finished, connect the RSB1(/M) to an available USB 3.0 port on the PC. Please use the cable that is included with the RSB1(/M) Base Unit (Thorlabs Item # USB3-MBA-118 for Scientific Cameras).
-
Page 38: Raman Measurements With The Osa Raman Software
Chapter 5: Operating Instructions 5.3 Raman Measurements with the OSA Raman Software This chapter described how to acquire Raman spectra with the Thorlabs OSA Raman Software. For general instructions to the Thorlabs OSA Raman Software, please see the chapter "OSA Raman Software: General Instructions"... -
Page 39: Software Configuration Procedure
Before starting experimental Raman measurements, the Thorlabs OSA Raman Software needs to be configured with appropriate settings. Please adjust the settings in the following order: 1. After installing the Thorlabs OSA Raman Software to the PC, connect the RSB1(/M) to the PC. -
Page 40: Settings
Raman Spectroscopy Bundle Chapter 5: Operating Instructions 5.3.3 Settings The Thorlabs OSA Raman Software allows critical parameters for Raman spectroscopy to be set. This chapter describes where in the OSA Raman Software the critical parameters can be adjusted as well as meaningful parameter values. - Page 41 Raman Spectroscopy Bundle Chapter 5: Operating Instructions Open via Devices Icon: Open via Settings Tab in the main menu: Page 34 Rev: 1.2, 07-Mar-2023 © 2023 Thorlabs...
-
Page 42: Info Panel
Raman Spectroscopy Bundle Chapter 5: Operating Instructions 5.3.3.1 Info Panel The "Info" panel displays the status information of the device. Connection: The bullet icon color indicates whether the camera is connected to the PC. Gray: No device connected in sofware. Green: The device is connected to PC and recognized by the software. -
Page 43: Main Panel
Control: System Calibration and data display units (Primary scale of spectrum) Advanced Control: Spectrum post-processing steps (only visible via Settings tab) · Please refer to the respective chapters linked above for additional instructions on the settings. Page 36 Rev: 1.2, 07-Mar-2023 © 2023 Thorlabs... - Page 44 Raman Spectroscopy Bundle Chapter 5: Operating Instructions 5.3.3.2.1 Spectrum Control The panel "Spectrum Control" shown below on the right side provides the interface to load in- strument calibration data, set display parameters and to set the precise wavelength in air of the excitation laser.
- Page 45 The Raman-scattered light passes through the coded matrix with defined slits at the input aper- ture of the RSB1(/M). This leads to exposure of certain pixels in the camera. The Thorlabs OSA Raman Software then calculates the Raman spectrum based on the acquired image and the corresponding information about the position in the coded matrix.
- Page 46 Raman Spectroscopy Bundle Chapter 5: Operating Instructions 5.3.3.2.2 Acquisition Control Attention Adjust the integration time, the analog gain and the black level only after loading the calibration data. After these, determine the precise laser wavelength. Integration Time [ms] This parameter sets the duration of data acquisition for a single measurement in ms. The integ- ration time at single exposure equals the exposure time defined for other systems.
- Page 47 This panel is only visible when opening the Settings dialog via the Settings Tab in the main menu. To deactivate the automatic smoothing of the spectra, select "Do not smooth spectrum". To deactivate the amplitude calibration based on the NIST SRM2241 standard, select "Do not apply amplitude correction". Page 40 Rev: 1.2, 07-Mar-2023 © 2023 Thorlabs...
-
Page 48: Dark Image
5.3.4 System Calibration In order to gain meaningful spectra from a Raman spectra using the Thorlabs Raman bundle, a two-step calibration to deliver readings in nanometers with a calibrated amplitude is performed at the factory (Calibration at the Factory). - Page 49 , which stays in the molecule vibrating after the scattering process. This is described in: E = E - E with E = hf (Planck-Einstein relation)... = 6.62607015 x 10 incoming photon frequency [Hz] Page 42 Rev: 1.2, 07-Mar-2023 © 2023 Thorlabs...
- Page 50 For this calculation Thorlabs provides an .XLS worksheet supplied with the Thorlabs OSA Raman software. The .XLS worksheet is accessible via the...
- Page 51 Step-by-Step Procedure 1. Set up the RSB1(/M) Raman bundle with a Thorlabs front end as described above with the laser attached.
- Page 52 Raman Spectroscopy Bundle Chapter 5: Operating Instructions 4. Ensure that the display mode of the software is also set to be in nm (air) in the top ribbon: 5. Ensure that the laser is switched off and insert the Polystyrene block (RPB) into the cuvette holder of the RSBC1(/M) or place the Polystyrene chip (RPC) under the RSBR1(/M) reflect- ive front end and reattach the stray-light shield.
- Page 53 Select a region where the peaks are identified correctly by moving the horizontal and vertical bars – the determined wavelength, peak level and FWHM get listed below the spectrum automatically. Page 46 Rev: 1.2, 07-Mar-2023 © 2023 Thorlabs...
- Page 54 The list of peaks can now be exported into a CSV file. To do so, right click to get to the con- textual menu. 10. Open the supplied EXCEL sheet “Thorlabs Raman Polystyrene Calibration.xlsx” and ensure that the macros functionality is enabled (otherwise the fit algorithm will not be executable).
- Page 55 In case the value deviates more, this might due to different reasons: a dusty Polystyrene chip, Polystyrene chip is not in the focal plane, or instability of the laser. If the problem per- sists, please contact Thorlabs. 11. Switch back to the OSA Raman Software and enter the determined wavelength value from cell "Laser Wavelength Solver [nm]"...
-
Page 56: Export Data
Raman Spectroscopy Bundle Chapter 5: Operating Instructions 12. Repeat step 3 and 4 to switch to the energy scale (cm ) for acquisition and display. 13. Acquire a new spectrum using the “Single” button as in step 8 and the x-axis of the Polystyrene spectrum should now be in cm . -
Page 57: Experimental Measurements
The excitation laser may be class 3 or even 4 and poses a risk to eyes and skin. Follow the safety procedures, use safety gear and get in touch with your laser safety officer. Page 50 Rev: 1.2, 07-Mar-2023 © 2023 Thorlabs... -
Page 58: Sample Measurement
Raman Spectroscopy Bundle Chapter 5: Operating Instructions 12. Start a measurement by clicking SINGLE for a single integration time run or REPEAT for continuous acquisition. 13. The resulting spectrum should be similar to the spectrum shown below: 14. If the Raman spectrum largely differs from the plot shown above, ensure proper system setup, laser and camera calibration. -
Page 59: Compatible Cuvettes For Rsbc1(/M)
In that case, the material gets illuminated by the laser within the field of view of the emission window. Page 52 Rev: 1.2, 07-Mar-2023 © 2023 Thorlabs... -
Page 60: Operating Principle
Raman Spectroscopy Bundle Chapter 6: Operating Principle 6 Operating Principle Raman Spectroscopy Raman Spectroscopy is a well established technique for the molecular characterization of chemical substances in solid, powder, liquids, or gases. It is based on the detection and ana- lysis of Raman Scattering emitted from a sample upon exposure to monochromatic light.When a photon interacts with a molecule, the photon can either provide energy to excite one or more of the molecule's vibrational modes or the photon can acquire energy from the molecule's ex-... -
Page 61: Analysis Of Raman Spectra
The photon energy and molecular vibration frequency are related via the Planck-Einstein rela- tion: E = hf (Planck-Einstein relation) with 6.62607015 x 10 -34 Js, incoming photon frequency [Hz] with = speed of light = wavelength in air Page 54 Rev: 1.2, 07-Mar-2023 © 2023 Thorlabs... -
Page 62: Acquisition Of Raman Spectra
Raman peaks may also vary depending on the excitation wavelength range. Proper wavenumber scaling, as done in the Thorlabs factory, is therefore important from the point of measurement calibration. The imaging spectrograph is calibrated through wavelength dispersion only. - Page 63 Further, the Thorlabs front ends allow for the propagation of signal from larger volumes to the RSB1(/M) spectrograph. This allows more photons to be analyzed.
- Page 64 It is critical to choose this dispersive optical element to suit the experimental setup. Thorlabs RSBx1(/M) Bundle Features: The core of the Thorlabs RSB1(/M) is an imaging spectrograph for recording spectra in the spectral range from 815 nm to 915 nm, which fit Raman shifts with wavenumbers ranging from 500 cm to 1800 cm when using a 785 nm excitation laser source.
-
Page 65: Coded-Aperture Raman Spectroscopy
Chapter 6: Operating Principle 6.3 Coded-Aperture Raman Spectroscopy The Thorlabs Raman bundle is based on an imaging spectrometer that features a diffraction grating as the dispersive element. Traditional spectrographs of this design face a trade-off between the desired spectral resolution and the achievable light throughput. This is because the dispersive element produces spectrally separable images of the same slit image. - Page 66 Raman Spectroscopy Bundle Chapter 6: Operating Principle ment. In case of the RSB1(/M) Thorlabs Raman Base Unit this is a Hadamard mask of order 64 with a matrix element size of 36 mm x 36 mm. The coded aperture increases the light throughput without damaging the system resolution. The sepctral resolution is defined by the size of the single mask element.
-
Page 67: Parameters Affecting Spectra
Thorlabs OSA Raman Software. Please note that the high light throughput of the Raman bundle leads to shorter exposure times compared to traditional instruments. The saturation indicator in the settings bar of the Thorlabs OSA Raman Software shows when camera pixels are saturated... - Page 68 This background level is even modulated by amplitude correction. Please note that for the Thorlabs Raman bundle this subtraction will not entirely eliminate the flat background level, because residuals of Poisson noise are still accountable after averaging of hundreds of thousands of pixels as it is done with the large Coded-Aperture.
- Page 69 Ra- man scattering response. Therefore, a Coded-Aperture Raman Spectrosocpy Systems, like the Thorlabs Raman Bundle RSB1(/M) are more powerful in the analysis of complex mixtures com- pared to convetnional slit systems.
- Page 70 Raman Spectroscopy Bundle Chapter 6: Operating Principle Note Because the sampling volume of Coded-Aperture Raman Spectrosocpy Systems is rel- atively large, the spatial resolution of the Raman analysis in these systems is limited when com- pared to slit Raman Spectroscopy systems. Excitation Power Because the number of scattered Raman photons per time is linearly proportional to the intens- ity of the excitation source, it is critical to use enough laser power.
-
Page 71: Maintenance And Service
Ø The sample might not be in the focal plane. Please adjust the height of the sample table. Ø The laser power reaching the sample might be too weak. Please check the integrity of the optical fiber or the laser driver settings. Page 64 Rev: 1.2, 07-Mar-2023 © 2023 Thorlabs... - Page 72 Ø The software version might not support the RSB1(/M) Base Unit. Please be ensure to use the OSA Raman Software provided for download on the Thorlabs Raman website. Ø The PC may have been switched off while the camera was still active. Upon restarting the PC, the camera may not automatically be recognized.
- Page 73 Ø This is because of the constant presence of intrinsic noise. · Thorlabs OSA Raman Software cannot Find any Instrument Ø If the instrument was connected after the Thorlabs OSA Raman Software was started, it will not automatically detect the instrument. Press the button “Connect Devices” found under “Sweep”...
- Page 74 Raman Spectroscopy Bundle Chapter 7: Maintenance and Service Raman Bundle in the "Device Manager" List · After Starting the Measurement the Screen does not Update. Ø Start by checking your settings Ø Make sure at least one trace is set to “Write” or “Average”; see section Trace Update Op- tions.
-
Page 75: Appendix
RSB1/M and RSB1 Base Unit, RSBR1/M and RSBR1 reflect- ive front end, RSBC1/M and RSBC1 cuvette front end, RSBF2 Fiber Input Adapter Fiber Input Adapter, and RSBA1 adapter for cage mounting on RSB1(/M) Base Unit below. Page 68 Rev: 1.2, 07-Mar-2023... -
Page 76: Rsb1/M And Rsb1 Technical Data
Raman Spectroscopy Bundle Chapter 8: Appendix 8.1.1 RSB1/M and RSB1 Technical Data All technical data are valid at 23 ± 5 °C and 45 ± 15% rel. humidity (non-condensing). RSB1/M RSB1 Item # Optical Specifications Wavelength Detection Range (Wavelength) 815 nm to 915 nm Spectral Resolution (FWHM) (Wavelength) <0.65 nm Spectral Accuracy (Wavelength) -
Page 77: Rsb1/M And Rsb1 Dimensions
Raman Spectroscopy Bundle Chapter 8: Appendix 8.1.1.1 RSB1/M and RSB1 Dimensions RSB1/M Page 70 Rev: 1.2, 07-Mar-2023 © 2023 Thorlabs... - Page 78 Raman Spectroscopy Bundle Chapter 8: Appendix RSB1 Page 71 MTN022733-D02...
-
Page 79: Rsbr1/M And Rsbr1 Technical Data
2021 or 2022 have a single band 785 nm ± 0.6 nm bandpass filter instead and are not suitable for excitation wavelength lower than 785 nm. Please contact Thorlabs in case you plan to use 680 nm to 785 nm excitation with a 2021 or a 2022 system. -
Page 80: Rsbr1/M And Rsbr1 Dimensions
Raman Spectroscopy Bundle Chapter 8: Appendix 8.1.2.1 RSBR1/M and RSBR1 Dimensions RSBR1/M Please see footnotes a) and b) in the RSBR1(/M) specifications for devices built before 2023. Page 73 MTN022733-D02... - Page 81 Raman Spectroscopy Bundle Chapter 8: Appendix RSBR1 Please see footnote a) and b) in the RSBR1(/M) specifications for devices built before 2023. Page 74 Rev: 1.2, 07-Mar-2023 © 2023 Thorlabs...
-
Page 82: Rsbc1/M And Rsbc1 Technical Data
2021 or 2022 have a single band 785 nm ± 0.6 nm bandpass filter instead and are not suitable for excitation wavelength lower than 785 nm. Please contact Thorlabs in case you plan to use 680 nm to 785 nm excitation with a 2021 or a 2022 system. -
Page 83: Rsbc1/M And Rsbc1 Dimensions
Raman Spectroscopy Bundle Chapter 8: Appendix 8.1.3.1 RSBC1/M and RSBC1 Dimensions RSBC1/M Please see footnote a) and b) in the RSBC1(/M) specifications for devices built before 2023. Page 76 Rev: 1.2, 07-Mar-2023 © 2023 Thorlabs... - Page 84 Raman Spectroscopy Bundle Chapter 8: Appendix RSBC1 Please see footnote a) and b) in the RSBC1(/M) specifications for devices built before 2023. Page 77 MTN022733-D02...
-
Page 85: Rsbf2 Technical Data
Numerical Aperture (Max) M93L01 (FT1500UMT), Recommended Fibers M29L01 (FT600EMT) General Specifications Exclusively Designed for the Thorlabs Ra- Device Compatibility man Spectroscopy Bundle RSB1(/M) Interface to RSB1(/M) Base Unit SM1 (1.035"-40) Internal Thread Ø 31.8 mm x 48.9 mm Dimensions (Ø 1.25'' x 1.93'') Overall Weight 0.055 kg... -
Page 86: Rsbf2 Dimensions
Raman Spectroscopy Bundle Chapter 8: Appendix 8.1.4.1 RSBF2 Dimensions Page 79 MTN022733-D02... -
Page 87: Rsba1 Technical Data
Raman Spectroscopy Bundle Chapter 8: Appendix 8.1.5 RSBA1 Technical Data 8.1.5.1 RSBA1 Dimensions Page 80 Rev: 1.2, 07-Mar-2023 © 2023 Thorlabs... -
Page 88: Thorlabs Raman Bundle Technical Data
This section contains specifications for the Raman bundle consisting of the RSB1(/M) Base Unit and a Thorlabs Raman front end, either RSBR1(/M) or RSBC1(/M). Note The specifications do not apply to the RSBF2 fiber input adapter. Specifications Raman Spectroscopy Bundle with RSBR1(/M) or RSBC1(/M) Exposure Time: Technical Limitations 0.036 ms (Min) to 22795 s (Max) in 0.022 ms Increments... -
Page 89: Technical Data Explained
Since relative peak heights are an additional source of information for substance identification, especially in identifying components of a mixture, all Thorlabs RSB1(/M) spectrometers are amplitude corrected at the factory, relying on a certified standard (NIST SRM2241). - Page 90 Raman Spectroscopy Bundle Chapter 8: Appendix The main panel in figure below shows the results of the SNR characterization. The bullets are the median SNR from 16 spectra and the colors represent six different units tested. The grey area covers the 3σ confidence interval, so the SNR is expected to be within this range in 99.7% of the cases for any RSB1(/M) spectrometer.
-
Page 91: Spectral Accuracy And Spectral Resolution
500 cm , and 1.8 cm at 1800 cm Note that spectral accuracy does not depend on wavelength, but in going to cm , accuracy will be higher in the lower energy range. Page 84 Rev: 1.2, 07-Mar-2023 © 2023 Thorlabs... - Page 92 RSB1(/M), with an average value of 0.54 nm. For the purpose of the Thorlabs Raman bundle, Thorlabs specifies spectral resolution to be better than 0.65 nm, again deduced from the 3σ...
-
Page 93: Amplitude Correction
Raman peak heights. Camera Quantum Efficiency Grating Efficiency Averaged Over Polarizations All Thorlabs RSB1(/M) spectrometers are amplitude corrected using a certified standard (NIST SRM2241) during factory calibration. This standard defines a polynomial with relative, quantitat- ive fluorescence intensity to be expected under 785 nm excitation, matching the laser wavelength for RSB1(/M) Raman measurements. - Page 94 ) which leads to an (unavoidable) decrease in SNR over the spectral range of the RSB1(/M). For the Thorlabs Raman bundle, NIST amplitude correction is enabled by default. To disable amplitude correction, place a check mark next to ‘Do not apply amplitude correction’ in vanced Mode Settings ->...
-
Page 95: List Of Acronyms
2) Static two-dimensional aperture coding for multimodal, multiplex spectroscopy” by Michael E. Gehm, Scott T. McCain, Nikos P. Pitsianis, David J. Brady, Prasant Potuluri, and Michael E. Sullivan – Applied Optics May 2006, Vol. 45, No. 13 Page 88 Rev: 1.2, 07-Mar-2023 © 2023 Thorlabs... - Page 96 Raman Spectroscopy Bundle Chapter 8: Appendix McCamant, D. W., Kukura, P., & Mathies, R. A. (2003). Femtosecond Broadband Stimulated Raman: A New Approach for High-Performance Vibrational Spectroscopy. Applied Spectroscopy, 1317-1323. doi:10.1366/000370203322554455 Page 89 MTN022733-D02...
-
Page 97: Application Note Polarization Dependent Raman Spectroscopy
³ 0.75 is not completely symmetric and is called a depolarized band. This application note describes how to use the Thorlabs Raman bundle to investigate polariza- tion dependent Raman scattering. Polarization Dependent Raman Spectroscopy Using the Thorlabs Raman Bundle with the... - Page 98 This leads to increased background and noise levels within the spectral range of the base unit. Therefore, in the 180° transmission setup, it is recommended to use additional excit- ation wavelength filtering in the Raman scattered light path, e.g. using Thorlabs item # FEL0800 or # FELH0800.
-
Page 99: Optimizing Raman Signal Via Collimator Rotation
8.4.1 Optimizing Raman Signal via Collimator Rotation The starting point of this configuration is the Thorlabs Raman Base Unit RSB1(/M) with front end RSBC1(/M) as configured at the factory and set up as described in the manual, and a laser source fed to the FC/PC port of the RSBC1(/M) via a multimode fiber. -
Page 100: Including Polarization Optics In The Excitation Path
Raman Spectroscopy Bundle Chapter 8: Appendix Isopropanol Raman spectra for various orientations of the input fiber around z-axis (via rotation of collimator with attached fiber, RSBC1 as delivered). Note that the horizontal axis is in nm. 8.4.2 Including Polarization Optics in the Excitation Path As described above, the RSBC1(/M) can be adapted to measure polarization dependent Ra- man. - Page 101 ADAFC1 mating sleeve within the driver and an armored fiber (e.g. MR16L01) for connecting the Thorlabs RSBx1 Raman Spectroscopy bundle and laser. However, in these measurements we wanted to preserve as much of the laser’s polarization and thus skipped the armored fiber.
-
Page 102: Including Polarization Optics In The Raman Scattering Path
1: d = 17.6 mm (6 mm), baffle 2: d = 14.2 mm (18 mm), and baffle 3: d = 9 mm (33 mm). Please contact Thorlabs in case of questions. 5. Place and secure polarization optics and front end without the baffle assembly at the input port of the base unit as shown in the following picture. -
Page 103: References
McCamant, D. W., Kukura, P., & Mathies, R. A. (2003). Femtosecond Broadband Stimulated Raman: A New Approach for High-Performance Vibrational Spectroscopy. Applied Spectroscopy, 1317- 1323. doi:10.1366/000370203322554455 Tuschel, D. (2014). Practical Group Theory and Raman Spectroscopy, Part II: Application of Polarization. Spectroscopy. Page 96 Rev: 1.2, 07-Mar-2023 © 2023 Thorlabs... -
Page 104: Osa Raman Software: General Instructions
The below chapter gives general instruction to the OSA Raman Software. 8.5.1 Interface Overview When the Thorlabs OSA Raman Software is first started, the main window shown below is composed of five areas: · The Main menu, containing the command buttons ·... -
Page 105: Customizing The Display
A locked axis cannot be dragged or zoomed using the mouse or keyboard in order to prevent an accidental change of the data display range. Axis Options Dialog Opened for the Horizontal Axis Page 98 Rev: 1.2, 07-Mar-2023 © 2023 Thorlabs... -
Page 106: Zooming And Scrolling The Vertical Axis
Raman Spectroscopy Bundle Chapter 8: Appendix 8.5.2.2 Zooming and Scrolling the Vertical Axis The primary vertical axis can be zoomed and scrolled by using the slide bar displayed to the left of the vertical axis. In the same way, the secondary vertical axis can be zoomed and scrolled using the slide bar displayed to the right on the secondary vertical axis (this axis is only visible when a trace is plotted on it –... -
Page 107: Displaying The Secondary Vertical Axis
8.5.2.5 Displaying the Secondary Vertical Axis In the Thorlabs OSA Raman Software the traces can be shown on either the primary axis with its labels and units displayed to the left of the graph, or on the secondary axis with its labels and units displayed to the right of the graph. -
Page 108: Hiding The Menus And Full Screen Mode
Displaying Data on Both the Primary and Secondary Vertical Axes 8.5.2.6 Hiding the Menus and Full Screen Mode There are two buttons located in the top right corner of the main menu, close to the Thorlabs logo as shown below. -
Page 109: Displaying A Split View
(e.g., ‘SO_4^{3-}’ will produce SO ). To insert a Greek character, type ‘\’ (backslash) followed by the name of the letter (e.g., ‘\mu’ will produce µ). Page 102 Rev: 1.2, 07-Mar-2023 © 2023 Thorlabs... -
Page 110: Dark Room Mode
Raman Spectroscopy Bundle Chapter 8: Appendix The name of the trace and the comment of the trace can also be modified through the Trace info dialog, as described in section “Viewing properties of a trace”. Show a Legend in the Data Display 8.5.2.9 Dark Room Mode If the screen is too bright, the graph background and grid color can be easily changed by click- ing the “Dark Room Mode”... -
Page 111: Acquiring Data
8.5.3.1 Finding the Spectrometer When the software starts it will automatically detect and read the properties of all Thorlabs spectrometers connected to the computer through USB. If the program was started before the instrument was connected or powered-on, the software will not be able to find the instrument. -
Page 112: Acquiring A Single Spectrum
Raman Spectroscopy Bundle Chapter 8: Appendix Devices Dialog Listing All Currently Connected Devices To acquire data from several connected devices simultaneously, start by setting up which trace should receive data from which device. This is done in the trace menu, which is opened by clicking the trace icon. -
Page 113: Repeated Measurements
In the Thorlabs OSA Raman Software, spectra are averaged as a rolling average, meaning that the screen will be updated for each new spectrum that is collected and the average of all the measured spectra will be displayed on the screen. -
Page 114: Moving Markers
Raman Spectroscopy Bundle Chapter 8: Appendix The movable markers can be used to inspect the value of the data at different positions, change the displayed area of the graph (see sections "Zooming and Scrolling the Horizontal Axis" and "Zooming and Scrolling the Vertical Axis"), or place fixed markers. -
Page 115: Fixed Markers
Movable Markers 8.5.5 Fixed Markers The Thorlabs OSA Raman Software can handle up to 2048 fixed markers. A fixed marker has a fixed horizontal position and is connected to a single trace (not necessarily the active trace) and will track the value of its trace at the given position. Fixed markers are identified by a number. -
Page 116: Automatically Mark Peaks
Raman Spectroscopy Bundle Chapter 8: Appendix 8.5.5.2 Automatically Mark Peaks Pressing the button “Mark Peaks” will add one fixed marker to each peak in the currently active trace that has previously been automatically detected with the Peak track analysis tool (see section "Peak Track"). -
Page 117: Working With Data In Traces
8.5.6 Working with Data in Traces The collected spectra are stored in what are called “traces.” The Thorlabs OSA Raman Soft- ware can handle up to 26 traces labeled from A to Z for spectra. The controls for the traces are found in the area between the data display area and the main menu. - Page 118 Raman Spectroscopy Bundle Chapter 8: Appendix · Fix: Traces with this option will not be updated at the next acquisition. · Average: Traces with this option will be updated at the next acquisition as a rolling aver- age of the data already existing in the trace and the newly acquired data. It is possible to let the running average stop updating once the desired number of spectra has been col- lected by selecting the option “Average and Stop.”...
-
Page 119: User-Defined Update Options
“Math” under the “Math” main menu, see section “Math operations”. Calculation of User-Defined Function From Measured Spectra in a Separate Trace and Scale Page 112 Rev: 1.2, 07-Mar-2023 © 2023 Thorlabs... -
Page 120: Viewing Properties Of A Trace
Raman Spectroscopy Bundle Chapter 8: Appendix 8.5.6.4 Viewing Properties of a Trace To see the properties of a trace, click on the icon or the label of the trace that you want to in- spect, and select the menu item “View Info.” This will open a window displaying basic informa- tion of the trace, such as the serial number of the OSA Raman Software, date and time of the acquisition, and the settings that were used during the acquisition. -
Page 121: Reordering Traces
If the Trace was result of calculation, the related formula will be up- dated automatically. 8.5.6.6 Math Operations Thorlabs OSA Raman Software provides a range of pre-configured tools for post-processing of the spectra stored in traces, found under main menu "Math". - Page 122 Raman Spectroscopy Bundle Chapter 8: Appendix The calculation will be performed when the “Calculate” button is clicked or by pressing “Enter” on the keyboard. If the result of the calculation is a trace, it will be stored in the trace indicated by the drop-down menu in the dialog box.
- Page 123 Smooth: Performs a smoothing operation on a trace or a region thereof. A dialog box will open, in which it is possible to select the smoothing algorithm to use and to set the parameters for the smoothing as well as the input/output traces, see Figure Smooth Operation Dialog Page 116 Rev: 1.2, 07-Mar-2023 © 2023 Thorlabs...
- Page 124 Raman Spectroscopy Bundle Chapter 8: Appendix Curve fit: Fits a mathematical curve to a trace or a region thereof. The Curve Fit dialog box will open, in which the fit settings and intput/output traces can be specified. Available math func- tions are: Gaussian, Lorentzian, and polynomial, see section "Functional traces".
- Page 125 If the original traces are not overlapping, then stitched values between the defined ranges will be set to zero. Page 118 Rev: 1.2, 07-Mar-2023 © 2023 Thorlabs...
-
Page 126: Functional Traces (Traces Defined By A Function)
8.5.7 Saving and Loading Data The Thorlabs OSA Raman Software can read and write the following spectral file formats: · Thorlabs OSA Raman Software Spectrum file format (.spf2x): Native file format for the general Thorlabs OSA Software. Please note, that only the Raman Edition of the OSA Software is compatible with Raman measurements. -
Page 127: Saving Spectral Data
Software Spectrum File format .spf2x or as raw data in ASCII file format. "File" Main Menu It is also possible to export the current data display into an image, using button “Save Image”. "Save Image" Dialog Page 120 Rev: 1.2, 07-Mar-2023 © 2023 Thorlabs... -
Page 128: Loading Spectral Data
8.5.8 Analyzing data The Thorlabs OSA Raman Software contains a number of analysis tools, each of which ana- lyzes one aspect of the data from the spectrometer. The result of each analysis is displayed in a panel below the main data display area, or in a separate floating window. -
Page 129: Displayed Range And Threshold
If both vertical markers 1 and 2 are enabled (see section “Movable Markers”), then additional range controls are available – see second screen shot below – allowing automatically adjust the range to values of that Markers. Page 122 Rev: 1.2, 07-Mar-2023 © 2023 Thorlabs... -
Page 130: Peak Track
Raman Spectroscopy Bundle Chapter 8: Appendix Range Lines Settings Range Lines Linked to Markers 8.5.8.3 Peak Track Through the Peak Track analysis tool it is possible to track the position, amplitude, and width of peaks in the spectrum over time. The maximum number of peaks that can be simultaneously tracked is 2048. - Page 131 · Centroid level: The value of the trace at the center of mass of the peak, defined as ex- plained above. · Peak location: The x-axis location of the maximum value of the peak. · Peak level: The maximum peak value. Page 124 Rev: 1.2, 07-Mar-2023 © 2023 Thorlabs...
-
Page 132: Valley Track
Raman Spectroscopy Bundle Chapter 8: Appendix · Width: The width of the peak at “Min peak height” dB below the maximum value. · FWHM: The full width of the peak at half of its maximum value. · Left Half Width: The x-axis distance from the maximum peak value to half of the maximum peak value, starting at the Peak Location and going in the direction of decreasing x. - Page 133 The data reported for each valley have corresponding meaning as they are defined for columns of Peak track analysis window (see section “Peak Track”). Valley Track Tool with Range and Threshold Lines Page 126 Rev: 1.2, 07-Mar-2023 © 2023 Thorlabs...
-
Page 134: Statistics Analysis
Raman Spectroscopy Bundle Chapter 8: Appendix 8.5.8.5 Statistics Analysis Statistics analysis allows several statistical parameters of a trace to be analyzed and tracked over time over a user-specified x-axis interval. It is possible to statistically analyze raw data (i.e., live spectra)and arbitrary user-defined traces (e.g., traces composed from algebraic ma- nipulations of other traces). -
Page 135: Curve Fit
Defining the function to fit to the trace The fitting function is defined using the “Function Builder” dialog box which can be opened by clicking on the “Edit Function” button in the Curve Fit Tool window. Page 128 Rev: 1.2, 07-Mar-2023 © 2023 Thorlabs... - Page 136 Raman Spectroscopy Bundle Chapter 8: Appendix This dialog box is composed of three parts. The top contains two buttons that adds, modifies, or deletes function terms, the middle section displays the function used to fit the trace (labeled as the “Final Function”), and the bottom part displays the parameters of the currently selected function term.
- Page 137 · Degrees of freedom: This is the length of the fitted data set minus the number of fitted parameters. · RMSE (root mean square error): Calculated as the square root of the RSS divided by the degrees of freedom. Page 130 Rev: 1.2, 07-Mar-2023 © 2023 Thorlabs...
-
Page 138: Baseline Correction
Raman Spectroscopy Bundle Chapter 8: Appendix 8.5.8.7 Baseline Correction As shown below, the Baseline correction function removes baseline profile from an acquired spectrum. Baseline Correction Window To perform a baseline correction, click the “Baseline” button in the “Analysis” menu. The Baseline correction dialog box, which allows you to adjust the baseline correction while viewing the results of your adjustments in real time, will appear. -
Page 139: Keyboard Shortcuts
· Alt+F: Set the active trace to “Fix” · Alt+A: Opens the Average options dialog when it is possible to set the active trace to “Average” · Delete: Clear the currently active trace Page 132 Rev: 1.2, 07-Mar-2023 © 2023 Thorlabs... -
Page 140: General Osa Raman Settings
Raman Spectroscopy Bundle Chapter 8: Appendix 8.5.10 General OSA Raman Settings 8.5.10.1 Basic Settings Pressing the “Settings” button in the main menu will open the Settings dialog. By default, the Settings dialog box will start in “Basic mode.” To see more advanced settings, press the “Switch to Advanced Mode”... - Page 141 The maximum value is 2048, and the default value is 200. Please note that higher values here can degrade the performance of the software, since lower-intensity peaks are more difficult to find. Page 134 Rev: 1.2, 07-Mar-2023 © 2023 Thorlabs...
-
Page 142: Saving And Loading Settings
Reset action does not destroy the instrument initialization and Calibration data. 8.5.10.2 Saving and Loading Settings When the Thorlabs OSA Raman Software closes, it will store the currently used settings to file and restore them during the next startup. These data are located in the User Profile’ folder “Ad- dData”:... - Page 143 Fig48). This allows for the inspection of the settings behind a saved name before loading the settings. It is also possible to rename or delete a stored parameter setting from the menu that is displayed when right clicking on any element on the list. Page 136 Rev: 1.2, 07-Mar-2023 © 2023 Thorlabs...
- Page 144 Raman Spectroscopy Bundle Chapter 8: Appendix Load Acquisition Settings Dialog, Allowing for Inspection of Settings Prior to Loading Page 137 MTN022733-D02...
-
Page 145: Safety
If necessary, ask for replacement packaging. Refer servicing to qualified personnel! Changes to this device cannot be made nor may components not supplied by Thorlabs be used without written consent from Thorlabs. Users that change or modify the product described in this manual in a way not expressly ap- proved by Thorlabs (party responsible for compliance) could void the user’s authority to operate... -
Page 146: Return Of Devices
Thorlabs warrants material and production of the Raman Spectroscopy Bundle for a period of 24 months starting with the date of shipment in accordance with and subject to the terms and conditions set forth in Thorlabs’ General Terms and Conditions of Sale which can be found at: General Terms and Conditions: https://www.thorlabs.com/Images/PDF/LG-PO-001_Thorlabs_terms_and_%20agreements.pdf... -
Page 147: Thorlabs Worldwide Contacts - Weee Policy
EC, and are not dissembled or contaminated. Contact Thorlabs for more informa- tion. Waste treatment is your own responsibility. “End of life” units must be returned to Thorlabs or handed to a company specializing in waste recovery. Do not dispose of the unit in a litter bin or at a public waste disposal site. - Page 148 www.thorlabs.com...
Need help?
Do you have a question about the RSBF2 and is the answer not in the manual?
Questions and answers