Table of Contents
Advertisement
Quick Links
Advertisement
Table of Contents

Related Manuals for Teledyne HDO6000B


Summary of Contents for Teledyne HDO6000B
- Page 1 Operator's Manual HDO6000B High Definition Oscilloscopes...
- Page 2 Resale or unauthorized duplication of Teledyne LeCroy publications is strictly prohibited. Teledyne LeCroy is a trademark of Teledyne LeCroy, Inc., Inc. Other product or brand names are trademarks or requested trademarks of their respective holders. Information in this publication supersedes all earlier versions. Specifications are subject to change without notice.
-
Page 3: Table Of Contents
Contents About This Manual Safety Symbols Precautions Operating Environment Measuring Terminal Ratings (C1-C4 and Ext) Cooling Cleaning Power Oscilloscope Overview and Set Up Front of Oscilloscope Side of Oscilloscope Back of Oscilloscope Front Panel Signal Interfaces Probes Powering On/Off Language Selection Connecting to Other Devices/Systems MAUI User Interface Automation... - Page 4 HDO6000B High Definition Oscilloscopes Operator's Manual List of Standard Measurements Parameter Math Using Web Editor Fast MultiWave Port Using Histograms Using Trends Using Tracks Track vs. Trend EMC Pulse Parameter Software Package Math Math Function Set Up Math Dialog List of Standard Math Operators...
- Page 5 Maintenance Restart/Reboot Instrument Restore Default Setup Changing Screen Settings Windows 10 External Display Setup Software and File Management Switching Windows Users MAUI Firmware Update Technical Support Returning a Product for Service Certifications EMC Compliance Safety Compliance Environmental Compliance ISO Certification Intellectual Property Index...
-
Page 6: About This Manual
Thank you for purchasing a Teledyne LeCroy oscilloscope. We're certain you'll be pleased with the detailed features unique to our instruments. This manual shows the HDO6000B, although much of it could be applied to earlier instruments in the series. With the ®... -
Page 7: Safety
Safety Safety Symbols These symbols appear on the instrument or in documentation to alert you to important safety concerns: Caution of potential damage to instrument or Warning of potential bodily injury. Refer to manual. Do not proceed until the information is fully understood and conditions are met. Caution, high voltage;... -
Page 8: Operating Environment
HDO6000B High Definition Oscilloscopes Operator's Manual Operating Environment Temperature : 5 °C to 40 °C Humidity : Maximum relative humidity 90% up to 31 °C, decreasing linearly to 50% relative humidity at 40 °C Altitude : Up to 10,000 ft (3,048 m) at or below 30 °C... -
Page 9: Power
Safety Power The instrument automatically adapts to the line voltage; manual voltage selection is not required. AC Power Source : 100-240 VAC (± 10%) at 50/60/400 Hz (± 5%) Automatic AC voltage selection Maximum Consumption :* 320 W (320 VA) Nominal Consumption : 220 W (220 VA) Standby Consumption :... -
Page 10: Oscilloscope Overview And Set Up
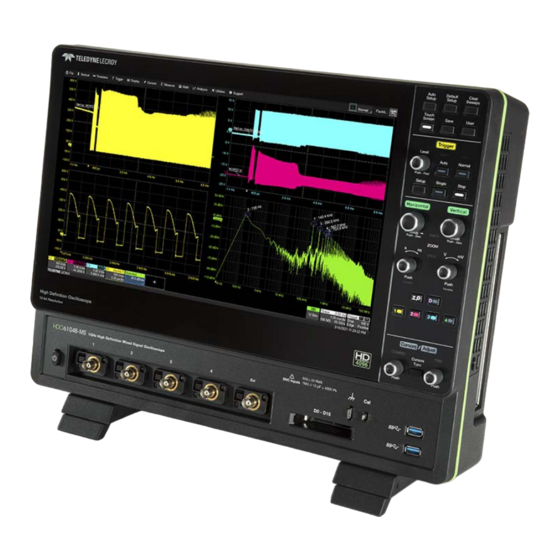
HDO6000B High Definition Oscilloscopes Operator's Manual Oscilloscope Overview and Set Up Front of Oscilloscope A. Touch Screen display F. Mixed Signal interface B. Front Panel controls G. Ground and Cal Out terminals C. Standby Power button H. USB 3.1 ports (2) D. -
Page 11: Side Of Oscilloscope
Oscilloscope Overview and Set Up Side of Oscilloscope A. HDMI and DisplayPort C. Ethernet Ports (2) to external monitors D. Mic In and Speaker Out B. USB 3.1 Gen1 Ports (4) -
Page 12: Back Of Oscilloscope
HDO6000B High Definition Oscilloscopes Operator's Manual Back of Oscilloscope A. Built-in carrying handle E. 10 MHz Ref In / Out for reference clock B. WaveSource output F. USBTMC Port C. Removable solid state drive G. AC power inlet D. Aux output... -
Page 13: Front Panel
Oscilloscope Overview and Set Up Front Panel Front panel controls duplicate functionality available through the touch screen and are described here only briefly. Knobs on the front panel function one way if turned and another if pushed like a button. The first label describes the knob’s “turn” action, the second label its “push”... - Page 14 HDO6000B High Definition Oscilloscopes Operator's Manual Vertical Controls The Offset knob adjusts the zero level of the trace (this makes it appear to move up or down relative to the center axis of the grid). The value appears on the trace descriptor box. Push it to reset Offset to zero.
- Page 15 Oscilloscope Overview and Set Up Miscellaneous Controls These miscellaneous controls also appear along the top and bottom rows of the front panel. Auto Setup performs an Auto Setup. After the first press, you will be prompted for a confirmation. Press the button again or use the touch screen to confirm.
-
Page 16: Signal Interfaces
HDO6000B High Definition Oscilloscopes Operator's Manual Signal Interfaces Teledyne LeCroy instruments offer a variety of interfaces to input analog or digital signals. See the oscilloscope product page at teledynelecroy.com for a list of compatible input devices. ProBus Interface Channel inputs C1-C4 utilize the ProBus interface. -
Page 17: Probes
You can use the signal from the Cal Out hook on the front of the oscilloscope. Active Probes Teledyne LeCroy offers a variety of active probes for use with your oscilloscope. Most active probes match probe to oscilloscope response automatically using probe response data stored in an on-board EEPROM. This ensures the best possible combined probe plus oscilloscope channel frequency response without the need to perform any de- embedding procedure. -
Page 18: Powering On/Off
HDO6000B High Definition Oscilloscopes Operator's Manual Powering On/Off Press the Power button to turn on the instrument. If the button is not easily accessible (e.g., in a rackmount), you can go to Utilities > Preferences and enable Power on AC. Then, the instrument will start whenever the AC power supply is turned on. -
Page 19: Connecting To Other Devices/Systems
Oscilloscope Overview and Set Up Connecting to Other Devices/Systems Use the menu options listed below to configure connections to other devices. The instrument is preset to accept a DHCP network address over a TCP/IP connection. Connect a cable from an Ethernet port on the side panel to a network access device. - Page 20 HDO6000B High Definition Oscilloscopes Operator's Manual Sample Clock To input an external sample clock signal, connect a BNC cable from the EXT input to the other instrument. Go to Timebase > Horizontal Setup > Clock Source to configure the clock.
-
Page 21: Maui User Interface
MAUI User Interface MAUI User Interface MAUI, the Most Advanced User Interface, forms the front-end of Teledyne LeCroy oscilloscopes, providing a single interface for all standard and optional oscilloscope applications. MAUI runs on the Microsoft Windows platform. The oscilloscope firmware and standard applications are active upon delivery. At power-up, the instrument loads the software automatically. -
Page 22: Touch Screen
HDO6000B High Definition Oscilloscopes Operator's Manual Touch Screen With MAUI, the touch screen is the principal control center of the oscilloscope. The entire display is active: use your finger or a stylus to touch, drag, swipe, and draw selection boxes. With the addition of OneTouch, gestures such as pinch and flick can also be used to control the screen. - Page 23 MAUI User Interface Grid The grid displays the waveform traces. Every grid is 8 Vertical divisions representing the full number of 4096 Vertical levels and 10 Horizontal divisions that represent the total acquisition time. The value represented by each Vertical and Horizontal division depends on the Vertical and Horizontal scale of the traces that appear on that grid.
- Page 24 HDO6000B High Definition Oscilloscopes Operator's Manual Grid Indicators These indicators appear around or on the grid to mark important points on the display. They are matched to the color of the trace to which they apply. When multiple traces appear on the same grid, indicators refer to the foreground trace—the one that appears on top of the others.
- Page 25 MAUI User Interface Descriptor Boxes Trace descriptor boxes appear just beneath the grid whenever a trace is turned on. They function to: Inform—descriptors summarize the current trace settings and its activity status. Navigate—touch the descriptor box once to activate the trace, again to open the setup dialog. Arrange—drag-and-drop descriptor boxes to move traces among grids.
- Page 26 HDO6000B High Definition Oscilloscopes Operator's Manual Trace Context Menu The trace context menu is a pop-up menu of actions to apply to a trace, such as turn off, move to next grid, measure, label or rename. Right-click on the descriptor box to open the trace context menu, or touch and hold on the trace...
- Page 27 At the bottom of the oscilloscope display is a narrow message bar. The current date and time are shown at the far right. Status, error, or other messages are shown at the far left, where "Teledyne LeCroy" normally appears. You will see the word "Processing..." highlighted with red at the right of the message bar when the oscilloscope is processing your last acquisition or calculating.
-
Page 28: Display
HDO6000B High Definition Oscilloscopes Operator's Manual Display Display menu settings affect the number and style of grids that appear on screen and some of the visual characteristics of traces, such as persistence. The oscilloscope features a multi-grid display, where each separate grid represents the full number of 4096 vertical levels. - Page 29 MAUI User Interface Grid Intensity To dim or brighten the background grid lines, touch Grid Intensity and enter a value from 0 to 100. Grid on top superimposes the grid over the waveform. Note: Some waveforms may be hidden from view with the grid on top. Axis labels display the values represented by each division of the grid, based on your vertical scale and timebase.
- Page 30 HDO6000B High Definition Oscilloscopes Operator's Manual Q-Scape Display Q-Scape divides the screen into multi-tab displays that can each be configured with different multi-grid display modes. Many of the same functions you can perform in Normal mode, such as moving traces by drag-and-drop, you can also perform in Q-Scape.
- Page 31 MAUI User Interface Note: If you switch from Normal mode into any Q-Scape mode, all traces will move to Tab 1, from which you can drag-and-drop to redistribute them to other grids. In Q-Scape Single mode, you will not be able to drag- and-drop traces across tabs, only to other Tab1 grids.
- Page 32 HDO6000B High Definition Oscilloscopes Operator's Manual Persistence Display The Persistence feature retains waveform traces on the display for a set amount of time before allowing them to gradually "decay," similar to the analog-style display of old, phosphor screen oscilloscopes. The display is generated by repeated sampling of events over time and the accumulation of the sampled data into "persistence maps".
- Page 33 MAUI User Interface In shaded (projected light) quality, the shape of the pulses is emphasized. This quality is monochrome only. In wire frame quality, lines of equal intensity are used to construct the persistence map. This display can be either color or Monochrome. In 3d mode, X Axis Rotation and Y Axis Roation can range 180°...
-
Page 34: Controlling Traces
HDO6000B High Definition Oscilloscopes Operator's Manual Controlling Traces Traces are the visible representations of waveforms that appear on the display grid. They may show live inputs (Cn, Digitaln), a math function applied to a waveform (Fn), a stored memory of a waveform (Mn), a zoom of a waveform (Zn), or the processing results of special analysis software. - Page 35 MAUI User Interface Turning On/Off Traces Turn On/Off Analog Trace To turn on a channel trace, do any of the following: From the front panel, press the Channel button. From the touch screen, choose Vertical > Channel n Setup. Touch the Add New box and select Channel, or drag another Cn descriptor box to Add New. To turn off a trace, press the front panel Channel button a second time, or from the touch screen, either: Right-click on the descriptor box and choose Off.
- Page 36 HDO6000B High Definition Oscilloscopes Operator's Manual Labeling Traces The Label function gives you the ability to add custom annotations to the trace display. Once placed, labels can be moved to new positions or hidden while remaining associated with the trace.
- Page 37 MAUI User Interface Moving Traces You can move a trace from one grid to another by dragging its descriptor box to the desired grid. This is a convenient way to quickly re-arrange traces on the display. If you are in Q-Scape display mode, you can drag the descriptor box to a grid on another tab, provided the grid is visible while you are moving the trace.
- Page 38 HDO6000B High Definition Oscilloscopes Operator's Manual Finding Trace Status If a small letter "i" inside a bubble appears on the trace descriptor box, this indicates there is additional information regarding a waveform processing error that resulted in the oscilloscope being unable to display a trace, or producing a trace that could lead to unreliable measurements.
- Page 39 MAUI User Interface Bit # Value Description 0x0010000000000 Data Undersampled 0x0020000000000 Poor Statistics 0x0040000000000 Slow Transition Time 0x0080000000000 Data Resampled 0x0100000000000 Data Interpolated 0x0200000000000 Measurement Scale Imprecise 0x0400000000000 No Data Available 0x0800000000000 Some Cummulated Results Invalid 0x1000000000000 Insufficient Memory 0x2000000000000 Channel Not Active 0x4000000000000 Use Status Description...
-
Page 40: Zooming
HDO6000B High Definition Oscilloscopes Operator's Manual Zooming Zooms magnify a selected region of a trace by altering the horizontal and/or vertical scale relative to the source trace. They may be created in several ways, using either the front panel or the touch screen. - Page 41 MAUI User Interface Zn Dialog Behind the main Zoom dialog is a separate tab for each potential zoom trace (Z1-Zn). Each Zn dialog reflects the center and scale for that zoom. Use it to adjust each zoom independently. Trace Controls Trace On shows/hides the zoom trace.
- Page 42 HDO6000B High Definition Oscilloscopes Operator's Manual Creating Zooms Any type of trace can be zoomed by creating a new zoom trace (Zn) following the procedures here. Zoom traces open in the next empty grid, with the zoomed portion of the source trace highlighted. If there are no more available grids, zooms will open in the same grid as the source trace.
- Page 43 MAUI User Interface Adjust Zoom Scale The zoom's horizontal units will often differ from the signal timebase, because the zoom is only showing a portion of the total acquisition spread across 10 divisions. You can adjust the zoom factor using the front panel knobs or the zoom factor controls however you like without affecting the timebase (a characteristic shared with math and memory traces).
- Page 44 HDO6000B High Definition Oscilloscopes Operator's Manual Set Up MultiZoom 1. Choose Math > Zoom Setup... to open the Zoom dialog. 2. Check the MultiZoom box. All active zooms are added to the group and rescaled to match the first active zoom in the list.
-
Page 45: Maui With Onetouch
MAUI User Interface MAUI with OneTouch Gestures like touch, drag, swipe, pinch and flick can be used to create and change setups with one touch. Just as you change the display by using the setup dialogs, you can change the setups by moving different display objects. Use the setup dialogs to refine OneTouch actions to precise values. - Page 46 HDO6000B High Definition Oscilloscopes Operator's Manual Copy Setups To copy the setup of one trace to another of the same type (e.g., channel to channel, math to math), drag-and-drop the source descriptor box onto the target descriptor box. To copy the setup of a measurement (Pn), drag-and-drop the source column onto the target column of the Measure table.
- Page 47 MAUI User Interface Position Cursors To change cursor measurement time/level, drag cursor markers to new positions on the grid. The cursor readout will update immediately. To place horizontal cursors on zooms or other calculated traces where the source Horizontal Scale has forced cursors off the grid, drag the cursor readout from below the Timebase descriptor to the grid where you wish to place the cursors.
- Page 48 HDO6000B High Definition Oscilloscopes Operator's Manual Store to Memory To store a trace to internal memory, drag-and-drop its trace descriptor box onto the target memory (Mn) descriptor box. Move Trace To move a trace to a different grid, drag-and-drop the trace descriptor box onto the target grid. If you are in a multi- tabbed Q-Scape display mode, you can move traces between tabs this way.
- Page 49 MAUI User Interface Pan/Swipe Trace To pan a trace, activate it to bring it to the forefront, then drag the waveform trace right/left or up/down. If it is the source of any other trace, that trace will move, as well. For channel traces, the Timebase descriptor box will show the new Horizontal Delay value.
-
Page 50: Windows 10 Gestures
HDO6000B High Definition Oscilloscopes Operator's Manual Zoom To create a new channel zoom trace, touch then drag diagonally to draw a rectangle around the portion of the trace you want to zoom. Touch the Zn descriptor box to open the zoom factor controls and adjust the zoom exactly. -
Page 51: Print/Screen Capture
MAUI User Interface Print/Screen Capture The Print function captures an image of the touch screen. What it does with the image next depends on your Print setting: Send to a networked printer Copy to clipboard to paste into another program "Print"... - Page 52 HDO6000B High Definition Oscilloscopes Operator's Manual...
-
Page 53: Acquisition
Acquisition Acquisition The acquisition settings include everything required to produce a visible trace on screen and an acquisition record that may be saved for later processing and analysis: Vertical axis scale at which to show the input signal, and probe characteristics that affect the signal Horizontal axis scale at which to represent time, sampling mode and sampling rate Acquisition... -
Page 54: Vertical
HDO6000B High Definition Oscilloscopes Operator's Manual Vertical Vertical, also called Channel, settings usually relate to voltage level and control traces along the Y axis. Note: While Digital settings can be accessed through the Vertical menu on Mixed Signal oscilloscopes, they are handled quite differently. - Page 55 Probe Attenuation values for third-party probes may be entered manually on the Cn dialog. The instrument will detect it is a third-party probe and display these fields. When a Teledyne LeCroy probe is connected to a channel input, the Attenuation field becomes a button to access Probe dialog, a tab added to the right of the Cn tab.
- Page 56 HDO6000B High Definition Oscilloscopes Operator's Manual The Vertical Units setting may be changed from Volts (V) to Amperes (A) or Others. This is useful when using a third- party current probe (which is not auto-detected) or when probing across a current sensor/resistor. Units assigned directly to an input will carry to other traces calculated using that input, such as math or spectrum traces.
- Page 57 Auto Zero corrects for DC offset drifts that naturally occur from thermal effects in the amplifier of active probes. Teledyne LeCroy probes incorporate Auto Zero capability to remove the DC offset from the probe's amplifier output to improve the measurement accuracy.
-
Page 58: Digital (Mixed Signal)
HDO6000B High Definition Oscilloscopes Operator's Manual Digital (Mixed Signal) When a Mixed Signal device is connected to the oscilloscope, digital input options are added to the Vertical menu. There are set up dialogs for each possible digital group, Digital1 to Digitaln, which correspond to digital buses. You choose which lines make up each digital group, what they are named, and how they appear on the display. - Page 59 Acquisition Digital Setup Using Digital Leadset The digital leadset enables input of up-to-16 lines of digital data. Physical lines can be preconfigured into different logical groups, Digitaln, corresponding to a bus. The transitions for each line may be viewed through different displays. The digital leadset features two digital banks with separate Threshold and Hysteresis controls, making it possible to simultaneously view data from different logic families.
- Page 60 HDO6000B High Definition Oscilloscopes Operator's Manual each digital bank, or set custom Threshhold and Hysteresis values. Digital Display Setup Choose the type and position of the digital traces that appear on screen for each digital group. 1. Choose a Display Mode: Lines (default) shows a time-correlated trace indicating high, low, and transitioning points (relative to the Threshold) for every digital line in the group.
- Page 61 Acquisition Renumbering Digital Lines Labels can also be "swapped" between lines. This procedure helps in cases where the physical lead number is different from the logical line number you would like to assign to that input. It can save time having to reattach leads or reconfigure groups.
-
Page 62: Timebase
HDO6000B High Definition Oscilloscopes Operator's Manual Timebase Timebase (Horizontal) settings control traces along the X axis. The timebase is shared by all channels. The time represented by each horizontal division of the grid, or Time/Division, is most easily adjusted using the front panel Horizontal knob. - Page 63 Acquisition Set Maximum Memory, the default setting on MAUI oscilloscopes, automatically adjusts the sampling rate to take the maximum number of samples possible given the amount of pre- or post-trigger Delay and the Time/div, up to the maximum record length. This optimizes the sample rate for fast timebases when in Real Time mode. Fixed Sampling Rate activates the Sampling Rate field for you to set your own rate.
- Page 64 HDO6000B High Definition Oscilloscopes Operator's Manual Sampling Modes The Sampling Mode determines how the instrument samples the input signal and renders it for display. Real Time Sampling Mode Real Time sampling mode is a series of digitized voltage values sampled on the input signal at a uniform rate. These samples are displayed as a series of measured data values associated with a single trigger event.
- Page 65 Acquisition Sequence Sampling Mode In Sequence Mode sampling, the completed acquisition consists of a number of fixed-size segments each containing the trigger event. The instrument calculates the capture duration and number of sample points in each segment from the user-defined number of segments and total available memory. Acquired segments can be arranged adjacent to one another, forming the waveform display of a typical acquisition, or in other types of sequence displays to facilitate comparison of the segments.
- Page 66 HDO6000B High Definition Oscilloscopes Operator's Manual Adjacent Overlay Perspective Waterfall (cascaded) Mosaic (tiled) 5. To see the trigger times of those segments acquired, stop acquisition and touch Show Sequence Trigger Times. This will launch the Trigger Time tab of the Acquisition Status dialogs.
- Page 67 The table below shows support at time of publication. Oscilloscope External Clock Frequencies Impedance Input 50 Ω HDO6000B Reference Clock 10 MHz ±25 ppm @ 0 - 10 dBm Rear REF In 50 Ω / 1 M Ω Sample Clock DC to 100 MHz...
- Page 68 HDO6000B High Definition Oscilloscopes Operator's Manual History Mode History Mode allows you to review any acquisition saved in the history buffer, which automatically stores all acquisition records until full. Not only can individual acquisitions be restored to the grid, you can "scroll" backward and forward through the history at varying speeds to capture changes in the waveforms over time.
- Page 69 Acquisition Top row buttons scroll: Fast Backward, Slow Backward, Slow Forward, Fast Forward. Bottom row buttons step: Back to Start, Back One, Go to Index (row #), Forward One, Forward to End. Press Pause when you see something of interest, then use the History table to find the exact Index. Select Single Acquisition 1.
-
Page 70: Trigger
HDO6000B High Definition Oscilloscopes Operator's Manual Trigger Triggers define the event around which digitized information is displayed on the grid. Different Trigger Types are used to select different events in the trigger source waveforms: edge voltages, pulse widths, high/low states, etc. These may be a single channel event or a complex pattern of events across several channels. - Page 71 Acquisition Trigger Types The Trigger Type sets the triggering conditions. Edge triggers upon a achieving a certain voltage level in the positive or negative slope of the waveform. Width triggers upon finding a positive- or negative-going pulse width when measured at the specified voltage level. Pattern triggers upon a user-defined pattern of concurrent high and low voltage levels on selected inputs.
- Page 72 HDO6000B High Definition Oscilloscopes Operator's Manual may be used with several types of triggers, most usually Edge triggers that fire upon the occurrence of a particular edge and level of the trigger input. "External triggers" (Ext source) look for the selected slope and level in an externally generated pulse that is input to the oscilloscope's Ext.
- Page 73 Acquisition HFREJ - DC coupled to the trigger circuit, and a low-pass filter network attenuates frequencies above 50 kHz (used for triggering on low frequencies). Slope/Polarity For some triggers, such as Edge, you will be asked to select the waveform Slope (e.g., rising vs. falling) on which the triggering event occurs.
- Page 74 HDO6000B High Definition Oscilloscopes Operator's Manual Digital Pattern A digital pattern is set on a single bus (group) manually or by applying a hexadecimal value, while the remaining lines are disabled ("Don't Care"). The Logic Bus method simplifies pattern set up by utilizing digital groups you have already defined on the Digital Setup dialogs.
- Page 75 Acquisition Analog Pattern 1. On the Trigger dialog, select the Pattern trigger type. 2. Select the Boolean Operator that describes the relationship among analog inputs (e.g., C1 must be High AND C2 must be Low). 3. For each input in the trigger pattern, select what State it must be in compared to the threshold Level. Leave "Don't Care"...
- Page 76 HDO6000B High Definition Oscilloscopes Operator's Manual Serial Trigger The Serial trigger type will appear if you have installed serial data trigger and decode options. Select the Serial type then the desired Protocol to open the serial trigger setup dialogs. For setup instructions, see the software instruction manual at teledynelecroy.com/support/techlib...
- Page 77 Acquisition Qualified Trigger A Qualified trigger arms on the A event, then triggers on the B event. In Normal trigger mode, it automatically resets after the B event, and re-arms upon the next matching A event. Unlike a basic Edge or Pattern trigger with Holdoff, the A and B events can occur in different signals, allowing you to use the state of one signal to "qualify"...
- Page 78 HDO6000B High Definition Oscilloscopes Operator's Manual Cascaded Trigger A Cascaded trigger type establishes a succession of criteria in Stages A-D. The trigger occurs when stages B through D—or whatever is the last defined event—are achieved. In Normal trigger mode, it automatically resets after finding the last defined event.
- Page 79 Acquisition Trigger Holdoff Holdoff is either a period of time or an event count that may be set as an additional condition for Edge and Pattern triggers. Holdoff disables the trigger temporarily, even if the other conditions are met. Use Holdoff to obtain a stable trigger for repetitive, composite waveforms.
- Page 80 HDO6000B High Definition Oscilloscopes Operator's Manual Regardless of where in the acquisition record the trigger event was found (first edge or last), the display will show time pre- and post-trigger based on your Time/Div and Delay settings. Hold Off by Events Events refers to the number of times the trigger conditions have been met following the arming event.
- Page 81 Acquisition Software Assisted Trigger Software Assisted Trigger is used to find the trigger-level crossing point closest to the hardware trigger point. It then adjusts the time offset of the waveform so that it is aligned with the specified trigger level and slope. In the following figure, the white trace is the waveform at the input to software-assisted trigger processing.
- Page 82 HDO6000B High Definition Oscilloscopes Operator's Manual TriggerScan TriggerScan is a debugging tool that helps you quickly discover waveform anomalies by automating the process of building triggers designed to find rare events in an acquisition. Triggerscan trains the system by looking at acquired waveforms. During the training, TriggerScan analyzes the waveforms to determine what waveforms normally look like.
- Page 83 Acquisition Enter a Dwell Time the time instrument should wait before loading the next trigger. Check Stop On Trigger. You can use this to isolate events as triggers find them. Saving TriggerScan Setups You can preserve the Trigger List by saving it to a setup file. The current Trigger List is not preserved after exiting the application unless you manually save it.
- Page 84 HDO6000B High Definition Oscilloscopes Operator's Manual...
-
Page 85: Cursors
Cursors Cursors Cursors are markers (lines, cross-hairs, and arrows) that identify horizontal and vertical values where they intersect the X or Y axis. Use cursors to make fast, accurate measurements of points on the waveform. Cursor Types Horizontal Cursors Horizontal cursors are positioned at points on the x-axis and will measure the source trace horizontal and vertical values at that point. - Page 86 HDO6000B High Definition Oscilloscopes Operator's Manual Absolute shows the vertical values where X1 and X2 intersect the source trace. Delta shows the difference in vertical value where each cursor intersects the source trace (marked by the arrows), calculated as: y@X2 – y@X1 = ∆y. When the X1 arrow is higher than the X2 arrow, this will be a negative number, as it represents a drop (e.g., in voltage), even when X2 is positioned above the zero level.
- Page 87 Cursors The Vertical Abs(olute) cursor displays a single line, Y1. The readout on the source trace descriptor box shows the vertical value at the point where Y1 intersects the y-axis. The Vertical Rel(ative) cursor displays two lines: the dashed-dotted line is Y1, and the dashed line is Y2. As with the Horizontal Relative cursor, the readout on the source trace descriptor box depends on the Show selection: Absolute shows the vertical values where Y1 and Y2 intersect the y-axis.
-
Page 88: Apply And Position Cursors
HDO6000B High Definition Oscilloscopes Operator's Manual Apply and Position Cursors To turn on cursors, either: From the menu bar, choose Cursors and select the desired cursor type from the drop-down list. On the front panel, press the Cursor button to turn on cursors, then continue pressing to cycle through all the cursor types. -
Page 89: Standard Cursors Dialog
Cursors Standard Cursors Dialog These controls can be used instead of the front panel controls to turn on cursors or to refine the cursor position. Access the dialog by choosing Cursors > Cursors Setup from the menu bar. Cursor Type buttons select the type of cursor displayed on the grid. The Show controls determine what values are shown in the vertical readout when using relative cursors: Absolute shows specific voltages for the two cursor locations. - Page 90 HDO6000B High Definition Oscilloscopes Operator's Manual...
-
Page 91: Measure
Measure Measure Parameters are tools that give you access to a wide range of waveform properties, such as Rise Time, RMS voltage and Peak-Peak voltage. The instrument offers a quick selection of standard parameters, or you can create a user- defined set of parameters (My Measure) drawn from all available measurements. -
Page 92: Measure Table
HDO6000B High Definition Oscilloscopes Operator's Manual Measure Table The value row of the Measure table shows the measurements taken for each parameter on the last acquisition. You may optionally calculate and display the statistical mean, min, max and sdev of all parameters. -
Page 93: Measure Dialog
Measure Measure Dialog The Measure Dialog gives quick access to measurement features. Besides turning on/off parameters, use the Measure dialog to display statistics, histicons help markers for standard and user-defined parameter sets. You can also gate parameters to limit the horizontal scope of the measurement. Selecting Measurements 1. - Page 94 HDO6000B High Definition Oscilloscopes Operator's Manual Statistics and Histicons Checking Statistics On on the Measure dialog adds the mean, min, max and sdev of each parameter to the measured value shown on the Measure table. Statistics for each parameter are calculated once per acquisition and accumulate until you either Clear Sweeps or the measurement buffer is full.
- Page 95 Measure Gating Measurements All measurements are calculated on only that portion of the waveform trace that is visible on the grid and within the measurement gates. Any setting that moves the trace outside the observation window or makes it appear "clipped" will affect measurements.
- Page 96 HDO6000B High Definition Oscilloscopes Operator's Manual Help Markers Help Markers clarify measurements by displaying lines, labels and hysteresis bands to mark the points being measured on the trace. For "@Level" parameters, markers make it easier to see where your waveform intersects the chosen level.
-
Page 97: Parameter Set Up
Measure Parameter Set Up Use the Pn dialogs to define a new set of measurement parameters ("My Measure"). 1. From the menu bar, choose Measure > Measure Setup. 2. Choose Measure Mode My Measure. 3. Open the Pn dialog and check On to activate the parameter. 4. - Page 98 HDO6000B High Definition Oscilloscopes Operator's Manual Positive, use the rising edge of a pulse Negative, use the falling edge of a pulse Both, use either edge, whichever next occurs that meets the other criteria Here, the P1 Half Period parameter uses a Slope of Both, resulting in 10 measurements in this five period acquisition, one every time the signal crosses the 50% Level, rising or falling (only the first rising edge measurement is marked by the Help Marker).
- Page 99 Measure Level Level is the point on the Vertical (Y) axis used to take a measurement. The default Level for measurements is 0 V or 50% amplitude, the center grid line when there is no Vertical Offset . When Level can be specified, it can usually be set as either: An Absolute number of Volts, or whatever is the vertical unit of the source waveform A Percent of waveform amplitude, as determined by the Top-Base calculation...
- Page 100 HDO6000B High Definition Oscilloscopes Operator's Manual Periodic and Cyclic Measurements Some measurement set up dialogs display a checkbox for Show one value per period or Cyclic. Periodic measurements return one measurement per full waveform period in the acquisition. Usually, "per period" is an option for Vertical parameters, like Amplitude, that would normally return only the value of the last full period in the acquisition.
- Page 101 Measure Counting Periods/Cycles Per period and cyclic measurements are subject to the other measurement settings, such as the Slope and Level from which to count the waveform periods. Always visit the subdialogs that appear when checking Show one value per period or Cyclic to determine if there are further settings to be made. When the measure gates are in their default positions of 0 and 10 div, the periods/cycles are counted across the full width of the grid.
- Page 102 HDO6000B High Definition Oscilloscopes Operator's Manual Note that although the Help Markers overlay the first two periods, the measurement value of -1.686 ns reported is actually the final measurement comparing the last two periods, as would be shown by looking at a WaveScan of the same acquisition.
- Page 103 Measure Dperiod@level also allows you to also specify how the Group Size interval is treated, as a separator or a summation. Use One Value Per Group (shown above) measures every nth cycle, the first in each group. Sum All Values in Group (shown below) calculates the sum of all the cycles in the group and compares it to that of the next group.
- Page 104 HDO6000B High Definition Oscilloscopes Operator's Manual Range Limited Parameters 1. From the menu bar, choose Measure > Measure Setup..., then touch the Pn tab to open the parameter setup dialog. 2. On the Accept subdialog, select Values In Range and enter the start and stop values, or touch the Find Range button to quickly display the most recently measured range of values.
-
Page 105: List Of Standard Measurements
Measure List of Standard Measurements Note: Unless otherwise stated, measurements are calculated according to IEEE standards. Additional measurements may be available depending on the software options installed. The keyword to use in remote control programs appears in Summary on the Pn dialog. Waveform Measurements Amplitude Difference between the upper and lower levels in two-level (bi-modal) signals. - Page 106 HDO6000B High Definition Oscilloscopes Operator's Manual Delta Delay Time from the first 50% level crossing of Source1 to the first 50% level crossing of Source2. Delta Delay can be used to measure the propagation delay between two signals by triggering on one and measuring the Delay of the other. It may yield a negative result in cases where the Source2 crossing occurs before the Source1 crossing.
- Page 107 Measure Edge to Edge Time from the specified edge on Source1 to the specified edge on Source2. Edge@level Number of edges in waveform that cross the specified threshold Level, measured on rising edges (Pos Slope), falling edges (Neg Slope), or next crossing (Both Slope). See Slope, Level and Hysteresis.
- Page 108 HDO6000B High Definition Oscilloscopes Operator's Manual Hold Time Time from the first data signal edge at specified slope and level (Source2), to nearest previous clock signal edge at specified slope and level (Source1). Use Hold Clock subdialog to specify clock edge, and Hold Data subdialog to specify the data edge.
- Page 109 Measure Overshoot- Amount of overshoot following falling edges, represented as percentage of amplitude. Overshoot- is calculated using the formula (Base - Minimum)/Amplitude x 100. On signals that do not have two major levels (e.g., triange waveforms), this measurement may not give predictable results. Overshoot+ Amount of overshoot following rising edges, represented as a percentage of amplitude.
- Page 110 HDO6000B High Definition Oscilloscopes Operator's Manual Rise@level Duration of a pulse waveform's rising edge between user-defined transition levels, measured for all rising transitions with the value for the last full pulse shown The two values used to compute the rise time are calculated as:...
- Page 111 Measure Time@level Time from trigger (t=0) to crossing at a specified slope and level. See Slope, Level and Hysteresis. Higher vertical value in two-level (bi-modal) signals (the lower is Base), or higher of two most probable waveform states on waveforms that are not bi-modal. Top differs from Maximum in that noise, overshoot, undershoot and ringing do not affect the measurement.
- Page 112 HDO6000B High Definition Oscilloscopes Operator's Manual Histogram Measurements These measurements can be made on histogram math functions. You will receive an error status if you attempt to place them on a pulse waveform or other incompatible source. FWXX Full Width at xx%, width of the largest area histogram peak at a user-specified percentage of the population of the highest peak.
- Page 113 Measure Hist range The Max-to-Min range of a histogram. Hist rms Root mean square of the values in a histogram. Hist sdev Standard deviation of the values in a histogram. Hist top Value of the right-most histogram peak. Hist X@peak Value of the nth highest histogram peak.
- Page 114 HDO6000B High Definition Oscilloscopes Operator's Manual Custom Measurements These "measurements" enable you to insert a custom script into the oscilloscope process and read back results into the parameter in real time.The script must yield a numeric result. Custom measurements are standard on WaveMaster, LabMaster, DDA and SDA models. They are enabled with the XDEV option on others.
-
Page 115: Parameter Math
Measure Parameter Math In addition to measuring waveforms, you can set up a parameter that performs mathematical operations on the results of other parameters. Parameter math differs from math functions in that the input and the output are still numerical values that display in the Measure table. Math functions, on the other hand, input and output waveform traces that appear on the grid. - Page 116 HDO6000B High Definition Oscilloscopes Operator's Manual 4. Touch Math Operator and choose P Script. 5. Enter the Source input parameter(s). 6. On the Script Math subdialog, touch Script Language and choose either VBScript or JScript. 7. Touch the Edit Code button to open the Script Editor window.
-
Page 117: Using Web Editor
Measure Using Web Editor Whereas with Parameter Math you can apply a single math operation to measurement parameters, the Web Editor enables you to create processes that chain many operations on multiple inputs, including custom math and measurements (with the XDEV option), and yield multiple outputs. These processes are integral to the operation of the instrument;... - Page 118 HDO6000B High Definition Oscilloscopes Operator's Manual 6. On the Wed Editor dialog, choose the type of process to add to the flow. You can Add Math, Add Measure, or Add Param Math. 7. From the pop-up, choose the operation or measurement that will occur at that node. A new block appears on the display.
- Page 119 Measure 11. Drag the output pin from the final process block to the input pin on the terminal. Preview Outputs You can add preview "windows" to see the output of a process at any stage in the flow. These previews apply only to the Web Editor.
-
Page 120: Fast Multiwave Port
HDO6000B High Definition Oscilloscopes Operator's Manual Fast MultiWave Port Based on the Fast Wave Port math function, Fast MultiWave Port allows a client Windows C/C++ application to access oscilloscope data via the shared memory and process it in a separate stream from the oscilloscope application. - Page 121 Measure Enter a Timeout at the end of which to return control to the oscilloscope application if the client has not indicated processing is complete. Select Clear Cumulative to Clear Sweeps automatically before each acquisition. This will reset parameter statistics to only the results of the last acquisition. Select Reframe Waveforms to check after each acquisition for the value range of waveforms and reframe (rescale) the signal so that it fits vertically into a grid.
- Page 122 HDO6000B High Definition Oscilloscopes Operator's Manual...
- Page 123 Measure Client Programming Considerations The program ID is: LeCroy.FastMultiWavePort.1 A waveform descriptor is supplied in the MultiWavePort.h header file. There is also a “mini-descriptor” block which contains incremental information to characterize each additional waveform data block. Likewise, a descriptor header has been provided for parameter results, and a protocol for supplying parameter values.
-
Page 124: Using Histograms
HDO6000B High Definition Oscilloscopes Operator's Manual Using Histograms Histograms display the statistical distribution of parameter values using bars of varying heights to represent measurement frequency. The Histogram math function plots the number of parameter measurements that fall within a small range, known as a bin, as a function of the parameter value. Each bin is represented by a bar on the chart. - Page 125 Measure Histogram Calculation Histograms are calculated on the portion of the waveform within the acquisition window and the measurement gates, just as are the parameters. Likewise, histogram measurements are limited to the bars of the histogram that are visible on the grid and that fall within the measurement gates. In Sequence sampling mode, one acquisition for each segment occurs prior to parameter calculations, and a sweep is equivalent to acquisitions for all segments (for non-segmented waveforms, an acquisition is identical to a sweep).
- Page 126 HDO6000B High Definition Oscilloscopes Operator's Manual Histogram Scaling Bins First, enter the total #Bins that comprise the histogram. This determines how many bars appear in the histogram. Histogram peak bin values are useful because they indicate the dominant values of a parameter, but using a too high number of bins can yield a spiky histogram, making meaningful peaks hard to distinguish.
-
Page 127: Using Trends
Measure Using Trends The Trend math function plots a waveform composed of parameter measurements arranged in the order the measurements were made. The vertical units are the source parameter values, and the horizontal unit is the measurement number. The Trend contains a single value for each unique measurement, and therefore may not be time synchronous with the source waveform, where the same measured value may occur successively over time. -
Page 128: Using Tracks
HDO6000B High Definition Oscilloscopes Operator's Manual Using Tracks A Track is a waveform composed of parameter measurements that are time synchronous with the source waveform. The vertical units are those of the source parameter and the horizontal units are seconds. Due to the time synchronization, the number of points in the Track function is identical to the number of samples in the source waveform, and a Track is limited to the samples in a single acquisition. -
Page 129: Track Vs. Trend
Measure Track vs. Trend The table below summarizes the differences between Track and Trend. Track Trend (Parameter value vs. time) (Parameter value vs. event) Cumulative? No, resets after every acquisition Cumulative over unlimited number of acquisitions, up to two billion events Time correlates to other data? Monitors Frequency domain? No, points are not evenly spaced in time... - Page 130 HDO6000B High Definition Oscilloscopes Operator's Manual...
-
Page 131: Math
Math Math Math function traces (Fn) display the result of applying a mathematical operation to a source trace. The output of a math function is always another trace, whereas the output of a measurement parameter is a tabular readout of the measurement. - Page 132 HDO6000B High Definition Oscilloscopes Operator's Manual 2. Choose a single f(x) or dual g(f(x) operator function. You can also choose Web Edit, in which case this function is added as a terminal to the processing web. See the instructions for Using Wed Edit to set up the function.
-
Page 133: Math Dialog
Math Math Dialog Once a math function has been created and saved on the Function (Fn) dialog, use the main Math dialog to quickly enable/disable it. You can also use this dialog to quickly turn on/off zoom traces. To open the Math dialogs, from the menu bar choose Math > Math Setup. Select the On checkbox next to each function you wish to display. - Page 134 HDO6000B High Definition Oscilloscopes Operator's Manual Deskew Shifts trace in time the amount of the deskew factor. Difference For every point in the waveform, subtracts the value of Source2 from the value of Source1. Source1 and Source2 must have the same horizontal and vertical units and scale.
- Page 135 Math Invert For every point in the waveform, the inverse of that point is calculated. Peforms a natural log of a waveform. Values less than or equal to zero are set to underflow. Log10 Performs a log base 10 of a waveform. Values less than or equal to zero are set to underflow. Phistogram Creates a histogram based on the displayed pixels of a persistence map falling within a user-defined vertical and/or horizontal box (slice).
- Page 136 HDO6000B High Definition Oscilloscopes Operator's Manual Segment Selects one segment [#] from a segmented waveform and copies it into the function, enabling it to be rescaled independent of the source trace. Sinx/x Performs 10-to-1 interpolation using a Sin(x)/x filter. Sparse “Thins,”...
- Page 137 Math Custom Math Operators These "operators" enable you to insert a custom script into the oscilloscope process and view the resulting waveform in real time. Excel math Custom math performed in Excel. The operator will transfer one or two waveforms (as a series of time-value pairs) into an Excel spreadsheet and display the resulting waveform.
-
Page 138: Average Function
HDO6000B High Definition Oscilloscopes Operator's Manual Average Function The summed or continuous average of all data samples from multiple acquisitions can be displayed as a new waveform trace using the Average function. Setting Up Averaging To apply Continuous or Summed Averaging as a Math function: 1. -
Page 139: Copy Function
Math Sweep New Average = 1 (no old average yet) (new data +0 * old average)/(0 + 1) = new data only (new data + 1*old average)/(1 + 1) = 1/2 new data +1/2 old average (new data + 2 * old average)/(2 + 1) = 1/3 new data + 2/3 old average (new data + 3 * old average)/(3 + 1) = 1/4 new data + 3/4 old average (new data + 4 * old average)/(4 + 1) = 1/5 new data + 4/5 old average (new data + 4 * old average)/(4 + 1) = 1/5 new data + 4/5 old average... -
Page 140: Eres Function
HDO6000B High Definition Oscilloscopes Operator's Manual ERes Function ERes (Enhanced Resolution) filtering increases vertical resolution, allowing you to distinguish closely spaced voltage levels. The instrument's ERes function is similar to smoothing the signal with a simple, moving-average filter, but is more efficient concerning bandwidth and pass-band filtering. - Page 141 Math The improvement in SNR corresponds to the improvement in resolution if the noise in the signal is white (evenly distributed across the frequency spectrum). If the noise power is biased towards high frequencies, the SNR improvement will be better than the resolution improvement. The opposite may be true if the noise is mostly at lower frequencies.
-
Page 142: Fast Wave Port Function
HDO6000B High Definition Oscilloscopes Operator's Manual Fast Wave Port Function Fast Wave Port is an Advanced Customization (XDEV) function of Teledyne LeCroy X-Stream oscilloscopes that enables you to insert a custom algorithm written in the C/C++ language into the oscilloscope's processing stream as a Math function (Fn). - Page 143 Math The full names of the default global objects are as follows: Object Full Name Memory Mapped File FastWavePort1File Data Available Event FastWavePort1MutexDataAvailable Processing Complete Event FastWavePort1MutexProcessingComplete The Timeout control specifies the amount of time the DSO waits for the custom processing function to complete. This prevents the DSO from waiting indefinitely for a custom processing function which may never arrive.
- Page 144 HDO6000B High Definition Oscilloscopes Operator's Manual #define FLAGS_OUTPUT_VALID 0x01 typedef unsigned __int64 lecTimeStamp; lecTimeStamp lecTimeStampOneSecond = 1000000000; // 1 ns units in a second #pragma pack(push, 4) // pack on 4-byte boundaries (Important!) struct CDescHeader int descVersion; // header version number int flags;...
- Page 145 Math // names based on 'FastWavePort1' name defined in Processor setup. char szMapFileName[] = "FastWavePort1File"; char szMutexDataAvailableName[] = "FastWavePort1MutexDataAvailable"; char szMutexProcessingCompleteName[] = "FastWavePort1MutexProcessingComplete"; // Associate shared memory file handle value. HANDLE m_hMMFile = CreateFileMapping ((HANDLE)0xffffffff, NULL, PAGE_READWRITE, 0, MEM_MAP_FILE_ SIZE, szMapFileName); if(m_hMMFile == 0) printf("Unable to create file mapping\n");...
- Page 146 HDO6000B High Definition Oscilloscopes Operator's Manual // main loop while(1) int i = 0; printf("Waiting for new data...\n"); // wait an infinite amount of time for data to be available DWORD waitSuccess = WaitForSingleObject(m_hDataAvailable, INFINITE); // print the first few bytes of the input waveform CDescHeader *descHeader = (CDescHeader *) &m_lpMMFile[0];...
-
Page 147: Fft Function
Math Header Description int descVersion; // header version number int flags; // misc. flags indicating the status of input, and how to treat the output int headerSize; // size of the header, data starts immediately after the hdr. int windowSize; // total size of the window (header + data) int numSamples;... - Page 148 HDO6000B High Definition Oscilloscopes Operator's Manual Setting Up FFT 1. Follow the usual steps to set up a math function, selecting FFT from the Frequency Analysis submenu. 2. Open the FFT subdialog. 3. Choose an Output type. 4. If your Output Type is Power Density or Power Spectrum, also enter Line Impedence. By default, the FFT function assumes a termination of 50 Ohms.
-
Page 149: Interpolate Function
Math Interpolate Function The Interpolate operator enables you to generate a trace that interpolates data points into the source trace according to your selected method and upsampling factor. Linear interpolation, which inserts a straight line between sample points, is best used to reconstruct straight-edged signals such as square waves. -
Page 150: Rescale Function
HDO6000B High Definition Oscilloscopes Operator's Manual Rescale Function The Rescale function allows you to create a new function trace that rescales another trace by applying a multiplication factor (a) and additive constant (b). You can also use it as a way to view the function source in a different unit of measure. - Page 151 Math Note: Time and dimensionless units are available only for certain measurements and for use in code where relevant. Category Unit Mnemonic Mass gram slug SLUG Volume liter cubic meter cubic inch cubic foot cubic yard YARD3 Angle radian arcdegree arcminute arcsecond cycle...
- Page 152 HDO6000B High Definition Oscilloscopes Operator's Manual Category Unit Mnemonic Rotating Machine radians/second RADPS frequency (Hertz) revolutions/second revolutions/minute torque N•m torque in•oz INOZ torque in•lb INLB torque ft•lb FTLB power, mechanical (Watt) horsepower Magnetic Weber Tesla inductance (Henry) magnetic field strength...
- Page 153 Math Category Unit Mnemonic Dimensionless percent percent min-max PCTMNMX decibel decibel milliwatt decibel Volt decibel millivolt DBMV decibel microvolt DBUV decibel microampere DBUA decibel referred to carrier decade DECADE unit interval Q-scale byte BYTE baud BAUD least significant bit poise POISE parts per million pixel...
-
Page 154: Phistogram Function
HDO6000B High Definition Oscilloscopes Operator's Manual Phistogram Function The Phistogram Math function creates a histogram of the samples within a vertical or horizontal "slice" of a persistence map to reveal the features that are only visible when several acquisitions have been superimposed on one another. -
Page 155: Ptrace Functions
Math Ptrace Functions The Ptrace Mean, Ptrace Range, and Ptrace Sigma math functions (found in the Jitter Functions sub-menu of the Math Operator selector) compute a vector trace based on a persistence map of underlying signal acquisitions without destroying the underlying raw data. Signals sampled at or above 2 GS/s that have accumulated in the persistence map can be traced at a resolution of 10 ps (100 GS/s equivalent sampling). - Page 156 HDO6000B High Definition Oscilloscopes Operator's Manual...
-
Page 157: Memories
Import External Waveform Files into Memory Trace (.trc) files saved on other Teledyne LeCroy instruments can also be imported into internal memory using the waveform recall feature. Choose File > Recall Waveform and to recall the file to an internal memory. Then, you can... -
Page 158: Restoring Memories
HDO6000B High Definition Oscilloscopes Operator's Manual Restoring Memories The Memories dialog is a convenient panel for restoring saved memories to the display. Access the Memories dialog by pressing the front panel Mem button or choosing Math > Memory Setup. Check On next to the memory trace you wish to display. A description of the memory showing the source channel and creation time appears next to each Mn on the dialog. -
Page 159: Analysis Tools
Analysis Tools Analysis Tools The Analysis menu tools complement the standard math and measurements to help you understand the behavior of waveforms. WaveScan searches single or multiple acquisitions for events that meet specific criteria. Pass/Fail Testing shows whether waveforms or measurements meet a set of defined criteria. CustomDSO (XDEV) enabes you to insert custom VBScript (VBS) or 3rd-party programs such as Excel™, Mathcad™, and MATLAB™... - Page 160 HDO6000B High Definition Oscilloscopes Operator's Manual Setting Up WaveScan Set up your source channel and triggers before setting up the scan. 1. Press the front panel Stop button to stop acquisition. 2. Choose Analysis > WaveScan and check Enable. 3. Choose the Source waveform.
- Page 161 Analysis Tools Non-monotonic Mode Non-monotonic Mode looks for edges that cross a threshold more than once between high and low levels. All events that meet the criteria of slope, hysteresis, and level are presented in a table and highlighted in the source trace. The value displayed in the table is the difference of the max.
- Page 162 HDO6000B High Definition Oscilloscopes Operator's Manual Serial Pattern Mode Serial Pattern Mode is used for finding 2- to 64-bit patterns in digital sequences. It is ideal for bursted patterns where a PLL cannot lock. Serial Pattern Mode settings are: Viewing. Choose to enter the pattern as Binary or Hex(adecimal).
- Page 163 Analysis Tools Scan Overlay To apply monochromatic persistence to a Scan Overlay: 1. Select Scan Overlay when setting up the wave scan, then open the Scan Overlay dialog. 2. Check Persistence On. 3. Enter a Saturation level as a percentage. All samples above the saturation level are assigned the highest color intensity.
- Page 164 HDO6000B High Definition Oscilloscopes Operator's Manual WaveScan Search Search is used to find events in traces—usually zoom (Zn) traces—that match user-defined criteria. To search within WaveScan: 1. Select the Zoom view. 2. After stopping the acquisition, open the Z1 dialog that appears behind the WaveScan dialog.
-
Page 165: Pass/Fail Testing
Analysis Tools PASS/FAIL Testing PASS/FAIL testing allows you to define a set of qualifying conditions that an acquisition may "PASS" or "FAIL" when tested against, then take actions depending on the result. Mask testing compares sampled values to a pre-defined area of the grid (the "mask") to see if they fall within or without. - Page 166 HDO6000B High Definition Oscilloscopes Operator's Manual 3. Touch the Ver Delta and Hor Delta fields and enter boundary values using the pop-up Virtual Keypad or the front panel Adjust knob. 4. Touch Make from Trace. Load Mask Do this instead of Make Mask if you have a pre-defined mask file.
- Page 167 Analysis Tools Param(eter) Compare PASS/FAIL queries (Qn) can be configured to compare different parameter measurements (Pn) to each other, or to a user-defined limit or statistical range. The Summary field shows the logic represented by the query. Check it to ensure your selections are producing the test you want. Comparing a Measurement to a Limit This method compares the result of a selected parameter to a user-defined limit or statistical range.
- Page 168 HDO6000B High Definition Oscilloscopes Operator's Manual Defining PASS/FAIL Tests The queries define the conditions that, if met, would result in "true" but don't in themselves determine the test result. You must separately define what constitutes a "PASS" or a "FAIL" on the Actions dialog. Either result can be made to produce various additional actions, such as sending a pulse to another device.
-
Page 169: Save/Recall Data (File Menu)
Note: Only traces saved in Teledyne LeCroy proprietary formats can be recalled to the display directly. Use the Binary format (.trc) for analog waveforms, or WaveML (.xml) for digital waveforms. Other waveform types must be recalled into memory before being displayed. - Page 170 3. Choose the Source waveform. To quickly save all displayed waveforms separate trace files, touch the All Displayed button. 4. Select a file Format. Binary is Teledyne LeCroy's .trc file format. Binary results in the smallest possible file size. Binary files can be converted to ASCII using Teledye LeCroy utilities such as WaveStudio. WaveML is a proprietary .xml format used to save persistence maps, eye diagrams, histograms, and digital traces.
- Page 171 Save/Recall Data (File Menu) Save Setup You can quickly save oscilloscope configurations to one of the internal setup panels or to a LeCroy System Setup (.lss) file, a text-based Automation program. Setups can be easily recalled to restore the oscilloscope to the saved state.
- Page 172 HDO6000B High Definition Oscilloscopes Operator's Manual Save Table The Save Table function saves tabular measurement data displayed on screen to an Excel or ASCII file. 1. From the menu bar, choose File > Save, then choose Table. 2. To save only one of the tables displayed, touch Source and navigate to the selection.
- Page 173 Save/Recall Data (File Menu) Save Screen Image The full touch screen display or selected portions of it can be captured, saved to an image file, and marked with custom annotations. 1. From the menu bar, choose File > Save, then choose Screen Image. 2.
- Page 174 HDO6000B High Definition Oscilloscopes Operator's Manual Auto Save Data that appears on the oscilloscope display, such as waveforms, measurement readouts and decoder data, can be very dynamic and difficult to read from the oscilloscope unless you stop the acquisition. Auto Save enables you to automatically store waveform and table data to file with each new trigger. The file can later be recalled to the oscilloscope or saved permanently to external storage.
-
Page 175: Recall
Setups saved to internal memory or to .LSS file can be recalled to restore the oscilloscope to the saved state. Waveform data stored in Teledyne LeCroy binary (.trc) or WaveML (.xml) format can be recalled directly to the display. Waveform data stored in other binary or ASCII file formats can be recalled into a memory and from there displayed. - Page 176 HDO6000B High Definition Oscilloscopes Operator's Manual Note: If a setup has been stored to a location, it is labeled with the save date/time. Otherwise, the slot is labeled Empty. Recall Setup from File 1. Choose to Recall From File. 2. Enter the path to the File, or touch Browse and navigate to the desired file.
-
Page 177: Labnotebook
Save/Recall Data (File Menu) LabNotebook The LabNotebook feature allows you to create and save composite files containing a screen capture of all displayed waveforms, as well as all waveform and setup data at the time of capture. The Flashback feature instantly recalls the setups and waveforms stored with LabNotebook Entries, enabling you to restore the exact state of the instrument at a later date to perform additional analysis. - Page 178 HDO6000B High Definition Oscilloscopes Operator's Manual 5. The system will auto name the file "MyLabNotebook" followed by a counter number. To change this to something more descriptive, enter the name in LabNotebook Entry, or touch Browse and use the File Browser.
- Page 179 Save/Recall Data (File Menu) Annotate Screen Image 1. Browse to and select the LabNotebook Entry. 2. Select View On/Off to preview the file. 3. From the top of the preview window, choose Annotate Screen Image and use the drawing tools. 4.
- Page 180 HDO6000B High Definition Oscilloscopes Operator's Manual Flashback Flashback restores the waveforms and setups saved with the LabNotebook Entry, so you can later analyze the inputs that resulted in that capture. For MAUI Studio Pro users, Flashback will also cause the oscilloscope application to simulate the oscilloscope on which the LabNotebook was originally captured, including all its installed software options.
- Page 181 Save/Recall Data (File Menu) LabNotebook Drawing Toolbar The basic LabNotebook is a screen capture of the display as it was at the time of entry, along with the setup and waveform data. If you have selected to Annotate Screen Image Before Saving, the capture is immediately displayed in the Drawing window.
-
Page 182: Report Generator
HDO6000B High Definition Oscilloscopes Operator's Manual Report Generator The Report Generator feature allows you to output a preformatted report consisting of an annotated screen image and a summary of the setups in place when it was captured. The report can be sourced from an existing LabNotebook, or it can be newly generated from the current state of the oscilloscope. -
Page 183: File Sharing Dialog (Send Email)
Save/Recall Data (File Menu) Generate from Current State If you are creating a report from the current state of the instrument, the procedure is much like that above, except that you will also be able to enter a new Description, Annotate Screen Image, and select your capture Area/Color Preferences as you would normally do when first creating a LabNotebook. -
Page 184: Print
HDO6000B High Definition Oscilloscopes Operator's Manual Print Print dialog settings control how the oscilloscope's front panel Print button behaves. Print captures an image of the touch screen display, but there are several options as to what it does next with the image: Send it to a Printer as formatted here. -
Page 185: Email & Report Settings
Save/Recall Data (File Menu) Email & Report Settings Configure oscilloscope email settings and report output on the Email & Report Settings dialog. Note: If using MAUI Studio Pro, these email settings can be pushed to a connected oscilloscope, but they will not affect email on your PC. -
Page 186: Using The File Browser
HDO6000B High Definition Oscilloscopes Operator's Manual Using the File Browser Selecting Browse on any of the File menu dialogs opens a File Browser that enables you to perform basic disk utility functions, as well as making file path/name and format selections. - Page 187 Save/Recall Data (File Menu) Example: Changing "Decode1-Table-0002" to "Decode1-CANFDTable-..." will reset the counter to "Decode1- CANFDTable-0000" if there is no prior file named "Decode1-CANFDTable-..." . Actions The Close button accepts the selections you made on the File Browser and closes the browser window. If you do not need to make further entries on the dialog to complete your task, you can choose to Save, Recall, Flashback, Email, etc.
-
Page 188: Trace File Format
HDO6000B High Definition Oscilloscopes Operator's Manual Trace File Format By default, the oscilloscope saves waveform data as binary files (.trc). The properties of the trace file are shown by the waveform descriptor block, which appears immediately after the file header. The waveform descriptor is the key to understanding the data that follows. - Page 189 Save/Recall Data (File Menu) Section Block ID Type Size Description 2: Extended file format # N nnnnnnnnnn The special character '#' ; then one Hexadecimal Header 11-17 digit N (0-9, A-F); then N decimal digits that If the waveform size is denote the positive integer size of this section.
- Page 190 HDO6000B High Definition Oscilloscopes Operator's Manual Offset Size (Bytes) Type Variable Name Description (bytes) string INSTRUMENT_NAME ULONG INSTRUMENT_NUMBER string TRACE_LABEL Waveform identifier long RESERVED_DATA_COUNT Reserved The following variables describe the waveform type and the time at which the waveform was generated.
- Page 191 Save/Recall Data (File Menu) Offset Size (Bytes) Type Variable Name Description (bytes) float HORIZ_UNCERTAINTY Uncertainty from one acquisition to the next, of the horizontal offset in seconds structure TRIGGER_TIME Time of the trigger, listed in the structure: double seconds; char minutes; char hours; char days; char months;...
- Page 192 HDO6000B High Definition Oscilloscopes Operator's Manual Offset Size (Bytes) Type Variable Name Description (bytes) int64 FIRST_POINT Indicates the data offset relative to the beginning of the trace buffer int64 SPARSING_FACTOR Indicates the sparsing into data block int64 SEGMENT_NO For Sequence waveforms, index of the segment...
-
Page 193: Utilities
The Service button to the far right of the dialog launches a section of the application reserved for qualified Teledyne LeCroy service personnel. An access code is required to enter this section. - Page 194 HDO6000B High Definition Oscilloscopes Operator's Manual Remote Control The Remote dialog contains settings to configure remote control of the instrument and also network access. Supported remote control protocols are: TCPIP (Ethernet). Choose this if you wish to connect to the oscilloscope remotely from MAUI Studio Pro. The instrument uses Dynamic Host Configuration Protocol (DHCP) as its default addressing protocol.
- Page 195 Utilities Export Contents of the Event Log 1. From the menu bar, choose Utilities > Utilities Setup, then touch the Remote tab. 2. Touch the Show Remote Control Log button. The Event Logs pop-up is shown. 3. Enter a log file name in DestFilename, or touch Browse and navigate to an existing file. Note: New contents will overwrite the existing content;...
- Page 196 HDO6000B High Definition Oscilloscopes Operator's Manual Date/Time Date/Time settings control the instrument's timestamp. These numbers appear in the message bar and on tables/records internal to the oscilloscope application, such as History Mode and WaveScan. Note: On Windows 10 oscilloscopes, first...
-
Page 197: Disk Utilities
Utilities Disk Utilities Use the Disk Utilities dialog to manage files and folders on your instrument's hard drive. Disk Space information is shown at the far right of the dialog for convenience. Note: These tasks can also be accomplished using the standard Microsoft Windows file management tools. Choose File >... -
Page 198: Preferences Dialogs
HDO6000B High Definition Oscilloscopes Operator's Manual Preferences Dialogs Preference settings have mostly to do with the appearance and performance of the instrument itself, rather than its interaction with other devices/systems. These settings are called "non-volatile," because they are not lost when the oscilloscope is restarted and do not change when a setup panel is recalled. - Page 199 Utilities You are using the oscilloscope in an environment more than ± 5 °C from the last known calibration temperature. It has been over six months since the previous manual calibration. From the menu bar, choose Utilities > Calibration. The Status section of the Calibration dialog will tell you if "Calibration is recommended"...
- Page 200 HDO6000B High Definition Oscilloscopes Operator's Manual Acquisition The Acquisition preference settings determine how traces behave as Vertical Offset or Horizontal Delay changes. Choose Utilities > Preference Setup to open the Acquisition dialog. Offset Setting constant in: Volts keeps the amount of Offset in the amount of Volts specified, regardless of the V/div setting. As the Offset is adjusted, the trace will appear to move up or down relative to the zero level.
- Page 201 Miscellaneous These other Preference settings are located on the Miscellaneous dialog. To add the Teledyne LeCroy logo to print output, check Print Teledyne LeCroy Logo When Printing Grid Area Only. This identifies the instrument as the source of the image.
-
Page 202: Wavesource Arbitrary Function Generator
HDO6000B High Definition Oscilloscopes Operator's Manual WaveSource Arbitrary Function Generator The WaveSource Arbitrary Function Generator allows you to output custom sine, square, triangle, pulse, DC, noise, and arbitrary waveforms from the oscilloscope. Connect a BNC cable from the WaveSource output on the back of the oscilloscope to the external device. Output is continuous once WaveSource is enabled. - Page 203 Utilities Arbitrary Waveform File Syntax Waveform files for use with WaveSource must be set up with header and data as shown in the image at left. Following the header, each line contains the sample point Xpos number and vertical value. Parameter Description Data Length...
-
Page 204: Digital Voltmeter
HDO6000B High Definition Oscilloscopes Operator's Manual Digital Voltmeter The Digital Voltmeter option activates an integrated 4-digit digital voltmeter and 5-digit frequency counter that operates through the same probes already attached to the oscilloscope channels. Note: You do not need to display the source channel trace to see the voltage readout on the DVM descriptor box and dialog. - Page 205 Utilities Set Up DVM 1. From the menu bar, choose Utilities > DVM. 2. Mark Enable to turn on the DVM function. 3. Touch Source and select the input channel to be measured. 4. Touch Mode and choose the waveform parameter to display on the readout. Options are: DC RMS AC RMS Frequency...
- Page 206 HDO6000B High Definition Oscilloscopes Operator's Manual...
-
Page 207: Maintenance
Maintenance Maintenance Topics in this section describe procedures for keeping the instrument in optimal working condition. Restart/Reboot Instrument To restart the oscilloscope application, choose File > Exit from the menu bar, then touch the Start DSO desktop shortcut. To reboot the instrument, which includes restarting the Windows OS: 1. -
Page 208: Windows 10 External Display Setup
HDO6000B High Definition Oscilloscopes Operator's Manual Windows 10 External Display Setup The Windows 10 default is to treat any external monitor connected to a Windows 10 PC as the primary touch screen. On Windows 10 oscilloscopes with an external monitor attached, you will have to manually change the display settings so that the oscilloscope is recognized as a touch screen. -
Page 209: Software And File Management
Maintenance 7. Touch the oscilloscope display. You will see the instruction: "Press Enter to proceed to the next step to complete your configuration." 8. Press Enter. 9. If you wish to also configure the external display as a touch screen, repeat this procedure selecting the external monitor name from the Display field on the Tablet PC Setup dialog. -
Page 210: Switching Windows Users
LeCroyUser (and any other new users you create) an Administrator. MAUI Firmware Update The MAUI Software Setup Wizard can be used to install Teledyne LeCroy desktop software or oscilloscope firmware, including the MAUI application, required DLLs, device drivers and low-level microcode for integrated circuits. Follow these instructions for an oscilloscope firmware update. - Page 211 Maintenance Installation Instructions 1. From the oscilloscope menu bar, choose File > Exit to close MAUI. 2. Browse to MAUI Installer64_<version>.exe and double-click it to launch the setup wizard. 3. On Windows 10 instruments running as a Standard user (the default state), enter the Password SCOPEADMIN (all uppercase).
-
Page 212: Technical Support
Resources Teledyne LeCroy publishes a free Technical Library on its website. Manuals, tutorials, application notes, white papers, and videos are available to help you get the most out of your Teledyne LeCroy products. Visit: teledynelecroy.com/support/techlib The Datasheet published on the product page contains the detailed product specifications. -
Page 213: Returning A Product For Service
3. Pack the instrument in its original shipping box, or an equivalent carton with adequate padding to avoid damage in transit. Do not include the manual. 4. Mark the outside of the box with the shipping address given to you by Teledyne LeCroy. Be sure to add the following: ATTN: <RMA code assigned by Teledyne LeCroy>... -
Page 214: Certifications
HDO6000B High Definition Oscilloscopes Operator's Manual Certifications Teledyne LeCroy certifies compliance to the following standards as of the time of publication. See the EC Declaration of Conformity document shipped with your product for the current certifications. EMC Compliance EC Declaration of Conformity- EMC The instrument meets the intent of EC Directive 2014/30/EU for Electromagnetic Compatibility. -
Page 215: Safety Compliance
Certifications Australia & New Zealand Declaration of Conformity– EMC The instrument complies with the EMC provision of the Radio Communications Act per the following standards, in accordance with requirements imposed by Australian Communication and Media Authority: AS/NZS CISPR 11:2015, Radiated and Conducted Emissions, Group 1, Class A USTRALIA EALAND ONTACTS... -
Page 216: Environmental Compliance
The product is subject to disposal and recycling regulations that vary by country and region. Many countries prohibit the disposal of waste electronic equipment in standard waste receptacles. For more information about proper disposal and recycling of your Teledyne LeCroy product, please visit teledynelecroy.com/recycle. -
Page 217: Index
Index Index channel 48 descriptor box 19 frequency 11 persistence 26 setup 49 cleaning 2 acquisition clock optimiztion 192 external 61 pre-processing 19, 50 reference 61 sampling mode 56 sample 61 settings 194 color 195 action toolbar 20 persistence 26 activating traces 28 compliance 208 altitude 2... - Page 218 HDO6000B High Definition Oscilloscopes Operator's Manual dialogs 20 frequency 134 display 13, 22, 201 response 11, 141 controls 22, 195 front panel 195 extended 13, 25 gain 49, 194 grid 17, 22 gating measurements 89 optimization 192 GPIB 188 persistence 26...
- Page 219 Index interfaces 10 pass/fail testing 159, 161 ProBus 10 processing web 111 interpolation 50, 143 readout 86 inversion 19, 50 statistics 88 IP address 13, 188 measurements; status 86 measuring terminals 2 labelling traces 30, 175 memory 151-152, 163, 165 LabNotebook 16, 171, 175 descriptor box 19 recall 172...
- Page 220 HDO6000B High Definition Oscilloscopes Operator's Manual post-trigger delay 56 RoHS 210 power roll sampling mode 58 ratings 3 safety 209 standby 12 sample clock 14, 61 pre-processing 19 sample points 56, 143 pre-trigger delay 56 sample rate 56, 58 preferences 192...
- Page 221 Index on/off 12 TRC files 151 status 187 trend 121, 123 timestamp 190 trigger 64 automating 76 tables 166 controls 64, 66, 73 auto save 168 counter 73, 194 TCP/IP 13 delay 56 technical support 206-207 descriptor box 20 temperature 2 holdoff 73 third-party software 203 software assisted 75...
- Page 222 HDO6000B High Definition Oscilloscopes Operator's Manual WaveStudio 195 WEEE 210 Windows networking 13 power settings 12 Windows 10 201-204 XY plots 23 zoom 34, 44 controls 34, 195 descriptor box 19 multi-zoom 34 undo 16...
Need help?
Do you have a question about the HDO6000B and is the answer not in the manual?
Questions and answers