Anritsu Field Master Pro MS2090A Measurement Manual
Pulse analyzer
Hide thumbs
Also See for Field Master Pro MS2090A:
- Measurement manual (158 pages) ,
- Programming manual (152 pages) ,
- User manual (112 pages)
Table of Contents
Advertisement
Quick Links
Measurement Guide
Pulse Analyzer
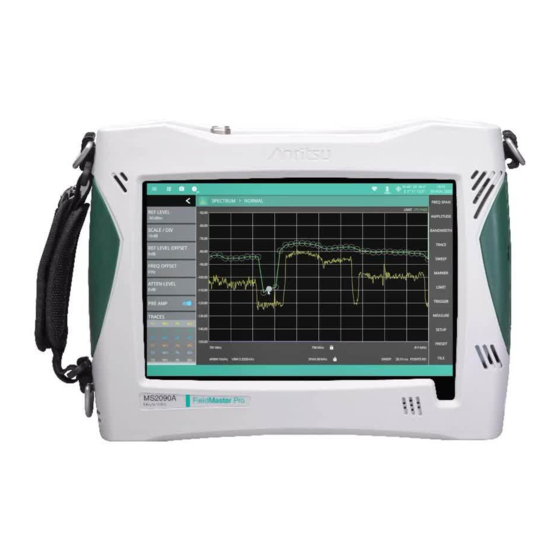
MS2090A Field Master Pro™
Pulse Analyzer
Not all instrument models offer every option or every measurement within a given option. Refer to
Note
the Technical Data Sheet of your instrument for available options and supported measurements.
Anritsu Company
490 Jarvis Drive
Morgan Hill, CA 95037-2809
USA
Option 421
Part Number: 10580-00451
Revision: A
Published: October 2022
Copyright 2022 Anritsu Company
Advertisement
Table of Contents

Subscribe to Our Youtube Channel
Related Manuals for Anritsu Field Master Pro MS2090A


Summary of Contents for Anritsu Field Master Pro MS2090A
- Page 1 Not all instrument models offer every option or every measurement within a given option. Refer to Note the Technical Data Sheet of your instrument for available options and supported measurements. Anritsu Company Part Number: 10580-00451 490 Jarvis Drive Revision: A Morgan Hill, CA 95037-2809 Published: October 2022 Copyright 2022 Anritsu Company...
- Page 2 Anritsu Company. Export Management The Anritsu products identified herein and their respective manuals may require an Export License or approval by the government of the product country of origin for re-export from your country. Before you export these products or any of their manuals, please contact Anritsu Company to confirm whether or not these items are export-controlled.
-
Page 3: Table Of Contents
Contacting Anritsu for Sales and Service ........ - Page 4 Table of Contents (Continued) 2-11 Setting Trace Parameters ........... . 2-20 Traces in Pulse Mode (Pulse Analyzer View) .
-
Page 5: Chapter 1-General Information
Chapter 1 — General Information Introduction This measurement guide gives a brief overview of the Pulse Analyzer measurement functions of the Anritsu Field Master series handheld instruments and is intended to assist you in setting up a pulse measurement. For a detailed description of how the pulse measurements are calculated, refer to Section 2-4 “Pulse... -
Page 6: Illustrations
The actual displays, screen menus, and measurement details may differ based on the instrument, model, firmware version, installed options, and current instrument settings. Contacting Anritsu for Sales and Service To contact Anritsu, visit the following URL and select the services in your region: http://www.anritsu.com/contact-us PN: 10580-00451 Rev. A... -
Page 7: Chapter 2-Pulse Analyzer (Option 421)
Chapter 2 — Pulse Analyzer (Option 421) Introduction This chapter gives a brief overview of the Anritsu Field Master Series pulse analyzer and is intended to assist you in setting up a pulse measurement. This chapter describes pulse references for making pulse measurements, including selecting the analyzer and setting up frequency, bandwidth, amplitude, sweep, limit and markers. -
Page 8: Pulse Trace Profile And Summary Data
2-3 Pulse Analyzer GUI Overview Pulse Analyzer (Option 421) Pulse Trace Profile and Summary Data The following figures show overviews of various Pulse Analyzer views: • Figure 2-2, “Positive Pulse Trace with Measurement Summary Data (Pulse Analyzer View)”shows an overview of the trace and summary data for a positive pulse type. •... - Page 9 Pulse Analyzer (Option 421) 2-3 Pulse Analyzer GUI Overview Positive Pulse 1. Level Reference: Top and bottom level references are used as a basis for all other references. These can be set to Auto or User. When set to User, the dashed blue lines (S1 and S2) are in use. •...
- Page 10 2-3 Pulse Analyzer GUI Overview Pulse Analyzer (Option 421) Negative Pulse 1. Status Panel: The pulse analyzer shares the spectrum analyzer status panel, displaying general settings for the current measurement. Refer to Section 2-6 “Status Panel” on page 2-12. 2. First Transition Measurement Characteristics: The first pulse transition is shown in a green shaded area with measurement points and labels displayed on the currently selected trace and measurement data in the corresponding summary table.
- Page 11 Pulse Analyzer (Option 421) 2-3 Pulse Analyzer GUI Overview Negative Pulse 1. Level Reference: Top and bottom level references are used as a basis for all other references. These can be set to Auto or User. When set to User, the dashed blue lines (S1 and S2) are in use. •...
-
Page 12: Pulse Measurements
2-4 Pulse Measurements Pulse Analyzer (Option 421) Pulse Measurements Finding the High/Low Reference Levels Using the Histogram Algorithm When the pulse level type is set to AUTO a histogram algorithm method is used for determining the high and low state levels as described in the IEEE Standard for Pulses, Transitions, and Related Waveforms (181-2011), Section 5.2.1. -
Page 13: Finding The Reference Level Instants
Pulse Analyzer (Option 421) 2-4 Pulse Measurements Finding the Reference Level Instants Instants are a specific time value within a waveform time duration. They are typically referenced relative to the initial instant of the waveform. The following sections describe how the pulse measurements are determined (see Figure 2-7 Figure... - Page 14 2-4 Pulse Measurements Pulse Analyzer (Option 421) Finding Pulse Duration and Period The pulse duration is determined by using the positive and negative transitions as describe above to check if it is a valid pulse. If so, then any pulse duration reference levels (50%) are verified to exist within the positive/negative transition.
- Page 15 Pulse Analyzer (Option 421) 2-4 Pulse Measurements Finding the Wave Amplitude The wave amplitude is found by subtracting the amplitude of the lower state level from the amplitude of the upper state level in dB units. Finding the Peak to Wave Average The peak to wave average is found by subtracting the wave average from the pulse peak in terms of dB.
-
Page 16: Tips For Improving Pulse Measurement Results
2-4 Pulse Measurements Pulse Analyzer (Option 421) Finding the Overshoot and Undershoot of Each Aberration Region The overshoot and undershoot of each region are calculated by taking the difference between the maximum and minimum trace value of each aberration region and the local state level. Local state level being (Low = pre-transition ... -
Page 17: Main Menu
Pulse Analyzer (Option 421) 2-5 Main Menu Main Menu The main menu is the primary access point for all instrument controls and measurement selections. The main function for each main menu button is described below. FREQ SPAN: Contains all frequency control settings such as center frequency, start and stop frequency, span, frequency offset, and frequency step. -
Page 18: Status Panel
2-6 Status Panel Pulse Analyzer (Option 421) Status Panel The status panels and features illustrated in this section are unique to the spectrum analyzer and to the particular measurement and view that is selected. Below is the spectrum analyzer status panel that covers basic spectrum, spectrogram, channel power, occupied bandwidth, adjacent channel power, and spectral emissions mask measurements (selected via MEASURE >... -
Page 19: Connecting A Signal Source
Pulse Analyzer (Option 421) 2-7 Connecting a Signal Source Connecting a Signal Source The basic setup starts with connecting a signal source to the RF In port of the instrument. For over-the-air measurements, connect an antenna that is appropriate for the frequency range to be measured. For direct conducted measurements, ensure the RF source does not over power the input of the analyzer. -
Page 20: Freq Span Menu
2-8 Setting Frequency Parameters Pulse Analyzer (Option 421) FREQ SPAN Menu CENTER FREQUENCY: Sets the center frequency of the sweep range. FREQUENCY STEP: Sets the frequency step value used for the plus (+) or minus (–) control. FREQUENCY OFFSET: The frequency offset value accounts for frequency conversions outside of the analyzer. -
Page 21: Setting Amplitude Parameters
Pulse Analyzer (Option 421) 2-9 Setting Amplitude Parameters Setting Amplitude Parameters Amplitude-related parameters are set using the “AMPLITUDE Menu” on page 2-17. Setting Amplitude Reference Level The amplitude reference level is typically an absolute reference level set at the top of the graticule for the power level being measured. -
Page 22: Preamplifier
2-9 Setting Amplitude Parameters Pulse Analyzer (Option 421) Preamplifier The preamplifier can be turned on and off by toggling PRE AMP via the status panel or the AMPLITUDE menu. Figure 2-16 shows the noise floor with the preamplifier off (1) and on (2). Note that when the preamplifier is turned on, the noise floor drops significantly and a low-level signal is exposed. -
Page 23: Amplitude Menu
Pulse Analyzer (Option 421) 2-9 Setting Amplitude Parameters AMPLITUDE Menu REF LEVEL: The reference level is the top graticule line on the measurement display. If the reference level offset is not zero, the offset reference level is displayed at this location. -
Page 24: 2-10 Setting Bandwidth Parameters
2-10 Setting Bandwidth Parameters Pulse Analyzer (Option 421) 2-10 Setting Bandwidth Parameters Bandwidth parameters are set using the “BANDWIDTH Menu” on page 2-19. Resolution Bandwidth Resolution Bandwidth (RBW) determines frequency selectivity. The spectrum analyzer traces the shape of the RBW filter as it tunes past a signal. The choice of resolution bandwidth depends on several factors. Filters take time to settle. -
Page 25: Bandwidth Menu
Pulse Analyzer (Option 421) 2-10 Setting Bandwidth Parameters Auto coupling VBW links the video bandwidth to the resolution bandwidth so that VBW varies in proportion to RBW. If manual VBW coupling is selected, the VBW label at the bottom of the graph is prefixed with the “#” symbol and video bandwidth is set independently of resolution bandwidth. -
Page 26: Setting Trace Parameters
2-11 Setting Trace Parameters Pulse Analyzer (Option 421) 2-11 Setting Trace Parameters Field Master Series instrument can display up to six traces simultaneously. Traces can be enabled from the TRACE menu by selecting the trace from the available selections, or you can select a trace in the Status panel to make it active. -
Page 27: Trace Menu
Pulse Analyzer (Option 421) 2-11 Setting Trace Parameters TRACE Menu SELECT: Selects traces 1 through 6. Selecting a trace that is off turns the trace on. The trace type will be Clear/Write, the trace mode will be Active, and the detector type will be Peak. -
Page 28: Trace Detector Types
2-11 Setting Trace Parameters Pulse Analyzer (Option 421) Trace Detector Types The figure below shows the available detector types: Sampled Frequency Point Data Time Sampled Frequency Point Data Time Sampled Frequency Point Data Time 1. Green trace set to Peak detection. 2. -
Page 29: 2-12 Setting Sweep Parameters
Pulse Analyzer (Option 421) 2-12 Setting Sweep Parameters 2-12 Setting Sweep Parameters Sweep parameters are set using the “SWEEP Menu” on page 2-23. Single/Continuous When the Continuous toggle is pressed, the instrument toggles between single sweep and continuous sweep. In single sweep setting, the instrument waits until SWEEP ONCE is pressed or another setting is selected. -
Page 30: Setting Up Markers (Pulse Viewer Mode)
2-13 Setting Up Markers (Pulse Viewer Mode) Pulse Analyzer (Option 421) 2-13 Setting Up Markers (Pulse Viewer Mode) The MARKER menu is only available when the view mode is set to Pulse Viewer (refer to Section 2-15 “Measurement Setup” on page 2-31). -
Page 31: Placing A Normal Marker
Pulse Analyzer (Option 421) 2-13 Setting Up Markers (Pulse Viewer Mode) Placing a Normal Marker Press MARKER to display markers. If markers were off, Marker 1 will automatically be made active at the center of the time display. Select another marker using MARKER > SELECT, then select one of 12 available markers. If the marker was off, the marker will be made active and be placed at the center of the time display. -
Page 32: Marker Menu
2-13 Setting Up Markers (Pulse Viewer Mode) Pulse Analyzer (Option 421) MARKER Menu PEAK SEARCH: Opens the “MARKER PEAK SEARCH Menu” on page 2-27. SELECT: Turns on the selected marker if it is off or makes it the active marker if it is already turned on. -
Page 33: Marker Peak Search Menu
Pulse Analyzer (Option 421) 2-13 Setting Up Markers (Pulse Viewer Mode) MARKER PEAK SEARCH Menu Note Double tapping a marker opens a quick peak search menu with some of the below features. PEAK SEARCH: Returns to the main MARKER menu. SELECT: If the selected marker is off, it will be turned on and the selected marker positioned at the peak of Trace 1. -
Page 34: Marker Functions
2-13 Setting Up Markers (Pulse Viewer Mode) Pulse Analyzer (Option 421) Marker Functions Noise Markers Noise Markers use an averaging routine applied to multiple data-point groups to calculate the readout, which is typically comparable to using 1 Hz bandwidth filtering. Because the noise marker routine uses groups of data points for the calculation, the noise marker should not be placed in close proximity to measurable signals. -
Page 35: 2-14 Setting Up Triggering
Pulse Analyzer (Option 421) 2-14 Setting Up Triggering 2-14 Setting Up Triggering Trigger parameters are set using the “TRIGGER Menu” on page 2-29. TRIGGER Menu SOURCE: The SOURCE button offers several triggering options depending on which view mode the instrument is set: •... - Page 36 2-14 Setting Up Triggering Pulse Analyzer (Option 421) Positive Edge Trigger High Threshold Hysteresis Level Not Triggered Low Threshold Negative Edge Trigger Figure 2-28. Trigger Levels and Hysteresis 2-30 PN: 10580-00451 Rev. A Pulse Analyzer MG...
-
Page 37: 2-15 Measurement Setup
Pulse Analyzer (Option 421) 2-15 Measurement Setup 2-15 Measurement Setup Refer to Spectrum Analyzer measurement guide (10580-00447) for basic information on setting up a spectrum measurement. This section provides setup information for the Pulse measurement. MEASURE Menu VIEW: Selects Pulse Analyzer or Pulse Viewer. Pulse Analyzer view provides the signal trace with pulse instant and transition indicators on the trace along with pulse analytics below the trace display. -
Page 38: Pulse Simulation Menu
2-15 Measurement Setup Pulse Analyzer (Option 421) PULSE SIMULATION Menu SIMULATION: Toggles pulse simulation on or off. When simulation mode is on, the analyzer stops sweeping and displays an example trace to show the Pulse Analyzer measurement capabilities. WAVEFORM TYPE: Selects the desired waveform type. You can select a single positive, or a single negative pulse, pulse train, or double pulse. - Page 39 Pulse Analyzer (Option 421) 2-15 Measurement Setup Figure 2-33. Double Pulse Waveform Simulation (Pulse Viewer) Pulse Analyzer MG PN: 10580-00451 Rev. A 2-33...
-
Page 40: Display Menu
2-15 Measurement Setup Pulse Analyzer (Option 421) DISPLAY Menu REF HIGH: Toggles the high level reference line on or off. DURATION REF: Toggles the duration reference line on or off. REF LOW: Toggles the low level reference line on or off. POST-T OVER: Toggles the post-transition overshoot marker on or off. -
Page 41: 2-16 Presetting The Analyzer
Pulse Analyzer (Option 421) 2-16 Presetting the Analyzer 2-16 Presetting the Analyzer The PRESET menu sets certain settings to the default state. Preset only affects the current analyzer settings, such as those for the spectrum analyzer or for the 5GNR analyzer. Preset does not affect user files or system settings such as networking settings. -
Page 42: 2-17 Saving And Recalling Measurements
2-17 Saving and Recalling Measurements Pulse Analyzer (Option 421) 2-17 Saving and Recalling Measurements The Field Master Pro can save measurement setups, native trace and CSV trace data, and screenshots. You can recall setup and native trace files. For other file operations such as copy, move, and directory management, refer to “File Management”... -
Page 43: Recalling A Measurement
Pulse Analyzer (Option 421) 2-17 Saving and Recalling Measurements Recalling a Measurement You can recall a saved setup and native trace measurement. When recalling a setup, the instrument setup and operating state will be restored as it was when the setup was saved. When recalling a trace measurement, the instrument setup and on-screen measurement data will be restored as it was when the trace data was saved. -
Page 44: File Menu
2-17 Saving and Recalling Measurements Pulse Analyzer (Option 421) FILE Menu QUICK SAVE: saves a setup file immediately with the name shown in the button. The number in the name is incremented automatically so that the new name is ready for the next setup file to be saved. - Page 46 Anritsu Company 490 Jarvis Drive Anritsu utilizes recycled paper and environmentally conscious inks and toner. Morgan Hill, CA 95037-2809 http://www.anritsu.com...
Need help?
Do you have a question about the Field Master Pro MS2090A and is the answer not in the manual?
Questions and answers