Anritsu Field Master Pro MS2090A Measurement Manual
Real-time spectrum analyzer
Hide thumbs
Also See for Field Master Pro MS2090A:
- Measurement manual (158 pages) ,
- Programming manual (152 pages) ,
- User manual (112 pages)
Table of Contents
Advertisement
Quick Links
Measurement Guide
Real-Time Spectrum Analyzer (RTSA)
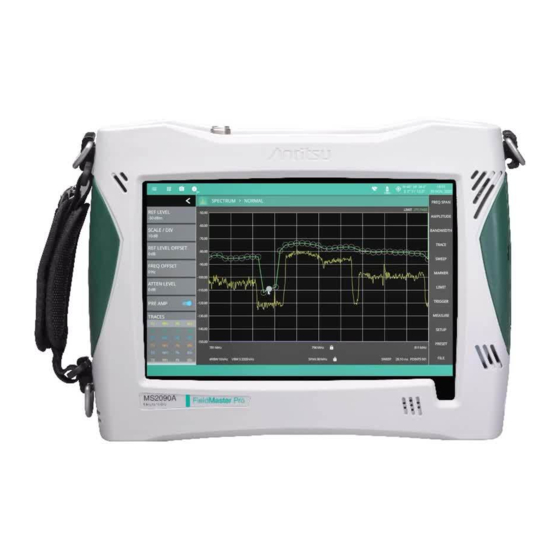
MS2090A Field Master Pro™
Real-Time Spectrum Analyzer
Interference Finder
Not all instrument models offer every option or every measurement within a given option. Refer to
Note
the Technical Data Sheet of your instrument for available options and supported measurements.
Anritsu Company
490 Jarvis Drive
Morgan Hill, CA 95037-2809
USA
Option 199
Option 24
Part Number: 10580-00448
Revision: A
Published: October 2022
Copyright 2022 Anritsu Company
Advertisement
Table of Contents

Related Manuals for Anritsu Field Master Pro MS2090A


Summary of Contents for Anritsu Field Master Pro MS2090A
- Page 1 Not all instrument models offer every option or every measurement within a given option. Refer to Note the Technical Data Sheet of your instrument for available options and supported measurements. Anritsu Company Part Number: 10580-00448 490 Jarvis Drive Revision: A Morgan Hill, CA 95037-2809 Published: October 2022 Copyright 2022 Anritsu Company...
- Page 2 Anritsu Company. Export Management The Anritsu products identified herein and their respective manuals may require an Export License or approval by the government of the product country of origin for re-export from your country. Before you export these products or any of their manuals, please contact Anritsu Company to confirm whether or not these items are export-controlled.
-
Page 3: Table Of Contents
Contacting Anritsu for Sales and Service ........ - Page 4 Table of Contents (Continued) 2-10 Setting Trace and Cursor Parameters ......... . 2-16 Traces in Normal View.
- Page 5 Table of Contents (Continued) 2-19 Saving and Recalling Measurements ......... . . 2-60 Saving a Measurement .
- Page 6 Contents-4 PN: 10580-00448 Rev. A Real-TimeSpectrum Analyzer MG...
-
Page 7: Chapter 1-General Information
This measurement guide describes the real time spectrum analyzer (RTSA) measurement functions of the Anritsu Field Master series handheld instruments and remote spectrum monitors. Real-Time spectrum analyzer functions are available when option 199 is purchased with the instruments. Advanced functions are available only when the related option is installed and activated. -
Page 8: Illustrations
The actual displays, screen menus, and measurement details may differ based on the instrument, model, firmware version, installed options, and current instrument settings. Contacting Anritsu for Sales and Service To contact Anritsu, visit the following URL and select the services in your region: http://www.anritsu.com/contact-us PN: 10580-00448 Rev. A... -
Page 9: Chapter 2-Real-Time Spectrum Analyzer (Option 199)
(Option 199) Introduction This chapter gives a brief overview of the Anritsu Field Master Series real-time spectrum analyzer. The purpose of this chapter is to provide a starting point for making basic measurement setups. This chapter describes general instrument setup, including selecting the analyzer and setting up frequency, bandwidth, amplitude, span, limit lines, and markers. -
Page 10: Rtsa Gui Overview
2-3 RTSA GUI Overview Real-Time Spectrum Analyzer (Option 199) RTSA GUI Overview This section illustrates the main graphical displays and menus presented for the RTSA. Normal RTSA View Normal RTSA view is the default view and is suitable for viewing signals in the frequency domain where signal amplitude, bandwidth, and harmonic qualities can be studied. - Page 11 Real-Time Spectrum Analyzer (Option 199) 2-3 RTSA GUI Overview 1. Status Panel: Each measurement features a unique status panel that displays settings and information relevant to the current measurement and view settings. 2. Markers: Markers are displayed as green diamonds on the trace to which they are assigned. The active marker is shown as a solid green diamond with a dashed vertical line.
-
Page 12: Spectrogram View
2-3 RTSA GUI Overview Real-Time Spectrum Analyzer (Option 199) Spectrogram View Spectrogram view is useful for identifying intermittent signals and for providing historical signal data in a comprehensive view. It provides a multi-dimensional “waterfall” display representing frequency, time, and amplitude. Frequency and time are shown on a typical two-dimensional scale while amplitude is displayed in the color dimension. -
Page 13: Main Menu
Real-Time Spectrum Analyzer (Option 199) 2-4 Main Menu Main Menu The main menu is the primary access point for all instrument controls and measurement selections. The main function for each main menu button is described below. FREQ SPAN: Contains all frequency control settings such as center frequency, start and stop frequency, span, frequency offset, and frequency step. -
Page 14: Status Panel
2-5 Status Panel Real-Time Spectrum Analyzer (Option 199) Status Panel The status panels and features illustrated in this section are unique to the real-time spectrum analyzer and to the selected measurement and view. Below is the RTSA status panel that covers normal and spectrogram views, in addition to audio AM/FM and interference measurements (selected via MEASURE >... -
Page 15: Making Rtsa Measurements
Real-Time Spectrum Analyzer (Option 199) 2-6 Making RTSA Measurements Making RTSA Measurements The following sections of this chapter provide a detailed information of the RTSA measurements and the setup parameters. Connecting a Signal Source The basic setup starts with connecting a signal source to the RF In port of the instrument. For over-the-air (OTA) measurements, connect an antenna that is appropriate for the frequency range to be measured. -
Page 16: Entering A Center Frequency
2-7 Setting Frequency Parameters Real-Time Spectrum Analyzer (Option 199) Entering a Center Frequency Press FREQ SPAN on the main menu. Press CENTER FREQUENCY to open the center frequency parameter entry keypad. Enter the desired center frequency. When entering a frequency with the keypad, available frequency units (GHz, MHz, kHz, and Hz) will be displayed along the left and right edge of the menu. -
Page 17: Freq / Span Menu
Real-Time Spectrum Analyzer (Option 199) 2-7 Setting Frequency Parameters FREQ / SPAN Menu CENTER FREQUENCY: Sets the center frequency of the sweep range. The current span setting will remain constant or will be adjusted to accommodate the start and stop frequency range of the instrument. -
Page 18: Setting Amplitude Parameters
2-8 Setting Amplitude Parameters Real-Time Spectrum Analyzer (Option 199) Setting Amplitude Parameters The amplitude scale corresponds to the y-axis display. The Real-TimeSpectrum Analyzer supports log units such as dBm and dBV. Amplitude-related parameters are set using the “AMPLITUDE Menu” on page 2-13. -
Page 19: Reference Level Offset For External Loss Or External Gain
Real-Time Spectrum Analyzer (Option 199) 2-8 Setting Amplitude Parameters Reference Level Offset for External Loss or External Gain To obtain accurate measurements, you can compensate for any external attenuation or gain by using a reference level offset. The compensation factor is always in dB, even if linear amplitude units are selected. External attenuation can be created by using an external cable or an external high power attenuator. -
Page 20: Preamplifier
2-8 Setting Amplitude Parameters Real-Time Spectrum Analyzer (Option 199) Preamplifier The preamplifier can be turned on and off by toggling PRE AMP via the status panel or the AMPLITUDE menu. Figure 2-8 shows the noise floor with the preamplifier off (1) and on (2). Note that when the preamplifier is turned on, the noise floor drops significantly and a low-level signal is exposed. -
Page 21: Amplitude Menu
Real-Time Spectrum Analyzer (Option 199) 2-8 Setting Amplitude Parameters AMPLITUDE Menu REF LEVEL: The reference level is the top graticule line on the measurement display. If the reference level offset is not zero, the offset reference level is displayed at this location. -
Page 22: Setting Bandwidth Parameters
2-9 Setting Bandwidth Parameters Real-Time Spectrum Analyzer (Option 199) Setting Bandwidth Parameters Bandwidth parameters are set using the “BANDWIDTH Menu” on page 2-15. Resolution Bandwidth Resolution Bandwidth (RBW) determines frequency selectivity. The spectrum analyzer traces the shape of the RBW filter as it tunes past a signal. The choice of resolution bandwidth depends on several factors. Filters take time to settle. -
Page 23: Bandwidth Menu
Real-Time Spectrum Analyzer (Option 199) 2-9 Setting Bandwidth Parameters BANDWIDTH Menu AUTO RBW: When toggled on, the instrument selects the resolution bandwidth based on the current span width. The ratio of span width to RBW can be specified using the SPAN:RBW button. -
Page 24: 2-10 Setting Trace And Cursor Parameters
2-10 Setting Trace and Cursor Parameters Real-Time Spectrum Analyzer (Option 199) 2-10 Setting Trace and Cursor Parameters Field Master Series can display up to 6 traces simultaneously. Traces can be enabled from the TRACE menu by selecting the trace from the available selections, or you can select a trace in the Status panel to make it active. -
Page 25: Trace Menu (Normal View)
Real-Time Spectrum Analyzer (Option 199) 2-10 Setting Trace and Cursor Parameters TRACE Menu (Normal View) SELECT: Selects traces 1 through 6. Selecting a trace that is off turns the trace on. The trace type will be Clear/Write, the trace mode will be Active, and the detector type will be Peak. - Page 26 2-10 Setting Trace and Cursor Parameters Real-Time Spectrum Analyzer (Option 199) DETECTOR TYPE: Selects one of the available detector types. Several detection methods tailor the function of the instrument to meet specific measurement requirements. There are often more measurement points across the screen than display points. The various detection methods are different ways of showing each display point (see “Trace Detector Types”...
-
Page 27: Trace Detector Types
Real-Time Spectrum Analyzer (Option 199) 2-10 Setting Trace and Cursor Parameters Trace Detector Types The figures below illustrate how the selected detector type determine a trace data point from the sampled data. Peak Detector Shows the maximum amplitude of sampled data for each display point, assuring that a narrow peak is not missed. Peak Detection Odd Display Point Sampling Interval Even Display Point Sampling Interval Odd Display Point Sampling Interval Frequency/Time... - Page 28 2-10 Setting Trace and Cursor Parameters Real-Time Spectrum Analyzer (Option 199) Sample Shows the transient amplitude of the center of sampled data for each display point. This method is useful when measuring low-level signals and noise measurements. Only available in zero span and RSSI measurements. Sample Detection Odd Display Point Sampling Interval Even Display Point Sampling Interval Odd Display Point Sampling Interval Frequency/Time...
- Page 29 Real-Time Spectrum Analyzer (Option 199) 2-10 Setting Trace and Cursor Parameters Normal Shows random noise and signal data depending on the nature of the sampled data. If the signal both rises and falls during the sampling interval (random noise), then odd-numbered sampling intervals display the maximum value and even-numbered sampling intervals display the minimum value.
-
Page 30: Cursors In Spectrogram View
2-10 Setting Trace and Cursor Parameters Real-Time Spectrum Analyzer (Option 199) Cursors in Spectrogram View The screenshot below shows the Real-TimeSpectrum Analyzer with all six cursors enabled on a signal. Cursors are shown on the spectrogram as white lines. The active cursor is a solid white line and other cursors show as dashed white lines. -
Page 31: Trace Menu (Spectrogram View)
Real-Time Spectrum Analyzer (Option 199) 2-10 Setting Trace and Cursor Parameters TRACE Menu (Spectrogram View) When the combined Spectrogram view is selected (MEASURE > VIEW > SPECTROGRAM), the TRACE and SETUP menus are updated with spectrogram and cursor setup controls. TYPE: Selects one of the following types of traces: •... -
Page 32: Trace Cursor Menu
2-10 Setting Trace and Cursor Parameters Real-Time Spectrum Analyzer (Option 199) CLEAR: Clears the currently active trace data. AVERAGES: Sets the number of trace sweeps (N) to average. Available when the trace type is set to one of the averaging modes. PRESET TRACES: Presets cursor and trace setup to Clear/Write, Active, with Peak Detector. -
Page 33: Trace Recording, Playback, And Csv Logging
Real-Time Spectrum Analyzer (Option 199) 2-10 Setting Trace and Cursor Parameters Trace Recording, Playback, and CSV Logging In real time spectrum analyzer mode, the Real-TimeSpectrum Analyzer supports recording and playing back of trace data. Recordings are actually made on sample data (not just trace points) so during playback, users can set different trace types or detectors for deeper analysis of the data. - Page 34 2-10 Setting Trace and Cursor Parameters Real-Time Spectrum Analyzer (Option 199) 1. Recorded trace and spectrum waterfall. 8. Starts playback of the selected trace recording. During playback, the button changes to the PAUSE 2. Shows either the Recording or Playback indicator. button, allowing pausing of the playback.
- Page 35 Real-Time Spectrum Analyzer (Option 199) 2-10 Setting Trace and Cursor Parameters CSV Logging CSV logging provides much of the same functionality as trace recording described above, but a CSV log cannot be replayed. CSV logging allows continuous recording of either live trace data or playback trace data to a CSV file with frequency and amplitude information for all traces captured during the logging period.
-
Page 36: Trace Record Menu
2-10 Setting Trace and Cursor Parameters Real-Time Spectrum Analyzer (Option 199) TRACE RECORD Menu The trace recording feature is accessed via the TRACE > RECORD menus. This feature allows you to record a trace for future playback on the instrument or PC application. RECORD: Starts a trace recording session and saves traces and setup data to a record file (.fmrec). -
Page 37: Trace Playback Menu
Real-Time Spectrum Analyzer (Option 199) 2-10 Setting Trace and Cursor Parameters TRACE PLAYBACK Menu The trace playback feature is accessed via the TRACE > PLAYBACK menus. This feature allows you to play back a recorded trace (.fmrec) file on the instrument or PC application. A playback session must be started by first recalling a previously recorded session. -
Page 38: Trace Csv Logging Menu
2-10 Setting Trace and Cursor Parameters Real-Time Spectrum Analyzer (Option 199) TRACE CSV LOGGING Menu The trace CSV capture feature is accessed via the TRACE > CSV CAPTURE menus. This feature allows you to capture trace data in comma separated value (.csv) format. RECORD: Starts a recording session and saves trace and setup data to a CSV file (.csv). -
Page 39: Setting Sweep Parameters
Real-Time Spectrum Analyzer (Option 199) 2-11 Setting Sweep Parameters 2-11 Setting Sweep Parameters Sweep parameters are set using the “SWEEP Menu” on page 2-31. Single/Continuous When the CONTINUOUS toggle is pressed, the instrument toggles between single sweep and continuous sweep. In single sweep setting, the instrument waits until SWEEP ONCE is pressed or another setting is selected before updating the trace display. -
Page 40: 2-12 Setting Up Markers
2-12 Setting Up Markers Real-Time Spectrum Analyzer (Option 199) 2-12 Setting Up Markers Marker parameters are set using the “MARKER Menu” on page 2-34. Refer to the figure below when working with this section. 1. Normal spectrum view marker information display. 2. -
Page 41: Placing A Normal Marker
Real-Time Spectrum Analyzer (Option 199) 2-12 Setting Up Markers Placing a Normal Marker Press MARKER to display markers. If markers were off, Marker 1 will automatically be made active at the current center frequency. Select another marker using MARKER > SELECT, then select one of 12 available markers. If the marker was off, the marker will be made active and placed at the center frequency. -
Page 42: Marker Menu
2-12 Setting Up Markers Real-Time Spectrum Analyzer (Option 199) MARKER Menu PEAK SEARCH: Opens the “MARKER PEAK SEARCH Menu” on page 2-35. SELECT: Turns on the selected marker if it is off or makes it the active marker if it is already turned on. -
Page 43: Marker Peak Search Menu
Real-Time Spectrum Analyzer (Option 199) 2-12 Setting Up Markers MARKER PEAK SEARCH Menu Note Double tapping a marker opens a quick peak search menu with some of the below features. PEAK SEARCH: Returns to the main MARKER menu. SELECT: If the selected marker is off, it will be turned on and the selected marker positioned at the peak of Trace 1. -
Page 44: Marker Functions
2-12 Setting Up Markers Real-Time Spectrum Analyzer (Option 199) Marker Functions Noise Markers Noise Markers use an averaging routine applied to multiple data-point groups to calculate the readout, which is typically comparable to using 1 Hz bandwidth filtering. Because the noise marker routine uses groups of data points for the calculation, the noise marker should not be placed in close proximity to measurable signals. -
Page 45: Spectrogram With Cursors And Markers
Real-Time Spectrum Analyzer (Option 199) 2-12 Setting Up Markers Spectrogram with Cursors and Markers In the spectrum window, markers are shown as hollow green diamonds on the trace to which they are assigned. Active markers have a solid fill with a vertical dashed line that can be used to drag the marker position. -
Page 46: Marker Table
2-12 Setting Up Markers Real-Time Spectrum Analyzer (Option 199) Marker Table The marker table display is useful for displaying many marker parameters at once. The examples shown are for the regular Spectrum view (1) and for Spectrogram view (2). Both marker tables show the marker mode and corresponding X and Y values. -
Page 47: 2-13 Setting Up Limit Lines
Real-Time Spectrum Analyzer (Option 199) 2-13 Setting Up Limit Lines 2-13 Setting Up Limit Lines Limit lines allow you to monitor when trace data crosses a defined line. Two types of limit lines can be specified: lower limit lines and upper limit lines. Limit lines can be used for visual reference, pass/fail criteria, and to trigger a save on event. -
Page 48: Limit Line Envelope
2-13 Setting Up Limit Lines Real-Time Spectrum Analyzer (Option 199) Limit Line Envelope Limit line envelope parameters are set using the “LIMIT ENVELOPE Menu” on page 2-44. The limit line envelope feature is a quick way to generate an envelope using the existing trace as a reference. You can set the envelope to square or slope and you can set the limit line offset from the trace when creating the envelope. -
Page 49: Limit Menu
Real-Time Spectrum Analyzer (Option 199) 2-13 Setting Up Limit Lines LIMIT Menu SELECT: Selects UPPER or LOWER limit line for editing. ENABLED: Displays the selected limit when toggled on. ALARM: This setting is for toggling the alarm function on or off for the currently active limit line. -
Page 50: Limit Edit Menu
2-13 Setting Up Limit Lines Real-Time Spectrum Analyzer (Option 199) LIMIT EDIT Menu SELECTED POINT: Displays the limit line point number. Press to select a different point from the displayed list. FREQUENCY: Sets the frequency of a limit line inflection point. The frequency of each point in a limit line can be individually set. -
Page 51: Limit Move Menu
Real-Time Spectrum Analyzer (Option 199) 2-13 Setting Up Limit Lines LIMIT MOVE Menu CENTER: Pressing this button moves the center of the existing limit line to the center frequency of the measurement. The span of the existing limit line is not changed. Use this button as an easy way to move an existing limit line to the center of the sweep. -
Page 52: Limit Envelope Menu
2-14 Setting Up Triggering Real-Time Spectrum Analyzer (Option 199) LIMIT ENVELOPE Menu SELECT: Press this button to select UPPER or LOWER for envelope design. ENVELOPE POINTS: This sets the desired number of envelope points. AMPLITUDE OFFSET: Use to define how far away from the trace to place the upper or lower envelope. -
Page 53: 2-15 Setting Up Advanced Measurements
Real-Time Spectrum Analyzer (Option 199) 2-15 Setting Up Advanced Measurements 2-15 Setting Up Advanced Measurements Refer to “Making RTSA Measurements” on page 2-7 for basic information on setting up a spectrum measurement. This section provides setup information for making real time spectrum measurements. The Field Master Series analyzer features smart measurements that make setup easy. -
Page 54: Iq Capture Menu
2-15 Setting Up Advanced Measurements Real-Time Spectrum Analyzer (Option 199) IQ CAPTURE Menu START/STOP CAPTURE: Touch this button to execute an IQ capture. When a capture is initiated, this button changes to STOP CAPTURE and can be touched to stop the continuous captures. -
Page 55: Iq Streaming Menu
Real-Time Spectrum Analyzer (Option 199) 2-15 Setting Up Advanced Measurements IQ STREAMING Menu START STREAM: Touch this button to start IQ data streaming from the selected output port. When streaming is initiated, this button changes to STOP STREAM and can be touched to stop the stream. - Page 56 2-15 Setting Up Advanced Measurements Real-Time Spectrum Analyzer (Option 199) Once the IQ Capture menu is accessed, the IQ CAPTURE table is displayed at the bottom of the screen. Figure 2-42. IQ CAPTURE Table The IQ CAPTURE table provides the following: •...
-
Page 57: Iq Trigger Menu
Real-Time Spectrum Analyzer (Option 199) 2-15 Setting Up Advanced Measurements IQ TRIGGER Menu Trigger commands are shared between IQ capture and zero span, so these two functions are Note mutually exclusive. TIMESTAMPS: toggles data collection timestamps on or off (Refer to the Field Master Series IQ Capture/Streaming Measurement Guide, PN: 10580-00490). -
Page 58: Iq Streaming Tools
2-15 Setting Up Advanced Measurements Real-Time Spectrum Analyzer (Option 199) Positive Edge Trigger High Threshold Hysteresis Level Not Triggered Low Threshold Negative Edge Trigger Figure 2-44. Trigger Levels and Hysteresis IQ Streaming Tools The IQ STREAMING menu allows you to concatenate an existing IQ metadata file (.dgzm) with a session of IQ data files (.dgz) that were streamed to a USB device after the stream operation is complete. -
Page 59: Setup Menus (Normal View)
Real-Time Spectrum Analyzer (Option 199) 2-15 Setting Up Advanced Measurements SETUP Menus (Normal View) SHOW DENSITY: Toggles the density display on or off. Density displays the relative time density of a signal in a color scale ranging from blue to red. Signals that persist longer or more often during the acquisition time are indicated in red color. -
Page 60: Setup Menu (Spectrogram View)
2-15 Setting Up Advanced Measurements Real-Time Spectrum Analyzer (Option 199) SETUP Menu (Spectrogram View) SHOW DENSITY: Toggles the density display on or off. Density displays the relative time density of a signal in a color scale ranging from blue to red. Signals that persist longer or more often during the acquisition time are indicated in red color. -
Page 61: Am/Fm Audio (Requires Option 24)
Real-Time Spectrum Analyzer (Option 199) 2-16 AM/FM Audio (Requires Option 24) 2-16 AM/FM Audio (Requires Option 24) This section describes the Real-TimeSpectrum Analyzer AM/FM audio demodulation capability (available with Option 24) and key characteristics of analog amplitude modulation (AM) and frequency modulation (FM). The AM/FM analyzer provides the following features: •... -
Page 62: Setup Menu (Am/Fm Audio)
2-16 AM/FM Audio (Requires Option 24) Real-Time Spectrum Analyzer (Option 199) 1. The status panel provides quick access to common spectrum analyzer settings. See “Status Panel” on page 2-6. 2. The trace display area can show multiple traces, each with a unique color. Each trace can be set to Clear/Write, Average, Min or Max Hold, Rolling Average or Rolling Min Hold, Rolling Max Hold, T1-T2, T2-T1. - Page 63 Real-Time Spectrum Analyzer (Option 199) 2-16 AM/FM Audio (Requires Option 24) For simultaneous audio demodulation and trace sweep, the set span must not be greater than the maximum capture bandwidth based on the installed bandwidth option (No option: 20 MHz; Note Option 103: 55 MHz;...
- Page 64 2-17 Interference Finder (Option 24) Real-Time Spectrum Analyzer (Option 199) 2-17 Interference Finder (Option 24) The interference finder measurement is set up using the “Interference Menu” on page 2-58. The interference finder measurement is used in conjunction with a directional antenna to locate the direction of an interfering signal.
- Page 65 Real-Time Spectrum Analyzer (Option 199) 2-17 Interference Finder (Option 24) Interference Finder is a constant measurement; after it is turned on, it remains on until a different measurement is selected or the sweep is paused. Signal power and a corresponding audio pitch is calculated at the end of each sweep.
-
Page 66: Interference Finder (Option 24)
2-17 Interference Finder (Option 24) Real-Time Spectrum Analyzer (Option 199) Interference Menu INTEGRATION BW: Sets the range of integration used in calculating the received power. The integration bandwidth is displayed as the shaded region between the bandwidth start and stop thresholds (dashed green lines). POWER LIMIT: The power limit is the threshold value used to determine whether the actual measured channel power will pass or not. -
Page 67: 2-18 Presetting The Analyzer
Real-Time Spectrum Analyzer (Option 199) 2-18 Presetting the Analyzer 2-18 Presetting the Analyzer The PRESET menu sets certain settings to the default state. Preset only affects the current analyzer settings, such as those for the RTSA spectrum analyzer or for the 5GNR analyzer. Preset does not affect user files or system settings such as networking settings. -
Page 68: 2-19 Saving And Recalling Measurements
2-19 Saving and Recalling Measurements Real-Time Spectrum Analyzer (Option 199) 2-19 Saving and Recalling Measurements The Field Master Series can save measurement setups, native trace and CSV trace data, limit line setups, and screenshots. You can recall setup, native trace, and limit line files. For other file operations such as copy, move, and directory management, refer to “File Management”... -
Page 69: Recalling A Measurement
Real-Time Spectrum Analyzer (Option 199) 2-19 Saving and Recalling Measurements Recalling a Measurement You can recall a saved setup, native trace measurement, and a limit line. When recalling a setup, the instrument setup and operating state will be restored as it was when the setup was saved. When recalling a trace measurement, the instrument setup and on-screen measurement data will be restored as it was when the trace data was saved. -
Page 70: File Menu
2-19 Saving and Recalling Measurements Real-Time Spectrum Analyzer (Option 199) FILE Menu QUICK SAVE: saves a setup file immediately with the name shown in the button. The number in the name is incremented automatically so that the new name is ready for the next setup file to be saved. -
Page 71: Save On Event Menu
Real-Time Spectrum Analyzer (Option 199) 2-19 Saving and Recalling Measurements SAVE ON EVENT Menu Save on event saves the current trace data to a folder named with the current date and time (yyyymmddhhmmss). LIMIT CROSSED: When enabled, measurement trace data is automatically saved when the trace crosses a limit line that has been specified in the LIMIT menu. - Page 72 2-19 Saving and Recalling Measurements Real-Time Spectrum Analyzer (Option 199) 2-64 PN: 10580-00448 Rev. A Real-TimeSpectrum Analyzer MG...
-
Page 73: Chapter 3-Ia Real-Time Spectrum Analyzer (Option 24)
Chapter 3 — IA Real-Time Spectrum Analyzer (Option 24) Introduction The Interference Analyzer (IA) real-time spectrum analyzer (RTSA) and MA2700A handheld ™ InterferenceHunter are the ideal solution for anyone conducting coverage testing of RF and microwave communications systems, including 5G and LTE networks. The Interference Analyzer (IA) RTSA application assists you in finding the source of interfering signals with the use of MA2700A handheld InterferenceHunter, GPS receiver, and directional antenna. -
Page 74: Making Ia Rtsa Measurements
3-2 Making IA RTSA Measurements IA Real-Time Spectrum Analyzer (Option 24) Making IA RTSA Measurements Initial Setup • Connect a signal source to the RF In test port of the instrument. For over-the-air measurements, connect an antenna that is appropriate for the frequency range to be measured. For connector descriptions, refer “Connector Panels”... -
Page 75: Setting Up Advanced Measurements
IA Real-Time Spectrum Analyzer (Option 24) 3-3 Setting Up Advanced Measurements Setting Up Advanced Measurements Refer to “Making IA RTSA Measurements” on page 3-2 for basic information on setting up IA RTSA measurement. This section provides setup information for making real time spectrum measurements. The Field Master Series analyzer features smart measurements that make setup easy. -
Page 76: Setup Menu (Rtsa)
3-3 Setting Up Advanced Measurements IA Real-Time Spectrum Analyzer (Option 24) SETUP Menu (RTSA) SHOW DENSITY: Toggles the density display on or off. Density displays the relative time density of a signal in a color scale ranging from blue to red. Signals that persist longer or more often during the acquisition time are indicated in red color. -
Page 77: Interference Map
IA Real-Time Spectrum Analyzer (Option 24) 3-4 Interference Map Interference Map This section describes the Interference Map capability and key characteristics of Interference map measurement mode. This section describes the Interference Map capability and key characteristics of Interference map measurement mode. This technique is used to geo-locate interfering signals with respect to the user’s current location. - Page 78 3-4 Interference Map IA Real-Time Spectrum Analyzer (Option 24) 1. The map zoom tool is used to increase (+) or decrease (-) zoom level. You can also drag the zoom level indicator up or down, or you can pinch to change zoom level. 2.
-
Page 79: Status Panel (Interference Map And Interference Polar)
IA Real-Time Spectrum Analyzer (Option 24) 3-4 Interference Map STATUS Panel (Interference Map and Interference Polar) This Status panel is unique to Interference Map and Interference Polar measurement modes (selected via MEASURE > MEASUREMENT menu) of IA RTSA Application. Pressing editable parameters opens the associated menu with a keypad that allows you to conveniently change the parameter value. -
Page 80: Setup Menu (Interference Map)
3-4 Interference Map IA Real-Time Spectrum Analyzer (Option 24) SETUP Menu (Interference Map) The Interference Map SETUP menu is available in MEASURE > MEASUREMENT > Interference Map> SETUP. BEARING SOURCE: Selects the bearing source either as antenna or manual. If antenna is selected the electronic compass from the MA2700A InterferenceHunter is used to find the direction of the peak signal. -
Page 81: Interference Polar
IA Real-Time Spectrum Analyzer (Option 24) 3-5 Interference Polar Interference Polar This section describes the MS2090A Interference Polar capability and key characteristics of Interference Polar measurement mode. This is an alternative technique to geo-locate a potentially interfering signal without having to go to multiple locations. The user stands at a fixed location and makes a full rotation along with the MA2700A InterferenceHunter and a directional antenna through 360º. - Page 82 3-5 Interference Polar IA Real-Time Spectrum Analyzer (Option 24) 1. The map zoom tool is used to increase (+) or decrease (-) zoom level. You can also drag the zoom level indicator up or down, or you can pinch to change zoom level. 2.
-
Page 83: Setup Menu (Interference Polar)
IA Real-Time Spectrum Analyzer (Option 24) 3-5 Interference Polar SETUP Menu (Interference Polar) The Interference Polar SETUP menu is available in MEASURE > MEASUREMENT > Interference Polar > SETUP. INTEGRATION BW: Sets the range of integration used in calculating the received power. -
Page 84: Saving And Recalling Measurements
3-6 Saving and Recalling Measurements IA Real-Time Spectrum Analyzer (Option 24) Saving and Recalling Measurements The Field Master Series can save measurement setups, native trace and CSV trace data, limit line setups, and screenshots. You can recall setup, native trace, and limit line files. For other file operations such as copy, move, and directory management, refer to Section 2-11 “File Management”... -
Page 85: Recalling A Measurement
IA Real-Time Spectrum Analyzer (Option 24) 3-6 Saving and Recalling Measurements Recalling a Measurement You can recall a saved setup, native trace measurement, and a limit line. When recalling a setup, the instrument setup and operating state will be restored as it was when the setup was saved. When recalling a trace measurement, the instrument setup and on-screen measurement data will be restored as it was when the trace data was saved. -
Page 86: File Menu
3-6 Saving and Recalling Measurements IA Real-Time Spectrum Analyzer (Option 24) FILE Menu QUICK SAVE: saves a setup file immediately with the name shown in the button. The number in the name is incremented automatically so that the new name is ready for the next setup file to be saved. - Page 87 IA Real-Time Spectrum Analyzer (Option 24) 3-6 Saving and Recalling Measurements MS2090A MG PN: 10580-00448 Rev. A 3-15...
- Page 88 3-6 Saving and Recalling Measurements IA Real-Time Spectrum Analyzer (Option 24) 3-16 PN: 10580-00448 Rev. A Real-TimeSpectrum Analyzer MG...
- Page 90 Anritsu Company 490 Jarvis Drive Anritsu utilizes recycled paper and environmentally conscious inks and toner. Morgan Hill, CA 95037-2809 http://www.anritsu.com...
Need help?
Do you have a question about the Field Master Pro MS2090A and is the answer not in the manual?
Questions and answers