Table of Contents
Advertisement
Quick Links
www.ti.com
User's Guide
Water Flow Meter
This getting started guide reviews the contents of the
tells you how to quickly get started with the MSP430FR6047 device for a water flow meter solution. The
information in this guide also applies to the MSP430FR600x and
module
when used in the water metering configuration. For more information on the EVM430-FR6043 in water
metering configuration, see the
measurement.
1
Introduction.............................................................................................................................................................................2
Contents..............................................................................................................................................................2
1.2 What is Not Included..........................................................................................................................................................
Requirement..........................................................................................................................................................2
1.4 MSP430FR600x Evaluation...............................................................................................................................................
4 USS GUI...................................................................................................................................................................................
Platform.................................................................................................................................................5
4.2 Configuration Parameters..................................................................................................................................................
Signals...............................................................................................................................................11
Waveforms.......................................................................................................................................................14
4.5 Frequency Response.......................................................................................................................................................
5 Meter Characterization.........................................................................................................................................................
5.1 Single Shot Standard Deviation.......................................................................................................................................
5.2 Zero Flow Drift Testing.....................................................................................................................................................
5.3 Flow Testing.....................................................................................................................................................................
6 Revision History...................................................................................................................................................................
Figure 2-1. EVM430-FR6047 Connected to Flow Meter.............................................................................................................
Figure 3-2. Load Image...............................................................................................................................................................
Figure 4-1. USS GUI Connected to EVM....................................................................................................................................
Figure 4-2. Parameters Tab.........................................................................................................................................................
Figure 4-4. Advanced Parameters Tab........................................................................................................................................
Figure 4-5. Representative Captured Waveform With Interpolation............................................................................................
Figure 4-6. Captured ADC Signal..............................................................................................................................................
Figure 4-7. Gap Between Pulse Start and ADC Capture Set Too Long....................................................................................
Figure 4-9. Captured ADC Signal With No Water or Bad Connection.......................................................................................
Waveforms............................................................................................................................................14
Figure 5-1. Single Shot Standard Deviation..............................................................................................................................
Setup.......................................................................................................................................................17
SLAU810B - SEPTEMBER 2019 - REVISED SEPTEMBER 2020
Submit Document Feedback
ABSTRACT
MSP430FR6047 ultrasonic sensing evaluation module
Optimized ultrasonic sensing metrology reference design for water flow
Table of Contents
Meter......................................................................................................................................3
GUI..............................................................................................................................4
List of Figures
Settings............................................................................................................................3
Device.................................................................................................................................4
Diagram...................................................................................................................................7
Amplitudes......................................................................................................................15
Copyright © 2020 Texas Instruments Incorporated
MSP430FR6043 ultrasonic sensing evaluation
Short....................................................................................12
Table of Contents
and
2
2
5
6
15
16
16
16
17
18
3
4
5
6
8
9
11
12
13
16
Water Flow Meter
1
Advertisement
Table of Contents

Related Manuals for Texas Instruments MSP430FR6047


Summary of Contents for Texas Instruments MSP430FR6047
-
Page 1: Table Of Contents
This getting started guide reviews the contents of the MSP430FR6047 ultrasonic sensing evaluation module tells you how to quickly get started with the MSP430FR6047 device for a water flow meter solution. The information in this guide also applies to the MSP430FR600x and... -
Page 2: Introduction
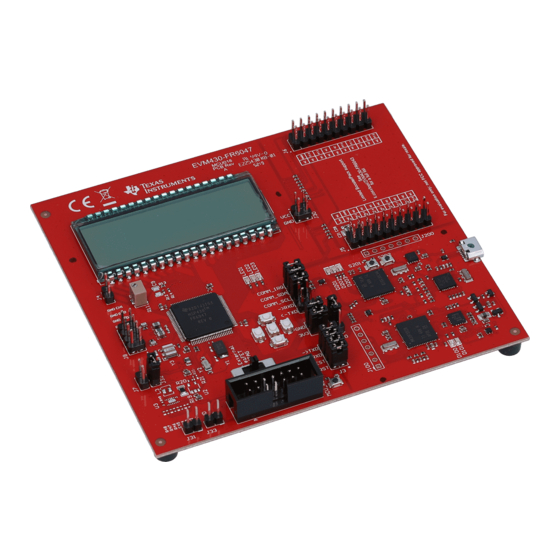
All other trademarks are the property of their respective owners. 1 Introduction Thank you for requesting the MSP430FR6047 sample kit. This getting started guide reviews the contents of your kit and provides an overview on how to quickly get started with the MSP430FR6047 experimental device for water flow meter solution. -
Page 3: Connect The Evm To The Flow Meter
J3 jumpers set to use USB power. The jumper locations are highlighted in Figure 2-2. Figure 2-2. EVM430-FR6047 Jumper Settings 3. Make sure that there is water in the flow meter. SLAU810B – SEPTEMBER 2019 – REVISED SEPTEMBER 2020 Water Flow Meter Submit Document Feedback Copyright © 2020 Texas Instruments Incorporated... -
Page 4: Flashing The Evm And Installing The Gui
7. Install the Ultrasonic Sensing Design Center GUI, which can be downloaded from http://software-dl.ti.com/ msp430/msp430_public_sw/mcu/msp430/USSSWLib/USSSWLibWater/latest/index_FDS.html A shortcut named USS is installed to the Texas Instruments folder in the Windows Start menu to launch the Ultrasonic Sensing Design Center GUI. Water Flow Meter SLAU810B –... -
Page 5: Uss Gui
"Connect" in the "Communications" menu. The GUI reports the connection as shown in Figure 4-1. Figure 4-1. USS GUI Connected to EVM SLAU810B – SEPTEMBER 2019 – REVISED SEPTEMBER 2020 Water Flow Meter Submit Document Feedback Copyright © 2020 Texas Instruments Incorporated... -
Page 6: Configuration Parameters
(1450 m/s). An appropriate "Gap" that would ensure there is enough time before the signal to accommodate shifts due to temperature variations might therefore be 60 µs. The ultrasonic distance between Water Flow Meter SLAU810B – SEPTEMBER 2019 – REVISED SEPTEMBER 2020 Submit Document Feedback Copyright © 2020 Texas Instruments Incorporated... -
Page 7: Figure 4-3. Configuration Timing Diagram
Figure 4-3). The timing diagram represented in this figure is representative and is not exact. Figure 4-3. Configuration Timing Diagram SLAU810B – SEPTEMBER 2019 – REVISED SEPTEMBER 2020 Water Flow Meter Submit Document Feedback Copyright © 2020 Texas Instruments Incorporated... -
Page 8: Figure 4-4. Advanced Parameters Tab
AbsToF algorithm. Designs requiring more accurate results can use a larger interpolation table. For details on this table, see the "Calibration User’s Guide". Water Flow Meter SLAU810B – SEPTEMBER 2019 – REVISED SEPTEMBER 2020 Submit Document Feedback Copyright © 2020 Texas Instruments Incorporated... -
Page 9: Figure 4-5. Representative Captured Waveform With Interpolation
10000 nanoseconds. The only scenario in which this value should be changed is when the time of flight between transducers is less than 30 µs. Use a corresponding SLAU810B – SEPTEMBER 2019 – REVISED SEPTEMBER 2020 Water Flow Meter Submit Document Feedback Copyright © 2020 Texas Instruments Incorporated... - Page 10 ✔ ✔ GUI Based Gain Control ✔ ✔ ✔ Transmit Frequency ✔ Envelope Crossing Threshold ✔ ✔ ✔ Capture Duration Water Flow Meter SLAU810B – SEPTEMBER 2019 – REVISED SEPTEMBER 2020 Submit Document Feedback Copyright © 2020 Texas Instruments Incorporated...
-
Page 11: Capturing The Adc Signals
Figure 4-8 shows an example where the gap is set too short. SLAU810B – SEPTEMBER 2019 – REVISED SEPTEMBER 2020 Water Flow Meter Submit Document Feedback Copyright © 2020 Texas Instruments Incorporated... -
Page 12: Figure 4-7. Gap Between Pulse Start And Adc Capture Set Too Long
Figure 4-7. Gap Between Pulse Start and ADC Capture Set Too Long Figure 4-8. Gap Between Pulse Start and ADC Capture Set Too Short Water Flow Meter SLAU810B – SEPTEMBER 2019 – REVISED SEPTEMBER 2020 Submit Document Feedback Copyright © 2020 Texas Instruments Incorporated... -
Page 13: Figure 4-9. Captured Adc Signal With No Water Or Bad Connection
To save the capture, click the "Save Capture" button and provide a filename. To continuously capture to a file, click the "Continuous Capture" button and provide a filename. SLAU810B – SEPTEMBER 2019 – REVISED SEPTEMBER 2020 Water Flow Meter Submit Document Feedback Copyright © 2020 Texas Instruments Incorporated... -
Page 14: Capturing Waveforms
After capturing waveforms for some time, you can save them to a file using the "Save Waveforms" button. The "Lock All" button stops updates, and the "Reset Graphs" button erases all previously captured data. Water Flow Meter SLAU810B – SEPTEMBER 2019 – REVISED SEPTEMBER 2020 Submit Document Feedback Copyright © 2020 Texas Instruments Incorporated... -
Page 15: Frequency Response
5. Identify the peak amplitude of the "Frequency Sweep" and set the "Transmit Frequency" to this value. SLAU810B – SEPTEMBER 2019 – REVISED SEPTEMBER 2020 Water Flow Meter Submit Document Feedback Copyright © 2020 Texas Instruments Incorporated... -
Page 16: Meter Characterization
More detailed information on zero flow drift testing can be found in the Ultrasonic Sensing Metrology Subsystem Reference Design for Water Flow Measurement design guide. Water Flow Meter SLAU810B – SEPTEMBER 2019 – REVISED SEPTEMBER 2020 Submit Document Feedback Copyright © 2020 Texas Instruments Incorporated... -
Page 17: Flow Testing
Flows are typically captured over several minutes and averaged to compare accuracies between a reference meter and the DUT. Figure 5-3 shows comparative flow tests results for a meter at various flows rates. SLAU810B – SEPTEMBER 2019 – REVISED SEPTEMBER 2020 Water Flow Meter Submit Document Feedback Copyright © 2020 Texas Instruments Incorporated... -
Page 18: Revision History
Measurements at room temperature Figure 5-3. Audiowell Meter Measurements For more details on water flow testing, see the MSP430FR6047 and Ultrasonic Software Based Water Flow Meter Measurement Results application report. 6 Revision History NOTE: Page numbers for previous revisions may differ from page numbers in the current version. - Page 19 TI products. TI’s provision of these resources does not expand or otherwise alter TI’s applicable warranties or warranty disclaimers for TI products. TI objects to and rejects any additional or different terms you may have proposed. IMPORTANT NOTICE Mailing Address: Texas Instruments, Post Office Box 655303, Dallas, Texas 75265 Copyright © 2022, Texas Instruments Incorporated...
Need help?
Do you have a question about the MSP430FR6047 and is the answer not in the manual?
Questions and answers