Table of Contents
Advertisement
Advertisement
Table of Contents

Subscribe to Our Youtube Channel
Related Manuals for Extech Instruments RH600


Summary of Contents for Extech Instruments RH600
- Page 1 USER MANUAL RH600 Dew Point Meter...
-
Page 2: Table Of Contents
Programming the Data Logger........17 Start/Stop Data Log Recording ........18 Data Recording Using the Data Hold Function ....18 Viewing Recorded Data on the RH600 Display....18 Viewing Data Files on Graphs........21 Clearing Data Memory ..........22 Downloading and Backing Up Data Files to a PC ..... 22... - Page 3 Alarm Operation ............24 PC Interface..............25 10.1 PC Connection Overview ........... 25 10.2 Initiating Meter-to-PC Communication ......25 10.3 Updating the RH600 Firmware........25 Specifications..............28 11.1 General Specifications..........28 11.2 Measurement Specifications ........29 11.3 List of Measurements and Calculated Readings ....30 Maintenance ..............
-
Page 5: Introduction
The RH600 can perform spot checks in ambient air and in industrial proc- esses where the probe can be mounted directly into pressurized systems. -
Page 6: Descriptions
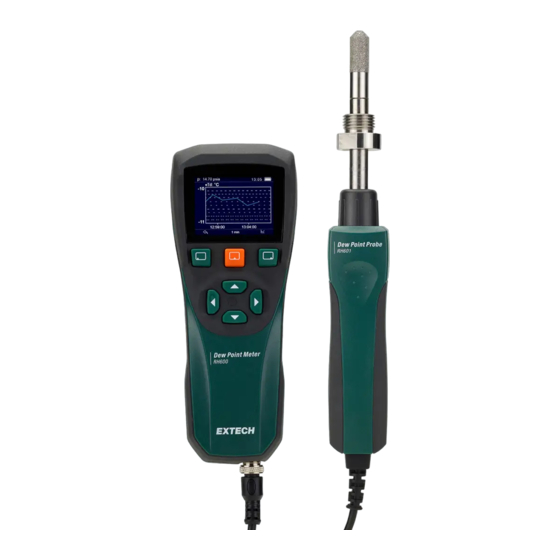
Descriptions 2.1 Meter (RH600) Description 1. USB charging and PC interface port. 2. Color LCD. 3. Three function buttons, F1, F2, and F3 (see Section 2.2). 4. Four navigation and programming arrow buttons (see Section 2.2). 5. Unused port. 6. Probe connector. -
Page 7: Probe (Rh601) Description
Descriptions 2.2 Probe (RH601) Description 1. Probe sensor tip with protective cap. 2. Threaded connector (0.5 inch). 3. Probe handle grip. 4. Probe cable. 2.3 Button Descriptions 2.3.1 Function Buttons The context-sensitive function buttons (F1 , F2 , and F3 ) are located directly below the display, from left to right. - Page 8 Descriptions From the Home page (Section 6), press F1 to begin viewing real-time readings plotted on graphs. When the first graph opens, this icon will move to the area above F3, press F3 at that point to step through all the available graphs.
-
Page 9: Quick Steps
Quick Steps 1. Connect the probe to the port at the bottom of the meter (Section 4.1). 2. Remove the probe’s protective cap and mount it in the process under test using the threaded connector (0.5 inch) or hold it in ambient air (Section 4.2). -
Page 10: Probe Use And Configuration
Probe Use and Configuration 4.1 Connecting the Probe to the Meter The probe connects to the port at the bottom of the meter. The four-pin con- nection is keyed allowing only one insertion orientation; ensure proper orienta- tion before applying pressure when inserting, do not force the connector. Once the probe is connected to the meter, tighten the knurled screw to secure the connection. -
Page 11: Setting The Probe Molar Mass
Probe Use and Configuration 4.4 Setting the Probe Molar Mass Set the probe’s Molar Mass setting to match the gas under test. See the steps below. The molar mass of air is 28.96 g/mol and the molar mass of SF6 is 146.05 g/mol. -
Page 12: Powering The Meter
The battery status icon is located on the upper right corner of the display To charge the battery, connect the RH600 to a power source using the sup- plied USB cable and AC mains plug. When the RH600 is charging, the battery status icon appears with a charging symbol embedded Short press F2 (centre, orange function button) to power the meter. -
Page 13: Home Page
Home Page 6.1 Home Page Description The home page (Figure 6.1) appears soon after the meter is switched on. Figure 6.1 Home Page 1. Battery voltage status. 2. Temperature reading. 3. Selectable reading (relative humidity, in this example). See Display in the Programming menu (Section 7) for details on selecting a reading type. -
Page 14: Home Page Summary Display
Home Page 6.2 Home Page Summary Display If you press the left or right arrow button at the Home page, the readings are presented in a summary format as shown in Figure 6.2. Press the left or right arrow button to return to the Home page. Figure 6.2 Press the right or left arrow button from the Home page to view the readings in summary format. -
Page 15: Data Hold Mode
The readings that you save in the Data Hold mode are saved to a file named Hold and Save in the RH600 internal flash drive for later viewing on the meter display and for downloading to a PC. Files downloaded to a PC can be opened in a spreadsheet for general use and for creating professional reports. -
Page 16: Programming Menu
Programming Menu Figure 7.1 Programming menu Press F3 to open the Programming menu. The menu has five (5) items, Functions, Recording, Display, Environment, and Settings. Use the left/right ✔ arrow buttons to highlight an item. Press F3 to open an item. Press F1 from any page to return to the previous page. -
Page 17: Functions Menu
In the Functions menu you can configure low and high Alarms, turn the Alarms ON/OFF, and initiate meter-to-PC communication, after connecting the RH600 to a PC using the supplied USB cable. Use the arrow buttons to scroll. ✔ Press F3 to open or select an item. -
Page 18: Recording Menu
Programming Menu 7.3 Recording Menu In the Recording menu you can start/stop the data logger, configure the log- ging sample rate (gap) and session duration (time), and view/erase logged ✔ data. Use the arrow buttons to scroll. Press F3 to open or select an option. See Section 8, Data Logging, for specifics. -
Page 19: Settings Menu
Programming Menu 7.5 Settings Menu In the Settings menu you can set the displayed language, auto power off (APO) time, display brightness, date/time, and keypad tone ON/OFF. You can also view the meter firmware version (see Section 10.3 for firmware update in- ✔... - Page 20 Programming Menu Figure 7.7 Setting the Time and Date. Use the arrow buttons to change the Year, Month, Day, Hour, Minutes, and 12 or 24 hour clock. #NAS100113; r. AA/87024/87024; en-US...
-
Page 21: Data Recording
(graphically and as text summary) and downloaded to a PC for viewing and saving in spreadsheet programs. Note that even though the RH600 shows only 3 readings at one time on its Home page, all available readings are captured when data is recorded, as shown in Figure 8.7, below. -
Page 22: Start/Stop Data Log Recording
You can manually stop a recording session by selecting Stop in the Re- cording menu. For long logging sessions, it is recommended that you connect the RH600 to a power source to ensure that it does not switch off during the session be- cause of a low battery condition. - Page 23 Data Hold file. Reference the steps below each diagram for details re- garding the opened file. Figure 8.3 An example of an opened Data Log file viewed on the RH600 display. 1. Filename for saved Data Log file. 2. Logged reading values.
- Page 24 8. In this example, reading number 360, of the 360 saved readings in the file, is shown on this page. Figure 8.4 An example of an opened Data Hold file, viewed on the RH600 display. 1. Total number of readings that can be stored in one file is 1000. Up to 32 files can be stored in the RH600.
-
Page 25: Viewing Data Files On Graphs
Data Recording 8.6 Viewing Data Files on Graphs When you press F3 from an opened Data Log or Data Hold file, the data are presented on graphs. Step through the set of four graphs by pressing F3 . The first graph that appears shows all readings on one graph, as shown on the upper left screen in Figure 8.5, below. -
Page 26: Clearing Data Memory
To download and back up files, connect the RH600 to a PC using the supplied USB cable. The RH600 USB port is located at the top of the meter, as shown in Section 2.1. Once connected, go to Functions in the programming menu and select Connect Computer;... - Page 27 Data Recording Figure 8.7 Data file opened in a spreadsheet. Note that ALL available readings are captured, not only the three readings that are shown on the RH600 Home page. Each reading is num- bered and date/time-stamped. #NAS100113; r. AA/87024/87024; en-US...
-
Page 28: Alarm Utility
OFF in the Functions menu. Figure 9.1 Functions menu showing the low and high alarm options. Note that the Connect to Computer option is used when connecting the RH600 to a PC, see Section 10, PC Inter- face, for specifics. -
Page 29: Pc Interface
Data Hold readings and to perform a firmware upgrade. Use the supplied USB cable to connect the RH600 to a PC USB port. The RH600 USB port is located at the top of the meter as shown in Section 2.1, Meter Description. - Page 30 4. Type your Email Address to log in or to create an account, as shown. Click Continue. 5. For Figure 10.3, below, 1. Type RH600 in the search field; 2. Select FLIR / Extech Meters Software from the pull-down menu; 3. Select Extech Software from the pull-down menu;...
- Page 31 Figure 10.4 Windows PC example: Moving the update file to the RH600 root directory. NOTE Drag only the update file into the RH600 root directory. Do not drag other files or folders that may accompany the update file (readme.txt, for example).
-
Page 32: Specifications
Specifications 11.1 General Specifications Display Color multifunction LCD with adjustable brightness. Control buttons Three (3) context-sensitive function buttons and four (4) arrow buttons for navigation and programming. Programming menu Intuitive user interface offers five (5) menu categories (Display, Functions, Recording, Environment, and Settings) for customizing and configuring the meter. -
Page 33: Measurement Specifications
Specifications 11.2 Measurement Specifications FUNCTION RANGE RESOLUTION ACCURACY Specified at 68℉ (20℃) unless otherwise noted 0.01 % Relative Humidity 0 to 5 % RH <5%: ±(0.025 %RH + 17.5% of reading) 5 to 15 % RH >5%: ±(1 %RH + 5% 15 to 100 % of reading) RH >... -
Page 34: List Of Measurements And Calculated Readings
Specifications 11.3 List of Measurements and Calculated Readings Parameters Ranges Temperature (T) 14.00 to 140.00℉ (-10.00 to 60.00℃) Dew point/Frost point temperature (T d/f) -58.00 to 86.00℉ (-50.00 to 30.00℃) Dew point temperature (Td) -58.00 to 86.00℉ (-50.00 to 30.00℃) Dew point / frost point temperature in at- -58.00 to 68.00℉... -
Page 35: Maintenance
12.2 Cleaning To clean the body of the RH600 meter and the RH601 probe, use a lightly dampened, lint-free cloth. Use a mild detergent, if necessary. Dry the unit completely before use. Do not use abrasives or solvents to clean any area of the meter. -
Page 36: Customer Support
CUSTOMER SUPPORT Customer Support Telephone List: https://support.flir.com/contact Service e-mail: repair@extech.com Technical Support: https://support.flir.com Extech Website: www.extech.com #NAS100113; r. AA/87024/87024; en-US... -
Page 37: Warranty
Warranty FLIR Systems, Inc. warrants this Extech brand instrument to be free of defects in parts and workmanship for two years from date of shipment. View the full warranty at this link: http://www.extech.com/support/warranties #NAS100113; r. AA/87024/87024; en-US... - Page 38 #NAS100113; r. AA/87024/87024; en-US...
- Page 40 USER MANUAL last page Website http://www.flir.com Customer support http://support.flir.com Copyright © 2022, FLIR Systems, Inc. All rights reserved worldwide. Disclaimer Specifications subject to change without further notice. Models and accessories subject to regional market considerations. License procedures may apply. Products described herein may be subject to US Export Regulations.
Need help?
Do you have a question about the RH600 and is the answer not in the manual?
Questions and answers