Table of Contents
Advertisement
Quick Links
Advertisement
Table of Contents

Subscribe to Our Youtube Channel
Related Manuals for VeEX VePAL TX300M


Summary of Contents for VeEX VePAL TX300M
- Page 1 TX300S_e-manual_D07-00-064P_RevA00...
- Page 2 TX300S_e-manual_D07-00-064P_RevA00 Table of Contents 1.0 About This User Manual 2.0 Introduction 3.0 Safety Information 4.0 Basic Operations 4.1 Compact Platform Overview 4.2 Keypad 4.3 Touch Screen Display 4.4 Battery 4.5 Connectors and Panels 4.5.1 Test Ports - Electrical and Optical 4.5.2 RJ-45 Interface (TX300e only) 4.5.3 Bantam Interface (TX300 only) 4.5.4 BNC Interface...
- Page 3 TX300S_e-manual_D07-00-064P_RevA00 6.4 Setup: SONET 6.4.1 Transmitter Setup 6.4.2 Receiver Setup 6.5 Setup: OTN/SDH 6.5.1 Transmitter Setup 6.5.2 Receiver Setup 6.6 Setup: OTN/SONET 6.6.1 Transmitter Setup 6.6.2 Receiver Setup 6.7 Measurement Configuration 6.7.1 Timer Setup 6.7.2 Performance Analysis 6.7.3 General 6.7.4 Auto-Config 7.0 Results 7.1 Results: PDH 7.1.1 Summary...
-
Page 4: Table Of Contents
TX300S_e-manual_D07-00-064P_RevA00 7.2.6 Graph 7.2.7 Performance Analysis 7.3 Results: SONET 7.3.1 Summary 7.3.2 Errors and Alarms 7.3.3 Event Log 7.3.4 Signal 7.3.5 Histogram 7.3.6 Graph 7.3.7 Performance Analysis 7.4 Results: OTN 7.4.1 Summary 7.4.2 Errors and Alarms 8.0 Alarms/Errors 8.1 Alarm Generation 8.1.1 PDH Alarms 8.1.2 SDH Alarms 8.1.3 OTN Alarms... - Page 5 TX300S_e-manual_D07-00-064P_RevA00 9.3 Payload Label 9.4 Trace Identifier 9.5 TCM Tasks 10.0 SDH/SONET Tools 10.1 SDH/SONET Tools 10.1.1 Shortcuts 10.1.2 Overhead Analyzer 10.1.3 Overhead Generator 10.1.4 Pointer Tasks 10.1.4.1 Pointer Analysis 10.1.4.2 Pointer Generation 10.1.4.3 Pointer Sequences 10.1.5 Trace Identifier 10.1.5.1 Transmitted Traces (TX) 10.1.5.2 Received Traces (RX) 10.1.6 Payload Labels 10.1.7 APS Tasks...
- Page 6 TX300S_e-manual_D07-00-064P_RevA00 10.2.4.2 Point Generator 10.2.4.3 Pointer Sequences 10.2.5 Trace Identifier 10.2.5.1 Transmitted Traces (TX) 10.2.5.2 Received Traces (RX) 10.2.6 Payload Labels 10.2.7 APS Tasks 10.2.7.1 APS Timing 10.2.7.2 APS Sequence 10.2.8 Tandem Connection Monitoring (TCM) 10.2.9 Tributary Scan 10.2.10 Round Trip Delay 10.2.11 Jitter and Wander 10.2.12 V-SCAN 11.0 PDH Tools...
- Page 7 TX300S_e-manual_D07-00-064P_RevA00 11.7.1.9 Dbackup 11.7.2 ISDN PRI Monitor 11.8 E1 VF 11.9 Jitter & Wander 12.0 DS1/3 Tools 12.1 DS1 Pulse Mask 12.2 DS1 Loop 12.3 Round Trip Delay 12.4 DS1 RX Data 12.5 DS3 Pulse Mask 12.6 DS3 FEAC 12.7 DS1 ISDN PRI 12.8 DS1 VF Tasks 12.9 Jitter &...
- Page 8 TX300S_e-manual_D07-00-064P_RevA00 14.3.1.1 Hierarchy 14.3.1.2 Interface 14.3.1.3 Pattern 14.3.2 Measurements 14.3.3 General 14.4 OTN Results 14.4.1 Summary 14.4.2 Errors/Alarms 14.4.3 Event Log 14.4.4 Signal 14.5 OTU-Xe Ethernet Applications 14.5.1 OTU-Xe with 10GE BERT 14.5.2 OTN/10GE RFC 2544 Conformance Testing 14.5.3 OTN/10GE Throughput Testing (Multiple Streams) 15.0 Ethernet 15.1 Ethernet Setup 15.1.1 Test Port Selection...
- Page 9 TX300S_e-manual_D07-00-064P_RevA00 15.2.2.2 Errors 15.2.2.3 Events 15.2.2.4 Traffic 15.2.2.5 Rates 15.2.2.6 Delay 15.2.2.7 Alarms 15.2.2.8 Signal 15.3 RFC 2544 Conformance Testing 15.3.1 Setup - Standard Mode 15.3.1.1 Header Settings 15.3.1.2 Frame Settings 15.3.1.3 Threshold Settings 15.3.1.4 Peer-to-Peer and Asymmetric Testing 15.3.1.5 Throughput, Latency, Frame Loss, and Burst Settings 15.3.1.6 Starting/Stopping a RFC 2544 Measurement 15.3.2 Results - Standard Mode 15.3.3 Saving RFC 2544 Results...
- Page 10 TX300S_e-manual_D07-00-064P_RevA00 15.5.1.7 Starting/Stopping a Throughput (Multiple Streams) Test 15.5.2 Throughput Results 15.5.2.1 Viewing Throughput (Multiple Streams) Test Results 15.5.2.2 Global/Aggregate Results 15.5.2.3 Per Stream Results 15.5.2.4 Saving Throughput (Multiple Streams) Results 15.6 Ethernet OAM Testing 15.6.1 OAM Setup 15.6.1.1 Link Level 802.3ah OAM Setup 15.6.1.2 Service Level OAM: 802.1ag/Y.1731 Setup 15.6.2 OAM Results 15.6.2.1 Link OAM Results...
- Page 11 TX300S_e-manual_D07-00-064P_RevA00 16.4 Loopback 17.0 CPRI Optical Testing 17.1 Interface Specifications 17.2 CPRI Testing 17.2.1 CPRI BERT Setup 17.2.1.1 Test Pattern 17.2.1.2 Traffic Pattern 17.2.1.3 Error Injection 17.2.2 Results 17.2.2.1 Summary 17.2.2.2 Signal 17.2.2.3 Errors 17.2.2.4 Alarms 17.2.2.5 Events 17.2.2.6 Saving and Retrieving Results 17.2.3 File Management in ReVeal 18.0 Profiles 19.0 Common Functions...
- Page 12 TX300S_e-manual_D07-00-064P_RevA00 23.0 About VeEX Go back to top...
- Page 13 No part of this document may be reproduced or transmitted electronically or otherwise without written permission from VeEX Inc. This device uses software either developed by VeEX Inc. or licensed by VeEX Inc. from third parties. The software is confidential and proprietary of VeEX Inc.
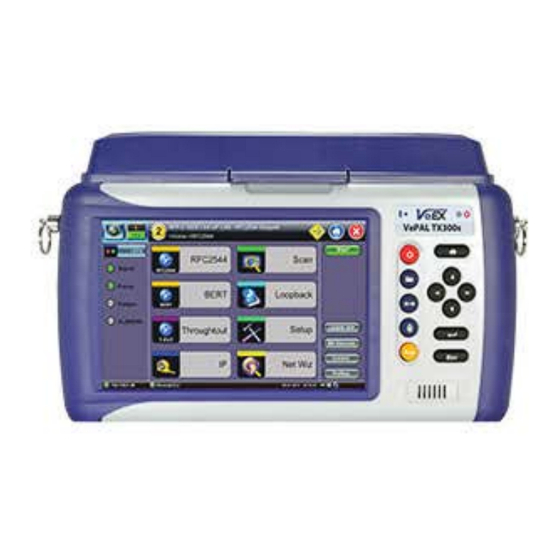
- Page 14 2.0 Introduction to TX300 Series ® VeEX TX300 series test sets are the industry's smallest portable test solutions for OTN, SDH/SONET, PDH/DSn and Ethernet/Metro Transport and Core Networks carrying Data, Voice, and Video. The units are lightweight, rugged and weather resistant, featuring OTN, SDH/SONET, Ethernet, and Fibre Channel test ports.
- Page 15 Do not operate the instrument in the presence of flammable gases or fumes or any other combustible environment. VeEX Inc. assumes no liability for the customer's failure to comply with safety precautions and requirements.
- Page 16 TX300S_e-manual_D07-00-064P_RevA00 4.0 Basic Operations The unit is powered on and off from the red key on the keypad area. In order to turn off the unit, press the Power key for at least 2 seconds. If the unit is not responding, holding the Power key down for more than 10 seconds will force the unit to power down. Go back to top Go back to TOC 4.1 Compact Platform Overview TX300S...
- Page 17 TX300S_e-manual_D07-00-064P_RevA00 Power key: The unit is powered on and off from the red key on the keypad. The button is recessed to prevent accidental power on. Press the key for 3-5 seconds to turn the unit on. To turn off the unit, press the Power key for at least 2 seconds. If the unit does not respond, holding the Power key down for more than 10 seconds will force the unit to switch off.
- Page 18 TX300S_e-manual_D07-00-064P_RevA00 Go back to top Go back to TOC 4.5 Connectors and Panels 4.5.1 Test Ports – Electrical and Optical The TX300, TX300S, TX300M and TX300e are the North American and International versions of the TX300 series test sets, respectively. Both units feature nearly identical physical test interfaces, but with two main differences for the left side ports: North American version (TX300): Bantam connectors for DS1 and E1 interfaces International version (TX300e): RJ connectors for DS1 and E1 interfaces...
- Page 19 TX300S_e-manual_D07-00-064P_RevA00 TX300M Test Ports Go back to top Go back to TOC 4.5.2 RJ-45 Interface (TX300e only) Balanced, Tx and Rx electrical interfaces for T1 and E1 signals. The port is 120 ohm for E1 signals and 100 ohm for T1 signals. Go back to top Go back to TOC 4.5.3 Bantam Interface (TX300, TX300S and TX300M only) Balanced, Tx and Rx interfaces for DS1 and E1 signals.
- Page 20 TX300S_e-manual_D07-00-064P_RevA00 To access the Ethernet port, remove the protective rubber cover on the right hand side of the unit to expose the connector. Ethernet applications include: IP connectivity testing Net Wiz testing WiFi Wiz testing Voice over IP (VoIP) testing IPTV testing Transfer measurement results and test profiles between the instrument and a computer using ReVeal TX software Upload/download channel tables between the instrument and a computer using ReVeal TX software...
- Page 21 Search for and download the latest TX300 software onto the PC. Installing New TX300 Software via USB Unzip the file. Search for a zip file with the phrase veex-arm.tar.gz, (e.g., "tx300-veex-arm.tar.gz") and copy it onto a USB stick formatted in the FAT-32 file format.
- Page 22 TX300S_e-manual_D07-00-064P_RevA00 Please refer to 7.4 Upgrade in the ReVeal MTX300 manual. Go back to top Go back to TOC...
- Page 23 TX300S_e-manual_D07-00-064P_RevA00 5.0 Home Menu and Assign Test Mode When the unit is powered on the Utilities Settings Menu is displayed on the screen. TX300S and TX300M Home Menu TX300/e Home Menu On TX300S and TX300M the screen has two presentation areas: 1.
- Page 24 TX300S_e-manual_D07-00-064P_RevA00 WiFi On Indicates whether the WiFi adaptor is connected. WiFi Off AC Power Indicates if the unit is being powered by the internal Li-ion battery or external AC power. Tap the icon for battery status if running on battery. Battery Power Provides File Storage Information.
- Page 25 TX300S_e-manual_D07-00-064P_RevA00 Tap on the Test App 1 or Test App 2 tab on the top bar of the screen. The Test Mode Selection screen will be displayed. Test Mode Selection Select the required Test Application and tap OK. The application will be loaded and the respective home menu will be displayed. Both modules can be run at the same time.
- Page 26 TX300S_e-manual_D07-00-064P_RevA00 6.0 Setup Accessing Setup On TX300S, Assign a module for the Test and then tap on Setup. On the TX300, tap on Home (main menu) > Advanced Mode > Setup On the TX300e, tap on Home (main menu) > Setup TX300 SONET Home Menu TX300e SONET Home Menu The Setup page has four tabs for setting the OTN, SDH/SONET, and PDH parameters: Signal, Measurements, General, and...
- Page 27 TX300S_e-manual_D07-00-064P_RevA00 home menu. Go back to top Go back to TOC 6.1 Signal Overview Tap on the Signal tab to set up the Transmitter and Receiver interfaces and associated test parameters prior to running a test. Signal tab TX and RX Configurations The Transmitter (TX) and Receiver (RX) configurations are grouped into a simple yet intuitive block diagram.
- Page 28 TX300S_e-manual_D07-00-064P_RevA00 Copy Menu Options Coupled: TX and RX configurations are grouped as one block; TX and RX will have identical configuration. To uncouple TX and RX settings, tap on the blue "Coupled" heading and select Independent from the Copy Menu. Tx=Rx: Tx blocks will copy the settings made in the Rx blocks Rx=Tx: Rx blocks will copy the settings made in the Tx blocks Changes to the Setup are applied immediately unless an invalid parameter has been selected.
- Page 29 TX300S_e-manual_D07-00-064P_RevA00 Go back to top Go back to TOC...
- Page 30 TX300S_e-manual_D07-00-064P_RevA00 6.2 Setup: PDH 6.2.1 Transmitter Setup Note: Depending on whether SDH or SONET was selected from the SDH/SONET option under the General tab (see 6.3 SDH Setup), TX and RX configuration screens will look slightly different, but feature the same options described in this section. Hierarchy Tapping the Hierarchy box opens the Tx Hierarchy setup screen.
- Page 31 TX300S_e-manual_D07-00-064P_RevA00 Test Port: In PDH mode, only the electrical interface selection is possible. Line Code: In DS1 mode, the line code options default to B8ZS or AMI In DS3 mode, the line code is B3ZS or AMI In E1 mode, the line code options default to HDB3 or AMI. Normal E1 systems use HDB3 line coding while AMI is reserved for special applications In E3 mode, the line code is HDB3 or AMI Clock Source: Can be configured as follows:...
- Page 32 TX300S_e-manual_D07-00-064P_RevA00 Rate: In DS1 (1.544Mbps) mode, the options are 1.544M or Fractional DS1 (Nx64 or Nx56) where: 1.544M: Configures the transmitter for full rate testing at 1.544Mbps Fractional DS1 (Nx64 or Nx56): Configures the transmitter for fractional testing using N or M 64kbps or 56kbps timeslots (contiguous or non-contiguous timeslots) In DS3 (45Mbps) mode, the options are 45M, 1.544M Mux (DS3/DS1 Mux) or Fractional DS1Mux where: 45M: Configures the transmitter for full rate testing at 45Mbps...
- Page 33 TX300S_e-manual_D07-00-064P_RevA00 Tx Pattern Setup Pattern: Use the pattern drop-down box to select the test pattern which will be inserted into the transmitted signal. Pseudo Random Bit Sequences (PRBS) defined by ITU-T 0.150 and 0.151 standards, fixed words and 24-bit or 32 bit user defined patterns are available.
- Page 34 TX300S_e-manual_D07-00-064P_RevA00 Network Type: Select PDH as the network type High Rate: Options are 1.5Mbps (DS1), 2Mbps (E1), 8Mbps (E2), 34Mbps (E3), 45Mbps (DS3), 140Mbps (E4) Dual: Dual DS1 or E1 Receiver Option ON/OFF: Receiver 2 sets exact same configuration as Receiver 1 Go back to top Go back to TOC Interface Tapping the Interface box opens the Rx Interface Setup screen shown below.
- Page 35 TX300S_e-manual_D07-00-064P_RevA00 Monitor: To be used when the measurement is made at a Protected Monitoring Point (PMP) of network equipment. The PMP level can range between -20 and -26dB. Bridge: Available on in DS1 or E1 mode. Select this mode for a high impedance monitor test or when the receiver is connected directly in parallel to an DS1 or E1 line carrying live traffic.
- Page 36 TX300S_e-manual_D07-00-064P_RevA00 Out of Service: Should be selected if the incoming signal is expected to contain a known test pattern. Deselect this option if signal is expected to contain live network traffic – this will disable the pattern detection process and will enable the reporting of LSS.
- Page 37 TX300S_e-manual_D07-00-064P_RevA00 6.3 Setup: SDH Selecting SDH from the General tab To display SDH options for the TX and RX block configuration, tap on the General tab from the Setup screen and select SDH from the SDH/SONET drop-down menu. Go back to top Go back to TOC 6.3.1 Transmitter Setup This section of the manual describes the SDH configuration capabilities.
- Page 38 TX300S_e-manual_D07-00-064P_RevA00 Network Type: In the SDH mode, only optical interface options are available. Test Rate: Options are STM-0, STM-1, STM-4, STM-16 and STM-64 (referring to 51M, 155M, 622M, 2.5G and 9.953G respectively). Go back to top Go back to TOC Tx Hierarchy - Normal Operating Mode Operating Mode: Normal, Payload, or Transparent Normal Mode: Unit working as normal SDH mode.
- Page 39 TX300S_e-manual_D07-00-064P_RevA00 Test Port: Optical or Electrical. Optical interface is available for STM-0, STM-1, STM-4, STM-16 and STM-64 signals. Electrical interface is available for STM-0E, STM-1E signals. Clock Source: Can be configured as follows: Internal clock: The clock for the transmitter is derived from the internal clock. The internal clock has an accuracy of +/- 3.5ppm conforming to G.812 recommendations.
- Page 40 TX300S_e-manual_D07-00-064P_RevA00 Mapping: Both AU-4 and AU-3 signal mappings per G.707 recommendations are supported. The multiplexing structure is shown below. Tx Structure Setup - Graphical Mode...
- Page 41 TX300S_e-manual_D07-00-064P_RevA00 AU4 Mapping: VC4-64C, VC4-16C, VC4-4C, VC4, VC3, and VC12 are available. AU3 Mapping: VC3,VC12, and TU11/VC11 are available. Bulk: Tap the check box to enable the setting. In bulk mode, the entire VT container is filled with a test pattern per ITU-T 0.181 recommendations.
- Page 42 TX300S_e-manual_D07-00-064P_RevA00 Tapping the Tx Payload box opens the Tx Payload Setup screen. Tx Payload Setup Rate: Depends on mapping selected. In TU11/VC11 mapping mode, the Low Rate options are 1.544M or Fractional DS1 (Nx64 or Nx56) where: 1.544M: Configures the transmitter for full rate testing at 1.544Mbps Fractional DS1 (Nx64 or Nx56): Configures the transmitter for fractional testing using N or M 64kbps timeslots (contiguous or non-contiguous timeslots) In VC3 mapping mode/Tributary set to DS3, the Low Rate options are 45M, 1.544M Mux (DS3/DS1 Mux), or Fractional DS1...
- Page 43 TX300S_e-manual_D07-00-064P_RevA00 Pattern Tapping the Tx Pattern box opens the Tx Pattern Setup screen. Tx Pattern Setup PRBS Pattern: Use the pattern drop-down box to select the test pattern which will be inserted into the transmitted signal. Pseudo Random Bit Sequences (PRBS) defined by ITU-T 0.150 and 0.151 standards, fixed words and 24-bit or 32 bit user defined patterns are available.
- Page 44 TX300S_e-manual_D07-00-064P_RevA00 Go back to top Go back to TOC Interface Tapping the Interface setup box opens the Rx Interface screen. The Interface setup options for the Rx are the same as for the Tx described previously, except for clock offset, which is only available in Tx. Rx Interface Setup Note: Remember to use an optical attenuator to prevent receiver overload or damage –...
- Page 45 TX300S_e-manual_D07-00-064P_RevA00 Go back to top Go back to TOC Structure and Payload SDH Rx Structure and Payload configurations are the same as for SDH Tx setup described previously. Rx Structure Setup...
- Page 46 TX300S_e-manual_D07-00-064P_RevA00 Rx Payload Setup Go back to top Go back to TOC Pattern Tapping the Pattern box opens the Rx Pattern setup screen. The pattern setup options for the Rx are the same as for the Tx described previously, except for the Out of Service selection, which should be selected if the incoming signal is expected to contain a known test pattern.
- Page 47 TX300S_e-manual_D07-00-064P_RevA00 Go back to top Go back to TOC...
- Page 48 TX300S_e-manual_D07-00-064P_RevA00 6.4 Setup: SONET Selecting SONET from the General tab To display SONET options for the TX and RX block configuration, tap on the General tab from the Setup screen and select SONET from the SDH/SONET drop-down menu. Go back to top Go back to TOC 6.4.1 Transmitter Setup This section of the manual describes the SONET configuration capabilities.
- Page 49 TX300S_e-manual_D07-00-064P_RevA00 Network Type: In the SONET mode, only optical interface options are available. Test Rate: Options are STS-1, OC-3, OC-12, OC-48, OC-192 (referring to 51M, 155M, 622M, 2.5G and 9.953G respectively). Go back to top Go back to TOC Hierarchy > Through Mode Tapping the Hierarchy box opens the Tx Hierarchy Setup screen.
- Page 50 TX300S_e-manual_D07-00-064P_RevA00 Test Port: Optical or Electrical. Optical interface is available for OC-1, OC-3, OC-12, OC-48 and OC-192 signals. Electrical interface is available for STS-1 and STS-3 signals. Clock Source: Can be configured as follows. Internal clock: The clock for the transmitter is derived from the internal clock. The internal clock has an accuracy of +/- 3.5ppm conforming to G.812 recommendations.
- Page 51 TX300S_e-manual_D07-00-064P_RevA00 Mapping: STS-192C, STS-48C, STS-12C, STS-3C, STS-1 and VT1.5 is available. VT-2 is optional. STS mappings per Bellcore GR-253 and ANSI T1.105 recommendations are supported. The multiplexing structure is shown below. Tx Structure Setup - Graphical Mode...
- Page 52 TX300S_e-manual_D07-00-064P_RevA00 Channel Selection: The Tx channel is selected by entering the STS-N, VT-GRP, and VT-1.5 SPE channel. Bulk: Tap the check box to enable the setting. In Bulk mode, the entire VT container is filled with a test pattern per ITU-T 0.181 recommendations.
- Page 53 TX300S_e-manual_D07-00-064P_RevA00 Payload Tapping the Tx Payload box opens the Tx Payload Setup screen. Tx Payload Setup Rate: Depends on mapping selected: In VT-1.5 mapping mode, The Low Rate options are 1.544M or Fractional DS1 (Nx64 or Nx56) where: 1.544M: Configures the transmitter for full rate testing at 1.544Mbps Fractional DS1 (Nx64 or Nx56): Configures the transmitter for fractional testing using N or M 64kbps timeslots (contiguous or non-contiguous timeslots) In STS-1 mapping mode/Tributary set to DS3, the Low Rate option are 45M or 1.544M Mux (DS3/DS1 Mux) or Fractional DS1...
- Page 54 TX300S_e-manual_D07-00-064P_RevA00 In E1 mode, the options are unframed, PCM31, PCM31C, PCM30, and PCM30C. Framing conforms to G.704 and G.706 recommendations and are briefly described below. In E3 mode, the options are unframed, framed G.751. Go back to top Go back to TOC Pattern Tapping the Tx Pattern box opens the Tx Pattern Setup screen.
- Page 55 TX300S_e-manual_D07-00-064P_RevA00 Go back to top Go back to TOC Interface Tapping the Interface setup box opens the Rx Interface screen. The Interface setup options for the Rx are the same as for the Tx described previously, except for clock offset, which is not possible. Interface Rx Setup Note: Remember to use an optical attenuator to prevent receiver overload or damage –...
- Page 56 TX300S_e-manual_D07-00-064P_RevA00 Go back to top Go back to TOC Structure Tapping the Structure setup box opens the Rx Structure screen. The Structure setup options for the Rx are the same as for the Tx described previously. Rx Structure Setup - Graphical Mode...
- Page 57 TX300S_e-manual_D07-00-064P_RevA00 Go back to top Go back to TOC Payload Tapping the Payload setup box opens the Rx Payload screen. The Payload setup options for the Rx are the same as for the SONET Tx setup described previously. Rx Payload Setup Go back to top Go back to TOC Pattern Tapping the Pattern box opens the Rx Pattern setup screen.
- Page 58 TX300S_e-manual_D07-00-064P_RevA00 Go back to top Go back to TOC...
- Page 59 TX300S_e-manual_D07-00-064P_RevA00 6.5 Setup: OTN/SDH Selecting SDH from the General tab To verify that the Tx and Rx block diagrams are OTN/SDH, verify that SDH is selected from the SDH/SONET drop-down menu under the General tab. Go back to top Go back to TOC 6.5.1 OTN Transmitter Setup This section of the manual describes the OTN configuration capabilities.
- Page 60 TX300S_e-manual_D07-00-064P_RevA00 Network Type: In the OTN mode, only optical interface options are available Test Rate: Options are OTU-1 and OTU-2 (referring to 2.66G and 10.709G respectively) OTN Mapping: SYNC, ASYNC, and PRBS pattern Note: ITU-T G.709 and both AU-4 and AU-3 signal mappings per G.707 recommendations are supported. The multiplexing structure is shown below.
- Page 61 TX300S_e-manual_D07-00-064P_RevA00 Tx Structure Setup - Graphical Mode Tx Payload Setup...
- Page 62 TX300S_e-manual_D07-00-064P_RevA00 Tx Pattern Setup Go back to top Go back to TOC 6.5.2 Receiver Setup Hierarchy Tapping the Hierarchy setup box opens the Rx Hierarchy screen. The Hierarchy setup options for the Rx are the same as for the Tx described previously. Rx Hierarchy Setup Go back to top Go back to TOC Interface...
- Page 63 TX300S_e-manual_D07-00-064P_RevA00 Go back to top Go back to TOC Structure and Payload OTN/SDH Rx Structure and Payload configurations are the same as for OTN/SDH Tx setup described previously. Rx Structure Rx Payload...
- Page 64 TX300S_e-manual_D07-00-064P_RevA00 Go back to top Go back to TOC Pattern Tapping the Pattern box opens the Rx Pattern setup screen. The Pattern setup options for the Rx are the same as for the Tx described previously, except for the Out of Service selection, which should be selected if the incoming signal is expected to contain a known test pattern.
- Page 65 TX300S_e-manual_D07-00-064P_RevA00 6.6 Setup: OTN/SONET Selecting SONET from the General tab To verify that the Tx and Rx block diagrams are OTN/SONET, verify that SONET is selected from the SDH/SONET drop-down menu under the General tab. Go back to top Go back to TOC 6.6.1 Transmitter Setup This section of the manual describes the OTN configuration capabilities.
- Page 66 TX300S_e-manual_D07-00-064P_RevA00 Network Type: In the OTN mode, only optical interface options are available Test Rate: Options are OTU-1 and OTU-2 (referring to 2.66G and 10.709G respectively) OTN Mapping: SYNC, ASYNC, and PRBS pattern Note: ITU-T G.709 and STS mappings per Bellcore GR-253 and ANSI T1.105 recommendations are supported. The multiplexing structure is shown below.
- Page 67 TX300S_e-manual_D07-00-064P_RevA00 Tx Structure Setup - Text Mode Tx Structure Setup - Graphical Mode...
- Page 68 TX300S_e-manual_D07-00-064P_RevA00 Tx Payload Setup Tx Pattern Setup Go back to top Go back to TOC 6.6.2 Receiver Setup Hierarchy Tapping the Hierarchy setup box opens the Rx Hierarchy screen. The Hierarchy setup options for the Rx are the same as for the Tx described previously.
- Page 69 TX300S_e-manual_D07-00-064P_RevA00 Go back to top Go back to TOC Interface Tapping the Interface setup box opens the Rx Interface screen. The Interface setup options for the Rx are the same as for the Tx described previously, except for clock offset, which is only available in Tx. Rx Interface Go back to top Go back to TOC Structure and Payload...
- Page 70 TX300S_e-manual_D07-00-064P_RevA00 Rx Payload Go back to top Go back to TOC Pattern Tapping the Pattern box opens the Rx Pattern setup screen. The Pattern setup options for the Rx are the same as for the Tx described previously, except for the Out of Service selection, which should be selected if the incoming signal is expected to contain a known test pattern.
- Page 71 TX300S_e-manual_D07-00-064P_RevA00 Go back to top Go back to TOC...
- Page 72 TX300S_e-manual_D07-00-064P_RevA00 6.7 Measurement Configuration Tapping the Measurements tab opens the setup screen for the Timer, Performance Analysis, and General configurations. Measurements tab Go back to top Go back to TOC 6.7.1 Timer Setup Configure a test to run for a fixed duration or a delayed start. Mode: Manual, Timed, and Auto selections are available Manual: This is linked to the Start/Stop function on the drop-down menu Timed: The test duration can be set by the user.
- Page 73 TX300S_e-manual_D07-00-064P_RevA00 The recommendations are briefly defined as follows: G.821: Error performance of an international digital connection operating at a bit rate below the primary rate and forming part of an Integrated Service Digital Network (ISDN) Long term error performance conducted Out of Service (OOS) Based on measuring bit errors Evaluation period of 30 days Since there is no overhead structure at these bit rates, in-service measurements are extremely difficult...
- Page 74 TX300S_e-manual_D07-00-064P_RevA00 Go back to top Go back to TOC 6.7.3 General The General setup page configures the audible alarm and APS protocol settings. General tab APS Protocol: Linear or Ring architectures are selectable. This determines how the APS bytes (K1/K2) are decoded in the SDH Overhead Analyzer or how they are generated in the SDH Overhead Generator.
- Page 75 TX300S_e-manual_D07-00-064P_RevA00 Auto-config tab The Auto-Config function automatically sets the receiver of the test set. A search for SDH and PDH signals at both the electrical or optical inputs is performed to determine the signal structure. For electrical signals, both Terminated and PMP voltage ranges are searched and supported.
- Page 76 TX300S_e-manual_D07-00-064P_RevA00 7.0 Results Accessing Results To access measurements for PDH, SDH, SONET, and OTN, tap on Start, which starts testing, or Results. Results icon Go back to top Go back to TOC 7.1 Results: PDH 7.1.1 Summary The Summary tab displays an overview of the major test parameters. At a glance, the user is able to see if there are any alarms, errors, or signal failure.
-
Page 77: Errors And Alarms
TX300S_e-manual_D07-00-064P_RevA00 Go back to top Go back to TOC 7.1.2 Errors and Alarms The Error/Alarm tab brings up several pages showing the errors and alarm status. Alarms/Errors results provides an overview of all the Errors and Alarms applicable to the signal or network under test. The color of the page tab is normally blue; however, it will turn red when an alarm error condition has been detected or recorded. - Page 78 TX300S_e-manual_D07-00-064P_RevA00 Errors/Alarms (Page 2) Page 2 lists the Alarms in logical order that are associated with the signal under test. All alarms are evaluated and stored. The time resolution of alarms is 100ms. Errors/Alarms - PDH (Page 2) Go back to top Go back to TOC Errors/Alarms (Page 3) Page 3 lists the Errors in logical order that are associated with the signal under test.
- Page 79 TX300S_e-manual_D07-00-064P_RevA00 Errors/Alarms - BERT (Page 4) Go back to top Go back to TOC 7.1.3 Event Log The Event log tab brings up the screen listing the Error and Alarm events recorded during a test. The events are presented in chronological sequence: Number (#): Event number, events are numbered sequentially Type: Indicates alarm or error type...
- Page 80 TX300S_e-manual_D07-00-064P_RevA00 The Signal tab brings up the frequency and level result screen. Signal tab Frequency: The received signal frequency and offset is measured and displayed. For E1 signals, the measurement is performed on both balanced 100 ohm and unbalanced 75 ohm interfaces. Current: Indicates the frequency of the input signal Offset: Indicates the difference between the standard rate and the rate of the input signal Min (ppm): Indicates the difference between the standard rate and the minimum deviation detected in the input signal...
- Page 81 TX300S_e-manual_D07-00-064P_RevA00 Go back to top Go back to TOC 7.1.5 Histogram The Histogram tab displays a historical record of the Alarms and Errors recorded during the measurement interval. A dedicated page is available for errors and alarms including BER. Scroll through the various pages to display the anomalies of interest. Histogram - E1 Alarms (Page 1) The alarms and errors presented will depend on the signal type and structure selected.
- Page 82 TX300S_e-manual_D07-00-064P_RevA00 Go back to top Go back to TOC 7.1.6 Graph The Graph tab brings up a screen displaying a log of the errors recorded during the measurement interval. A dedicated page is available for each error type. Scroll through the various pages to display the anomaly of interest. Graph tab A graphical timeline on the horizontal axis indicates when the event occurred while the vertical axis indicates the logarithmic scale of errors.
- Page 83 TX300S_e-manual_D07-00-064P_RevA00 The Analysis tab displays measured objectives from ITU-T performance tests selected from the Measurements tab (Setup > Measurements). For a brief description of supported G-Series and M-Series performance tests as well as setup instructions, please see 6.7.2 Performance Analysis. Evaluation According to ITU-T G.821 This recommendation was originally specified for international circuit-switched N x 64kbps connections and later expanded to include higher bit rates.
- Page 84 TX300S_e-manual_D07-00-064P_RevA00 Evaluation According to ITU-T G.826 G.826 recommendation makes provision for higher bit rates and allows in-service measurement using the evaluation of block errors. The following are evaluated: ES, SES, BE, BBE, and UAS. Pass/Fail result depends on path allocation of 0.1 to 100%. In-Service Measurement (ISM): Simultaneous in-service measurement of “near end”...
- Page 85 TX300S_e-manual_D07-00-064P_RevA00 Evaluation According to ITU-T G.828 G.828 provides a precise block length for each bit rate as opposed to G.826. ES, SES, BBE, UAS and SEP are evaluated. Pass/Fail result is in conjunction with path allocation between 0.1 and 100%. G.828 evaluation can be performed on the following events: MS-REI HP-REI...
- Page 86 TX300S_e-manual_D07-00-064P_RevA00 Evaluation According to ITU-T G.829 G.829 is based on the principle of monitoring block errors in service. ES, SES, BBE and UAS are evaluated. G.829 evaluation can be performed on the following events: MS-REI Bit errors (TSE) Evaluation of the near end and far-end is possible, however far-end measurement can only be made if REI is available. Bit errors can be evaluated for: Unframed patterns Framed patterns and bulk signals...
- Page 87 TX300S_e-manual_D07-00-064P_RevA00 Evaluation According to ITU-T M.2100 M.2100 applies to commissioning and maintenance. Commissioning consists of a 15-minute line up phase followed by a 24-hour in-service measurement. Once the line up phase is completed successfully, errors may occur within certain limits. ES, SES and UAS are evaluated.
- Page 88 TX300S_e-manual_D07-00-064P_RevA00 The M.2101 evaluation can be performed on the following events: MS-REI HP-REI LP-BIP LP-REI Bit errors (TSE) Evaluation of the near end and far-end is possible but far-end evaluations can only be made if REI is available. Bit errors can be evaluated for: Unframed patterns Framed patterns and bulk signals Overhead bytes E1/E2 (order wire), F1/F2 (user), D1 - D3 and D4 - D12 (DCC) in the SDH Overhead (SOH and POH)
- Page 89 TX300S_e-manual_D07-00-064P_RevA00 7.2 Results: SDH 7.2.1 Summary The Summary tab displays a summary of test results and parameters. At a glance, the user is able to see if there are any alarms, errors, or signal failure pertaining to the SDH signal and its payload. Summary (Page 1) SDH mapping information is displayed on page 2 and 3.
- Page 90 TX300S_e-manual_D07-00-064P_RevA00 Go back to top Go back to TOC 7.2.2 Errors and Alarms The Errors/Alarms tab brings up several pages showing the errors and alarms status. Page 1 provides an overview of all the Errors and Alarms applicable to the signal or network under test. The color of the page tab is normally blue;...
- Page 91 TX300S_e-manual_D07-00-064P_RevA00 The LED headers are described in the table below: SDH Error and Alarm defection criteria per ITU-T G.707 and O.150 recommendations: SDH Error and Alarm defection criteria per ITU-T G.707 and O.150 recommendations:...
- Page 92 TX300S_e-manual_D07-00-064P_RevA00...
- Page 93 TX300S_e-manual_D07-00-064P_RevA00 PDH alarms are described in Results. Go back to top Go back to TOC Errors/Alarms (Page 2) Page 2 lists the SDH Errors in logical order that are associated with the signal under test. All errors are evaluated and stored. The Elapsed Time [ET] is shown in the right hand corner of the header.
- Page 94 TX300S_e-manual_D07-00-064P_RevA00 Page 3 lists the Section and Line Overhead Alarms in logical order associated with the signal under test. All alarms are evaluated and stored. The Elapsed Time [ET] since the start of the test is shown in the upper right hand corner. The alarms associated with the Section and Line are displayed separately for ease of interpretation.
- Page 95 TX300S_e-manual_D07-00-064P_RevA00 Go back to top Go back to TOC Errors/Alarms (Page 6) Page 6 lists the PDH Alarms in logical order that are associated with the signal and payload under test. All alarms are evaluated and stored. Errors/Alarms (Page 6) Go back to top Go back to TOC Errors/Alarms (Page 7) Page 7 lists the PDH Errors in logical order that are associated with the signal and payload under test.
-
Page 96: Event Log
TX300S_e-manual_D07-00-064P_RevA00 Errors/Alarms (Page 8) Page 8 lists the BERT Errors in logical order that are associated with the signal and payload under test. All errors are evaluated and stored. Errors/Alarms (Page 8) Go back to top Go back to TOC 7.2.3 Event Log The Event Log tab brings up the screen listing the Error and Alarm events recorded during a test. -
Page 97: Signal
TX300S_e-manual_D07-00-064P_RevA00 Go back to top Go back to TOC 7.2.4 Signal The signal tab displays the Level and Frequency screen. Page 1 displays the level measurement in electrical units (volts) for STM-1, STM-4, STM-16 and STM-64 signals. Loss of Signal (LOS) and the Saturation level for optical signals is shown graphically including the level measurement in dBm. Signal (Page 1) Frequency (Page 2) The received signal frequency and offset is measured and displayed. - Page 98 TX300S_e-manual_D07-00-064P_RevA00 Frequency: The received signal frequency and offset is measured and displayed. SDH Current: Indicates the frequency of the input signal. Offset: Indicates the difference between the standard rate and the rate of the input signal. Min (ppm): Indicates the difference between the standard rate and the minimum deviation detected in the input signal. Max (ppm): Indicates the difference between the standard rate and the maximum deviation detected in the input signal.
- Page 99 TX300S_e-manual_D07-00-064P_RevA00 Signal > Optical Information (Page 4) Page 4 displays the Optical module (SFP or XFP) Power Measurement Graph. Signal - Optical (Page 4) Go back to top Go back to TOC 7.2.5 Histogram The Histogram tab displays the screen showing a historical record of the Alarms and Errors recorded during the measurement interval.
-
Page 100: Histogram
TX300S_e-manual_D07-00-064P_RevA00 Note: The alarms and errors presented depend on the signal type and structure selected. A graphical timeline on the horizontal axis indicates when the event occurred. The upper left and right arrows allow the user to scroll through the measurement period while the + and –... - Page 101 TX300S_e-manual_D07-00-064P_RevA00 Histogram - AU Alarms/Errors (Page 3) Go back to top Go back to TOC Histogram (Page 4) Page 4 displays the Alarms and Errors associated with the High Order Path (HP, SDH). The measured parameters are: HP-UNE (HP-Unequipped) HP-PLM (HP-Payload Mismatch) HP-TIM (HP-Trace Identifier Mismatch) HP-RDI (HP-Remote Defect Indication) B3 errors...
- Page 102 TX300S_e-manual_D07-00-064P_RevA00 TU-AIS (TU-Alarm Indication Signal) TU-LOP (TU-Loss of Pointer) Histogram - TU Alarms/Errors (Page 5) Go back to top Go back to TOC Histogram (Page 6) Page 6 displays the Alarms and Errors associated with the Low Order Path (LP,SDH). The measured parameters are: LP-UNE (LP-Unequipped) LP-PLM (LP-Payload Mismatch) LP-TIM (LP-Trace Identifier Mismatch)
- Page 103 TX300S_e-manual_D07-00-064P_RevA00 Go back to top Go back to TOC Histogram (Page 7) Page 7 displays the Alarms associated with the payload. The measured parameters depend on the payload selected. Histogram - E1 Alarms (Page 7) Go back to top Go back to TOC Histogram (Page 8) Page 8 displays the Errors associated with the test pattern.
-
Page 104: Graph
TX300S_e-manual_D07-00-064P_RevA00 is available for each of the following error types: MS-REI HP-REI LP-BIP LP-REI PDH errors depending on payload Scroll through the various pages to display the anomaly of interest. A status pop-up screen can be accessed by tapping on the graph area. - Page 105 TX300S_e-manual_D07-00-064P_RevA00 The Analysis tab displays measured objectives from ITU-T performance tests selected from the Measurements tab (Setup > Measurements). Please see 7.1.5 Analysis for information on the Analysis tab and test definitions. For a brief description of supported G-Series and M-Series performance tests as well as setup instructions, please see 6.7.2 Performance Analysis.
- Page 106 TX300S_e-manual_D07-00-064P_RevA00 7.3 Results: SONET 7.3.1 Summary The Summary tab displays a summary of test results and parameters. At a glance, the user is able to see if there are any alarms, errors, or signal failure pertaining to the SONET signal and its payload. Summary (Page 1) SONET mapping information is displayed on page 2 and 3.
- Page 107 TX300S_e-manual_D07-00-064P_RevA00 7.3.2 Errors/Alarms The Errors/Alarms tab brings up several pages showing error and alarm statuses. Page 1 provides an overview of all the Errors and Alarms applicable to the signal or network under test. The color of the page tab is normally blue; however, it will turn red when an alarm error condition has been detected or recorded. The soft LEDs on screen are arranged logically and will depend on signal hierarchy, structure, payload, and framing selected.
- Page 108 TX300S_e-manual_D07-00-064P_RevA00 SONET Error and Alarm definitions per Bellcore GR.253 and ANSI T1.105 recommendations: SONET Error and Alarm defection criteria per Bellcore GR.253 and ANSI T1.105/231:...
- Page 109 TX300S_e-manual_D07-00-064P_RevA00 PDH alarms are described in Results. Go back to top Go back to TOC Errors/Alarms (Page 2) Page 2 lists the SONET Errors in logical order that are associated with the signal under test. All errors are evaluated and stored. The Elapsed Time [ET] is shown in the right hand corner of the header.
- Page 110 TX300S_e-manual_D07-00-064P_RevA00 rate. Errors/Alarms (Page 2) Go back to top Go back to TOC Errors/Alarms (Page 3) Page 3 lists the Section and Line Overhead Alarms in logical order associated with the signal under test. All alarms are evaluated and stored. The Elapsed Time [ET] since the start of the test is shown in the upper right hand corner. Errors/Alarms (Page 3) The alarms associated with the Section and Line are displayed separately for ease of interpretation.
- Page 111 TX300S_e-manual_D07-00-064P_RevA00 Errors/Alarms (Page 4) Errors/Alarms (Page 5) Go back to top Go back to TOC Errors/Alarms (Page 6) Page 6 lists the PDH/DSn Alarms in logical order that are associated with the signal and payload under test. All alarms are evaluated and stored.
- Page 112 TX300S_e-manual_D07-00-064P_RevA00 Go back to top Go back to TOC Errors/Alarms (Page 7) Page 7 lists the PDH/DSn Errors in logical order that are associated with the signal and payload under test. All errors are evaluated and stored. Errors/Alarms (Page 7) Errors/Alarms (Page 8) Page 8 lists the BERT Errors in logical order that are associated with the signal and payload under test.
- Page 113 TX300S_e-manual_D07-00-064P_RevA00 Go back to top Go back to TOC 7.3.3 Event Log The Event log tab brings up the screen listing the Error and Alarm events recorded during a test. The events are presented in chronological sequence - number, type of event, start time and duration and duration (alarms) and ratio/count (errors) are displayed.
- Page 114 TX300S_e-manual_D07-00-064P_RevA00 Signal (Page 1) Go back to top Go back to TOC Signal > Frequency (Page 2) The received signal frequency and offset is measured and displayed. For SONET signals, the measurement is performed on both electrical (BNC) and optical interfaces (SFP or XFP). Frequency (Page 2) Frequency: The received signal frequency and offset is measured and displayed.
- Page 115 TX300S_e-manual_D07-00-064P_RevA00 Low quality clock sources that deviate from the nominal value cause problems in the operation of network elements. It is necessary and recommended to measure the signal frequency at all hierarchies to reduce synchronization risks. To measure line frequency in service, the TX300/e must be connected to a Protected Monitoring Point (PMP). The frequency of the signal is normally reported in Hz, while the deviation is reported in ppm.
- Page 116 TX300S_e-manual_D07-00-064P_RevA00 Signal > Optical Information (Page 4) Page 4 displays the Optical module (SFP or XFP) Power Measurement Graph. Signal - Optical (Page 4) Go back to top Go back to TOC 7.3.5 Histogram The Histogram tab displays the screen showing a historical record of the Alarms and Errors recorded during the measurement interval.
- Page 117 TX300S_e-manual_D07-00-064P_RevA00 Note: The alarms and errors presented depend on the signal type and structure selected. A graphical timeline on the horizontal axis indicates when the event occurred. The upper left and right arrows allow the user to scroll through the measurement period while the + and –...
- Page 118 TX300S_e-manual_D07-00-064P_RevA00 Histogram - P Alarms/Errors (Page 3) Go back to top Go back to TOC Histogram (Page 4) Page 4 displays the Alarms and Errors associated with the STS Path. The measured parameters are: UNEQ-P (STS Path-Unequipped) PLM-P (STS Path-Payload Mismatch) TIM-P (STS Path-Trace Identifier Mismatch) RDI-P (STS Path-Remote Defect Indication) B3 errors...
- Page 119 TX300S_e-manual_D07-00-064P_RevA00 AIS-V (VT-Alarm Indication Signal) LO-VP (VT-Loss of Pointer) Histogram - VT Alarms/Errors (Page 5) Go back to top Go back to TOC Histogram (Page 6) Page 6 displays the Alarms and Errors associated with the VT Path. The measured parameters are: UNEQ-V (VT-Unequipped) PLM-V (VT-Payload Mismatch) TIM-V (VT-Trace Identifier Mismatch)
- Page 120 TX300S_e-manual_D07-00-064P_RevA00 Go back to top Go back to TOC Histogram (Page 7) Page 7 displays the Alarms and Errors associated with the payload. The measured parameters depend on the payload selected. Histogram - DS1 Alarms (Page 7) Go back to top Go back to TOC Histogram (Page 8) Page 8 displays the Bit Errors associated with the test pattern.
- Page 121 TX300S_e-manual_D07-00-064P_RevA00 The Graph tab brings up the screen displaying a log of the Errors recorded during the measurement interval. A dedicated page is available for each of the following error types: REI-S REI-P BIP-V REI-V PDH/DSn errors depending on payload Scroll through the various pages to display the anomaly of interest.
- Page 122 TX300S_e-manual_D07-00-064P_RevA00 The Analysis tab displays measured objectives from ITU-T performance tests selected from the Measurements tab (Setup > Measurements). Please see 7.1.7 Analysis for information on the Analysis tab and test definitions. For a brief description of supported G-Series and M-Series performance tests as well as setup instructions, please see 6.7.2 Performance Analysis.
-
Page 123: Results: Otn
TX300S_e-manual_D07-00-064P_RevA00 7.4 Results: OTN Measurements are accessed by tapping the Results icon in the main menu. The results comprise a range of tabbed pages, similar to the setup pages. 7.4.1 Summary The Summary tab displays a summary page of test results and parameters. At a glance, the user is able to see if there are any alarms, errors or signal failure pertaining to the OTN/SDH signal and its payload. -
Page 124: Errors And Alarms
TX300S_e-manual_D07-00-064P_RevA00 Summary (Page 3) Go back to top Go back to TOC 7.4.2 Errors and Alarms The Error/Alarm tab brings up several pages showing the errors and alarm status. Page 1 provides an overview of all the Errors and Alarms applicable to the signal or network under test. The color of the page tab is normally blue;... - Page 125 TX300S_e-manual_D07-00-064P_RevA00 information. The LED headers are described in the table below: OTN Error and Alarm definitions per ITU-T G.709 recommendations:...
- Page 126 TX300S_e-manual_D07-00-064P_RevA00...
- Page 127 TX300S_e-manual_D07-00-064P_RevA00 SDH/PDH alarms are described previously Go back to top Go back to TOC Errors/Alarms (Page 3) Page 3 lists the OTU Errors in logical order that are associated with the signal under test. All errors are evaluated and stored. The Elapsed Time [ET] is shown in the right hand corner of the header.
- Page 128 TX300S_e-manual_D07-00-064P_RevA00 Errors/Alarms (Page 3) Go back to top Go back to TOC Errors/Alarms (Page 4 & 5) Page 4 lists the OTU Alarms in logical order associated with the signal under test. All alarms are evaluated and stored. The Elapsed Time [ET] since the start of the test is shown in the upper right hand corner. Errors/Alarms (Page 4) Errors/Alarms (Page 5)
- Page 129 TX300S_e-manual_D07-00-064P_RevA00 The alarms associated with the Section and Line are displayed separately for ease of interpretation. Go back to top Go back to TOC Errors/Alarms (Page 6 & 7) Page 6 & 7 lists the ODU/OPU errors and alarms in logical order that are associated with the signal under test. All alarms are evaluated and stored.
- Page 130 TX300S_e-manual_D07-00-064P_RevA00 Go back to top Go back to TOC Errors/Alarms (Page 8 to 14) Page 8 to 14 lists the SDH/PDH Alarms in logical order that are associated with the signal and payload under test. All alarms are evaluated and stored. See PDH details in Section 7.1 See SDH details in...
- Page 131 TX300S_e-manual_D07-00-064P_RevA00 Frequency (Page 2) The received signal frequency and offset is measured and displayed. For OTN signals, the measurement is performed on the optical interfaces (SFP for OTU-1) or (XFP for OTU-2). OTN Current: Indicates the frequency of the input signal Offset (ppm): Indicates the difference between the standard rate and the bit rate of the input signal Min (ppm): Indicates the difference between the standard rate and the minimum deviation detected in the input signal...
- Page 132 TX300S_e-manual_D07-00-064P_RevA00 Go back to top Go back to TOC Optical Histogram (Page 4) Displays the Optical Transceiver (SFP or XFP) Power Measurement Graph. This is useful for troubleshooting defective XFPs or for monitoring intermittent optical power fluctuations Signal (Page 4) Go back to top Go back to TOC...
-
Page 133: Alarm Generation
TX300S_e-manual_D07-00-064P_RevA00 8.0 Alarm Generation and Error Insertion Accessing Alarm Generation and Error Insertion On the TX300, tap on Home (main menu) > Advanced Mode > Alarm/Error On the TX300e, tap on Home (main menu) > Alarm/Error The alarm and error functions are used in conjunction with the drop-down menu which has dedicated buttons for error injection and alarm generation. -
Page 134: Pdh Alarms
TX300S_e-manual_D07-00-064P_RevA00 Go back to top Go back to TOC 8.1.1 PDH Alarms The following PDH and T-Carrier alarms can be generated: E1 signals: LOS, LOF, AIS, RDI E3 signals: LOS, LOF, AIS, RDI E4 signals: LOS, LOF, AIS, RDI DS1 signals: AIS, Yellow, idle, LOS, LOF DS3 signals: LOS, LOF, OOF, AIS, Parity Mode: Static (enable/disable) using drop-down menu function. -
Page 135: Otn Alarms
TX300S_e-manual_D07-00-064P_RevA00 STM-1/4/16/64 (depends on signal structure): LOS, LOF, MS-AIS, MS-RDI, RS-TIM, AU-LOP, AU-AIS, HP-UNEQ, HP- PLM, HP-RDI, HP-TIM, TU-LOM, TU-LOP, TU-AIS, LP-UNEQ, LP-PLM, LP-RDI, LP-RFI, LP-TIM Payload alarms (depends on payload): DS1-AIS, DS1-LOF, 2M-AIS, 2M-RDI, 2M-LOF, 34M-AIS, 34M-LOF, 34M-RDI, 45M-AIS Mode: Static (enable/disable) using drop-down menu function. -
Page 136: Error Insertion
TX300S_e-manual_D07-00-064P_RevA00 Go back to top Go back to TOC 8.2 Error Insertion OTN, SDH, PDH and T-Carrier errors can be generated. 8.2.1 PDH & T-Carrier Errors The following PDH and T-Carrier errors can be inserted: E1 signals: Code, FAS, CRC, REI, E-bit, Bit E3 signals: Code, FAS, Bit E4 signals: FAS, Bit DS1 signals: Code, FAS, Bit... -
Page 137: Sdh Errors
TX300S_e-manual_D07-00-064P_RevA00 Go back to top Go back to TOC 8.2.2 SDH Errors The following SDH errors can be generated: STM-1/4/16/64 signals: FAS, B1, B2, MS-REI, B3, HP-REI, LP-BIP, LP-REI, Depends on payload: 2M-FAS, 2M-CRC, 2M-REI, 34M-FAS, 45M-FAS, 1.5M-FAS SDH Error Type Go back to top Go back to TOC 8.2.3 OTN Errors OTU-1/2 signals: FAS, MFAS, BIP, BEI, Corrected FEC errors, Uncorrectable FEC... - Page 138 TX300S_e-manual_D07-00-064P_RevA00 Go back to top Go back to TOC Error Flow: OTN, SDH, SONET, PDH signals Injects different anomalies into the transmit signal. Error insertion flow modes include: Single: Inserts a single error every time the insertion button is tapped Count: Specific count or number of errors when the insertion button is tapped Rate: Specific rate between 1x10 and 5x10...
-
Page 139: Otn Tools
TX300S_e-manual_D07-00-064P_RevA00 9.0 OTN Tools 9.1 Shortcuts Accessing OTN Tools On the TX300, tap on Home (main menu) > Advanced Mode > OTN Tools On the TX300e, tap on Home (main menu) > OTN Tools OTN Tools Menu Overhead Analyzer: Displays the Optical Channel Transport Unit (OTU) Displays Optical Channel Data Unit (ODU) Displays Optical channel Payload Unit (OPU) bytes of the received channel Overhead Generator:... -
Page 140: Overhead Analyzer & Generator
TX300S_e-manual_D07-00-064P_RevA00 Go back to top Go back to TOC 9.2 Overhead Analyzer & Generator Tap the Overhead Analyzer icon to display the OH screens shown below. Overhead Analyzer Menu The Overhead is color coded for simplified viewing. Decoding Bytes Tapping the applicable byte enables an automatic decode – a byte description including the Hexadecimal and Binary value is provided. -
Page 141: Optical Transport Unit (Otu) Analysis
TX300S_e-manual_D07-00-064P_RevA00 The OTU framing is divided into two portions: FAS and MFAS. Frame Alignment Signal (FAS) Uses the first six bytes and, similar to SONET/SDH, it is used to provide framing for the entire signal In order to provide enough 1/0 transitions for synchronization, scrambling is used over the entire OTU frame, except for the FAS bytes MultiFrame Alignment Signal (MFAS) Byte is used to extend command and management functions over several frames... -
Page 142: Optical Data Unit (Odu) Analysis
TX300S_e-manual_D07-00-064P_RevA00 Reserved (RES) bytes are currently undefined in the standard. Go back to top Go back to TOC 9.2.3 Optical Data Unit (ODU) Analysis The ODU overhead is divided into several fields: RES, PM, TCMi, TCM ACT, FTFL, EXP, GCC1/GCC2 and APS/PCC. Reserved (RES) bytes are undefined and set aside for future applications. - Page 143 TX300S_e-manual_D07-00-064P_RevA00 Go back to top Go back to TOC TCMi: There are six Tandem Connection Monitoring (TCMi) fields that define the ODU TCM sub-layer, each containing TTI, BIP-8, BEI/BIAE, BDI, and STAT subfields associated to each TCM level (i=1 to 6). The STAT subfield is used in the PM and TCMi fields to provide an indication of the presence or absence of maintenance signals.
- Page 144 TX300S_e-manual_D07-00-064P_RevA00 Go back to top Go back to TOC Experimental (EXP) Field not subject to standards and is available for network operator applications EXP Type...
- Page 145 TX300S_e-manual_D07-00-064P_RevA00 Go back to top Go back to TOC General Communication Channels 1 and 2 (GCC1/GCC2) Fields are very similar to the GCC0 field, except that each channel is available in the ODU GCC1 Type Go back to top Go back to TOC Automatic Protection Switching and Protection Communication Channel (APS/PCC) Supports up to eight levels of nested APS/PCC signals associated to a dedicated-connection monitoring level depending on the value of the multiframe...
-
Page 146: Optical Payload Unit (Opu) Analysis
TX300S_e-manual_D07-00-064P_RevA00 Go back to top Go back to TOC 9.2.4 Optical Payload Unit (OPU) Analysis Payload Structure Identifier (PSI) Primary overhead field associated with the OPU A 256-byte multiframe whose first byte is defined as the Payload Type (PT). The remaining 255 bytes are currently reserved. -
Page 147: Payload Label
TX300S_e-manual_D07-00-064P_RevA00 Go back to top Go back to TOC 9.3 Payload Label (Payload Structure Identifier) Tap the Payload Label icon to display the screen shown below. Tabs for Tx and Rx label settings are provided. Payload Label PSI[0] contains a one-byte Payload type. PSI[1] to PSI[255] are mapping and concatenation specific. -
Page 148: Trace Identifier
TX300S_e-manual_D07-00-064P_RevA00 Go back to top Go back to TOC 9.4 Trace Identifier (Trail Trace Identifier) Tap the Trace Identifier icon to display the screen shown below. There are tabs for Tx and RX settings of the TTI. Trace Identifier (Trail Trace Identifier) Trail Trace Identifier TTI similar to the J0 byte in SONET/SDH, is used to identify the signal from the source to the destination within the network. -
Page 149: Tcm Tasks
TX300S_e-manual_D07-00-064P_RevA00 Go back to top Go back to TOC 9.5 TCM Tasks (Tandem Connection Monitoring) Tap the TCM Tasks icon to display the screen shown below. TCM Tasks Results are available for up to six tandem connections. The counts are numbers of seconds containing the error or indication. Tandem connections and corresponding source and sink functions are defined in ITU-T G.707, G.709, and G.783. -
Page 150: Sdh/Sonet Tools
TX300S_e-manual_D07-00-064P_RevA00 10.0 SDH/SONET Tools 10.1 SDH/SONET Tools Accessing SDH/SONET Tools On the TX300, tap on Home (main menu) > Advanced Mode > SONET/SDH Tools On the TX300e, tap on Home (main menu) >SONET/SDH Tools 10.1.1 Shortcuts SDH/SONET Tools Menu Overhead Analyzer: Displays the Section Overhead (SOH) and Path Overhead (POH) bytes of the received channel. Overhead Generator: SDH mode. - Page 151 TX300S_e-manual_D07-00-064P_RevA00 SOH RX, which displays the bytes associated with the Section/LINE Overhead POH RX, which displays the bytes associated with the Path Overhead Summary, which displays the Path Traces (J0, J1, J2), APS (K1, K2), Synchronization status (S1), STS Path (C2), and VT Path (v5) Signal Label bytes Tapping the applicable byte enables an automatic decode –...
- Page 152 TX300S_e-manual_D07-00-064P_RevA00 Path Trace Byte (J0) Regenerator section trace Used to transmit a 16 or 64-byte identifier (trace) (including a CRC-7 byte) repeatedly so that all regenerators can verify their connection Used for continuity testing between regenerators B1 Byte (RS-BIP) An 8-bit even parity code used to check for transmission errors over the regenerator section Its value is calculated over all the bits of the STM-1 frame before scrambling The checksum value is placed in the RS overhead of the following STM-1 before scrambling Path Trace Byte (J0)
- Page 153 TX300S_e-manual_D07-00-064P_RevA00 Byte is allocated for user purpose to carry proprietary messages The channel is terminated at each regenerator location Data Communications Channel Bytes (D1/D2/D3) Data Communications Channel (DCC) D1, D2 and D3 together form a 192kbps message channel for OAM purposes It can generate internal or external messages It can also be used as a BER function Pointers...
- Page 154 TX300S_e-manual_D07-00-064P_RevA00 0001 Do not revert 0000 No request Other codes are unused Bits 5-8 selects channel used by APS messages 0000 Null channel 0001 to 1110 Channels 1 thru 14 1111 Extra traffic channel K1 Byte (APS-Linear) Go back to top Go back to TOC K1 Byte (APS-Ring) Used to activate and deactivate the switching between the main and protection paths on a multiplexer section APS message type conforms to ITU-T G.841/ Bellcore GR.253 Ring Network architectures...
- Page 155 TX300S_e-manual_D07-00-064P_RevA00 Used to communicate Alarm Indication Signal (AIS) and Remote Defect Indication (RDI) conditions Bits 1-4 selects bridged channel used Bit 5 determines APS architecture Bits 6-8 110 MS-RDI 111 MS-AIS Others Not used K2 Byte (APS-Ring) Conforms to and follows ITU-T G.841 Bellcore GR.253 recommendations Used to activate and deactivate the switching between the main and protection paths on a multiplexer section Used to communicate Alarm Indication Signal (AIS) and Remote Defect Indication (RDI) conditions Bits 1-4 are the source node ID...
- Page 156 TX300S_e-manual_D07-00-064P_RevA00 0001 Stratum 1 0100 Transit Node Clock 0111 Stratum 2 1010 Stratum 3 1100 SDH Minimum Clock 1101 Stratum 3e 1110 Previsional by the Network Operator 1111 Not used for synchronization Other bytes are reserved S1 Byte (Synchronization Status) Order Wire Byte (E2) A 64kbps voice communication channel between multiplexers.
- Page 157 TX300S_e-manual_D07-00-064P_RevA00 B3 byte Even code parity which determines if a transmission error has occurred over a path Its value is calculated over all the bits of the previous VC-4 The computed checksum is placed in the B3 byte before scrambling C2 byte (HP signal label) for SDH mode Indicates mapping of the VC-n.
- Page 158 TX300S_e-manual_D07-00-064P_RevA00 Go back to top Go back to TOC G1 byte (Path status) High Order path status byte Used to convey the path terminating status back to the originating path, thus allowing bidirectional monitoring of the complete path Bits 1-4: Remote Error Indication (HP-REI) indicates number of bit errors detected by B3 Bit 5: Remote Defect indication (HP-RDI) set to 1 if signal failure is detected Bits 6-7: Enhanced RDI information to differentiate between payload defects (HP-PLM), connectivity defects (HP- TIM, HP-UNQ) and server defects (HP-AIS, LOP)
- Page 159 TX300S_e-manual_D07-00-064P_RevA00 Go back to top Go back to TOC F2 byte (HP user channel) High Order Path user channel VC-4 path user channel used for communication between path elements H4 byte (TU Indicator) Position or Sequence Indicator Multiframe phase indicator used for tributary structured payloads F3 byte (LP) user channel Used for communication between path elements and is payload dependent.
- Page 160 TX300S_e-manual_D07-00-064P_RevA00 Go back to top Go back to TOC J2 byte (LP) Used to transmit a configurable 16-byte identifier that enables the receiving path to continuously verify its connection with the transmitter Uses the same byte structure as the J0 and J1 bytes N2 byte (LP) Provides LP/VT tandem connection monitoring function (LP-TCM) for the VC-11 and VC-12 levels Bits 1-2: even parity error checking BIP-2 for the tandem connection...
- Page 161 TX300S_e-manual_D07-00-064P_RevA00 Go back to top Go back to TOC Summary The Summary tab displays the summary screen listing the major bytes of the received SDH signal. Displays the Path Trace Identifiers (J0, J1, J2), APS (K1, K2), Synchronization status (S1), and HP (C2) and LP (V5) Signal Label bytes.
- Page 162 TX300S_e-manual_D07-00-064P_RevA00 Go back to top Go back to TOC 10.1.3 Overhead Generator Tap the Overhead Generator icon to display the OH screens shown below. There are three tabs: SOH TX, which allows editing of select bytes associated with the Section Overhead. Editing of J0, K1, K2, S1 is permitted as follows: Hexadecimal value using pop-up keypad.
-
Page 163: Overhead Generator
TX300S_e-manual_D07-00-064P_RevA00 Editing of J1, C2, H4, G1, Z5, and J2, V5, Z6 is permitted as follows: Hexadecimal value using pop-up keypad. Binary values using simple on-screen bit toggle or pop-up keypad. Convenient drop-down selections. In some instances, the drop-down options will be available over multiple pages. -
Page 164: Pointer Analysis
TX300S_e-manual_D07-00-064P_RevA00 10.1.4.1 Pointer Analysis Pointers keep SDH signals synchronous by compensating for timing differences without having to use stuffing bits. Pointers are allowed to move up or down every three frames however the actual rate should be slower. The Administrative Unit (AU) and the Tributary Unit (TU) each has its own pointer and the unit has two tabs for displaying the values and measurements. -
Page 165: Pointer Generation
TX300S_e-manual_D07-00-064P_RevA00 NDF or New Data Flags Difference and Sum Analysis > TU tab Go back to top Go back to TOC 10.1.4.2 Pointer Generation The Pointer generator is able to generate individual pointer movements as follows: For AU pointers: SS bits: Program bits 5 and 6 of the H1 byte to be either SDH [10], SONET [00], Unknown [01] or [11]. Pointer value: Transmits a new pointer address or value with or without a new data flag (NDF). -
Page 166: Pointer Sequences
TX300S_e-manual_D07-00-064P_RevA00 Increment (INC) or Decrement (DEC) pointer value by 1 byte is single steps Generator > TU tab Go back to top Go back to TOC 10.1.4.3 Pointer Sequences The Pointer generator is also able to generate Standard ITU-T G.783 and ANSI T1.105.03 and Bellcore GR-253 sequences as follows: Sequence: Decide how to affect the pointer sequence Basic: Specify whether the pointer is increasing or decreasing... - Page 167 TX300S_e-manual_D07-00-064P_RevA00 G.873 > TU tab Pointer Sequence Testing It is recommended to run one sequence with positive adjustments followed by a sequence with negative adjustments. Performing the measurement at the maximum positive and negative...
-
Page 168: Trace Identifier
TX300S_e-manual_D07-00-064P_RevA00 frequency offset applicable to the line rate increases the stress on the pointer processor. The test procedure includes an initialization period followed by a cool down period of 30 seconds with no pointer movements. Go back to top Go back to TOC 10.1.5 Trace Identifier Tap the Trace Identifier icon to display the path trace testing application and screens. -
Page 169: Received Traces (Rx)
TX300S_e-manual_D07-00-064P_RevA00 Go back to top Go back to TOC 10.1.5.2 Received Traces (RX) J0 [RS]: Regenerator section trace Program a 1 or 16-byte identifier to set and check the expected trace Enable or disable the TIM (Trace Identifier Mismatch) alarm J1 [HP Path]: High order path section trace. - Page 170 TX300S_e-manual_D07-00-064P_RevA00 SDH/SONET Tools Menu Tap the Payload Label icon to display the payload label screens. There are dedicated tabs for Transmitted and Received payload labels and setups: C2 [HP Path]: Path signal label Specifies the mapping type in the VC-n Program the TX or RX label by editing the hexadecimal value or by using the convenient drop-down menu selection For the RX label, enable or disable the Payload Mismatch (PLM) Alarm...
-
Page 171: Aps Tasks
TX300S_e-manual_D07-00-064P_RevA00 Go back to top Go back to TOC 10.1.7 APS Tasks 10.1.7.1 APS Timing This function measures the Automatic Protection Switching (APS) limits of the network. APS applies only to the Multiplex sections of a SDH network and enables network elements to re-route traffic to a backup circuit in the event of network failure or problems. The protection mechanism is coordinated by the K1 and K2 bytes in the Multiplexer Section Overhead. - Page 172 TX300S_e-manual_D07-00-064P_RevA00 APS Test Procedure: The TX300/e should be connected to a tributary port of network element or transmission system to ensure that the switching time is measured for the service transported by the SDH network Ensure that no errors or alarms are present on the transmission system because this will impact the measurement The measurement will be triggered depending on the condition configured The TX300/e measures how long the AIS event remains present after the event is first recognized and will continue to measure the total disruption time in the event of multiple disruptions...
-
Page 173: Aps Sequence
TX300S_e-manual_D07-00-064P_RevA00 Go back to top Go back to TOC 10.1.7.2 APS Sequence The associated K1/K2 sequence and received K1/K2 bytes may be captured. Event Details Go back to top Go back to TOC 10.1.8 Tandem Connection Monitoring (TCM) HP Setup... - Page 174 TX300S_e-manual_D07-00-064P_RevA00 TCM Standards The Tandem paths are defined in ITU recommendation G.707 Annex D and Annex E G.707 Annex D for VC4 and VC3 G.707 Annex E for VC2 and VC1 G.707 defines a tandem connection source and sink and describes the responses of each when defect (alarm) and error conditions are detected Tandem connection maintenance signals are carried in: N1 byte for VC4 and VC3...
-
Page 175: Tributary Scan
TX300S_e-manual_D07-00-064P_RevA00 The unit automatically performs a sequential BER test on each SDH tributary (C12 channel) - mapping can be either via AU-4 or AU-3. The unit checks for alarms in the received signal, the SDH structure, and for synchronization of the selected test pattern in all channels. -
Page 176: Jitter And Wander
TX300S_e-manual_D07-00-064P_RevA00 Go back to top Go back to TOC 10.1.11 Jitter and Wander For more information on Jitter and Wander, please see 13.0 Jitter and Wander Application. Go back to top Go back to TOC 10.1.12 V-SCAN The V-SCAN function allows users to monitor the health or status of individual channels/tributaries in a real-life mixed-payload OTU2, SDH or SONET signals. - Page 177 TX300S_e-manual_D07-00-064P_RevA00 Wait until the configuration message disappears, then press the RESCAN button at the bottom of the screen to start the Tributary Scan monitoring function. In the V-SCAN tab the test set will display the overall structure of the mixed payload tributaries in the form of a matrix, down to the lowest SDH or SONET container (PDH or DSn structures within the containers will not be scanned).
- Page 178 TX300S_e-manual_D07-00-064P_RevA00 Some high level alarms (e.g., LOS, AIS) may make the whole matrix turn red as they affect the whole signal. Nonetheless, only the appropriate soft LEDs will be updated to indicate the cause. Changing the signal under test requires RESCAN. Note: On an STM-64 signal, VC-4-8c tributaries must be aligned as the first channel of any 16c block to be decoded correctly.
- Page 179 TX300S_e-manual_D07-00-064P_RevA00 Lower Order Matrix Breaks down structured tributaries into their own channels, to bring more visibility and allow users to pinpoint the exact source of a problem, or monitor a specific sub-channel. Its behavior is similar to the High order matrix. Soft LED Section This section provides a real-time visual summary of the selected tributary by means of soft LEDs and signal labels.
- Page 180 TX300S_e-manual_D07-00-064P_RevA00 The OTN Payload Structure Identifier (PSI) field displays a short decode of the Payload Mapping Type. The Multiplex Section Synchronization Status Message (S1) field displays a short decode of the S1 Byte status for the line under test. 0x00 Quality Unknown 0x02 ITU-T G.811 Recommendation...
- Page 181 TX300S_e-manual_D07-00-064P_RevA00 Unequipped or Supervisory Unequipped Reserved / Equipped non-specific Asynchronous Mapping Bit Synchronous Mapping Byte Synchronous Mapping Extended Label / Reserved for Future Test Signal, O.181 Specific Mapping VC-AIS Scanned Map Details Section Selecting this tab will list each of the high order tributaries, indicating the channel position, container type, trace identifier (J1), and signal label (C2).
- Page 182 TX300S_e-manual_D07-00-064P_RevA00 Go back to top Go back to TOC...
-
Page 183: Sonet Tools
TX300S_e-manual_D07-00-064P_RevA00 10.2 SONET Tools Accessing SDH/SONET Tools On the TX300, tap on Home (main menu) > Advanced Mode > SONET/SDH Tools On the TX300e, tap on Home (main menu) >SONET/SDH Tools 10.2.1 Shortcuts SDH/SONET Tools Menu Overhead Analyzer: Displays the Section/Line Overhead (SOH) and STS Path Overhead (POH) bytes of the received channel. - Page 184 TX300S_e-manual_D07-00-064P_RevA00 POH RX, which displays the bytes associated with the Path Overhead Summary, which displays the Path Traces (J0, J1, J2), APS (K1, K2), Synchronization status (S1), STS Path (C2), and VT Path (v5) Signal Label bytes Tapping the applicable byte enables an automatic decode – a byte description including the Hexadecimal and Binary value is provided.
- Page 185 TX300S_e-manual_D07-00-064P_RevA00 Path Trace Byte (J0) Regenerator section trace Used to transmit a 16 or 64-byte identifier (trace) (including a CRC-7 byte) repeatedly so that all regenerators can verify their connection Used for continuity testing between regenerators B1 Byte (RS-BIP) An 8-bit even parity code used to check for transmission errors over the regenerator section. Its value is calculated over all the bits of the STS-N frame before scrambling The checksum value is placed in the SECTION overhead of the following STS-N before scrambling B1 (Section-BIP) Byte...
- Page 186 TX300S_e-manual_D07-00-064P_RevA00 Byte is allocated for user purpose to carry proprietary messages The channel is terminated at each regenerator location Data Communications Channel Bytes (D1/D2/D3) Data Communications Channel (DCC) D1, D2 and D3 together form a 192kbps message channel for OAM purposes It can generate internal or external messages It can also be used as a BER function D1 Byte...
- Page 187 TX300S_e-manual_D07-00-064P_RevA00 Line Layer B2 Byte A 24-bit interleaved even parity code used to determine if transmission errors have occurred over the Section Layer Its calculated over all the bits of the STS-3 frame except those in the Section overhead The computed checksum is placed in the TOH of the following STS-N frame B2 Byte K1 Byte (APS-Linear) Used to activate and deactivate the switching between the main and protection paths on a multiplexer section...
- Page 188 TX300S_e-manual_D07-00-064P_RevA00 K1 Byte (APS-Ring) Used to activate and deactivate the switching between the main and protection paths on a multiplexer section APS message type conforms to ITU-T G.841/ Bellcore GR.253 Ring Network architectures Bits 1-4 are the condition 1111 Lockout of protection 1110 Forced switch (span) 1101 Forced switch (ring) 1100 Signal fail (span)
- Page 189 TX300S_e-manual_D07-00-064P_RevA00 Used to activate and deactivate the switching between the main and protection paths on a multiplexer section Used to communicate Alarm Indication Signal (AIS) and Remote Defect Indication (RDI) conditions Bits 1-4 are the source node ID Bit 5 is the path code 0 Short path 1 Long path Bits 6-8...
- Page 190 TX300S_e-manual_D07-00-064P_RevA00 Order Wire Byte (E2) A 64 kbps voice communication channel between multiplexers. It’s a channel used by craft persons and will be ignored as it passes through regenerators. The relief byte is used for ring protection Go back to top Go back to TOC Path Overhead Layer The following is a partial list of POH bytes and their corresponding functions: J1 byte (STS Path Trace)
- Page 191 TX300S_e-manual_D07-00-064P_RevA00 B3 byte Even code parity which determines if a transmission error has occurred over a path Its value is calculated over all the bits of the previous STS-3 The computed checksum is placed in the B3 byte before scrambling B3 Byte (STS Path BIP) C2 byte (STS path signal label) Indicate the type of payload being transported in the STS, SPE, including the status of the mapped payloads.
- Page 192 TX300S_e-manual_D07-00-064P_RevA00 Asynchronous mapping for DS3 Asynchronous mapping for 139.264Mbps Mapping for ATM Mapping for DQDB Asynchronous mapping for FDDI Mapping for HDLC over SONET STS-1 payload with 1 VT-x payload defect STS-1 payload with 2 VT-x payload defects STS-1 payload with 3 VT-x payload defects STS-1 payload with 4 VT-x payload defects STS-1 payload with 5 VT-x payload defects STS-1 payload with 6 VT-x payload defects...
- Page 193 TX300S_e-manual_D07-00-064P_RevA00 F2 byte (Path user channel) STS Path user channel STS-3# path user channel used for communication between path elements H4 byte (VT Indicator) Position or Sequence Indicator Multiframe phase indicator used for tributary structured payloads H4 Byte (VT Indicator) Z3/Z4 byte (STS Path) Allocated for future use.
- Page 194 TX300S_e-manual_D07-00-064P_RevA00 Frames 9-72 > The Access Point Identifier of the Tandem Connection (TC-API) Frames 73-76 > TC-RDI indicating defects that have occurred in the tandem connection to the far-end Frame 74 > ODI indicating to the far-end that AU/TU-AIS has been inserted into egressing STS-n VTG-n due to defects before or within the tandem connection Frames 73-76 >...
- Page 195 TX300S_e-manual_D07-00-064P_RevA00 J2 byte (VT path trace) Used to transmit a configurable 16-byte identifier that enables the receiving path to continuously verify its connection with the transmitter Uses the same byte structure as the J0 and J1 bytes Z6 byte (VT-TCM) Provides VT tandem connection monitoring function (TCM-V) for the VT-1.5, VT-2 levels.
- Page 196 TX300S_e-manual_D07-00-064P_RevA00 Z7 byte (VT path Extended Label) If bits 5-7 of V5 byte are set to 101 (value = 5), then: The signal label in Z7 byte becomes valid where: This is a 32-bit multi-frame string Bit 1 is allocated to the extended signal label Bit 2 is allocated to virtual concatenation Bits 3 and 4 are unassigned and are reserved for VT APS signaling Bits 5, 6, 7 are allocated for optional use...
- Page 197 TX300S_e-manual_D07-00-064P_RevA00 Go back to top Go back to TOC 10.2.3 Overhead Generator Tap the Overhead Generator icon to display the OH screens shown below. There are three tabs: SOH TX, which allows editing of select bytes associated with the Section Overhead. Editing of J0, K1, K2, S1 is permitted as follows: Hexadecimal value using pop-up keypad.
-
Page 198: Overhead Generator
TX300S_e-manual_D07-00-064P_RevA00 POH TX, which allows editing of select bytes associated with the Path Overhead. Editing of J1, C2, H4, G1, Z5, and J2, V5, Z6 is permitted as follows: Hexadecimal value using pop-up keypad Binary values using simple on-screen bit toggle or pop-up keypad Convenient drop-down selections. -
Page 199: Pointer Tasks
TX300S_e-manual_D07-00-064P_RevA00 Go back to top Go back to TOC 10.2.4 Pointer Tasks Tap the Pointer Tasks icon to display the Pointer testing screens. SDH/SONET Tools Menu Go back to top Go back to TOC 10.2.4.1 Pointer Analysis Pointers keep SONET signals synchronous by compensating for timing differences without having to use stuffing bits. Pointers are allowed to move up or down every three frames however the actual rate should be slower. -
Page 200: Point Generator
TX300S_e-manual_D07-00-064P_RevA00 For TV pointers: Pointer value LOP (Loss of Pointer) PJE and NJE NDF or New Data Flags Difference and Sum Analysis > VT tab Go back to top Go back to TOC 10.2.4.2 Point Generator The Pointer generator is able to generate individual pointer movements as follows: For STS pointers: SS bits: Program bits 5 and 6 of the H1 byte to be either SONET [10], SONET [00], Unknown [01] or [11]. -
Page 201: Pointer Sequences
TX300S_e-manual_D07-00-064P_RevA00 Generator > STS tab For VT pointers VT Pointer value: Set value in a range of 0 to 109 (VT-1.5) and 0 to 139 (VT-2) Increment (INC) or Decrement (DEC) pointer value by 1 byte is single steps Generator > VT tab Go back to top Go back to TOC 10.2.4.3 Pointer Sequences The Pointer generator is also able to generate Standard ITU-T G.783 and ANSI T1.105.03 and Bellcore GR-253 pointer... - Page 202 TX300S_e-manual_D07-00-064P_RevA00 Transient Burst: Generate changes in the phase of the pointer adjustment Periodic: Generate periodic changes in the pointer value. 87-3: Generate an 87-3 pattern (87 consecutive pointer adjustments, 3 consecutive pointer value, with no adjustments) 87-3 Add: Generate an 87-3 pattern (87 consecutive pointer adjustments, 3 consecutive pointer value, with added to have an additional pointer value) 87-3 Cancel: Generate an 87-3 pattern (87 consecutive pointer adjustments, 3 consecutive pointer value, with reduce the number of adjustments by one)
-
Page 203: Trace Identifier
TX300S_e-manual_D07-00-064P_RevA00 Go back to top Go back to TOC 10.2.5 Trace Identifier Tap the Trace Identifier icon to display the path trace testing screens shown below. There are dedicated tabs for Transmitted and Received (expected) path traces and setups. SDH/SONET Tools Menu Go back to top Go back to TOC 10.2.5.1 Transmitted Traces (TX) J0 [Section]: Regenerator section trace... -
Page 204: Received Traces (Rx)
TX300S_e-manual_D07-00-064P_RevA00 Go back to top Go back to TOC 10.2.5.2 Received Traces (RX) J0 [Section]: Regenerator section trace/Section Layer trace Program a 1 or 16-byte identifier to set and check the expected trace Enable or disable the TIM (Trace Identifier Mismatch) alarm J1 [STS Path]: High order path section trace/STS path section trace. - Page 205 TX300S_e-manual_D07-00-064P_RevA00 Tap the Payload Label icon to display the payload label screens. There are dedicated tabs for Transmitted and Received payload labels and setups: C2 [STS Path]: Path signal label Specifies the mapping type in the STS-1n Program the TX or RX label by editing the hexadecimal value or by using the convenient drop-down menu selection For the RX label, you can enable or disable the Payload Mismatch (PLM) Alarm TX C2 [P]...
-
Page 206: Aps Tasks
TX300S_e-manual_D07-00-064P_RevA00 Go back to top Go back to TOC 10.2.7 APS Tasks 10.2.7.1 APS Timing This function measures the Automatic Protection Switching (APS) limits of the network. APS applies only to the Multiplex sections of a SONET network and enables network elements to re-route traffic to a backup circuit in the event of network failure or problems. -
Page 207: Aps Sequence
TX300S_e-manual_D07-00-064P_RevA00 APS Test Procedure: The TX300/e should be connected to a tributary port of network element or transmission system to ensure that the switching time is measured for the service transported by the SONET network. Ensure that no errors or alarms are present on the transmission system because this will impact the measurement. The measurement will be triggered by an Alarm Indication Signal (AIS) The TX300/e measures how long the AIS event remains present after the event is first recognized and will continue to measure the total disruption time in the event of multiple disruptions. -
Page 208: Tandem Connection Monitoring (Tcm)
TX300S_e-manual_D07-00-064P_RevA00 Event Details Go back to top Go back to TOC 10.2.8 Tandem Connection Monitoring (TCM) HP Setup TCM Standards The Tandem paths are defined in ITU recommendation G.707 Annex D and Annex E. ITU-T recommendation G.707 defines a tandem connection source and sink and describes the responses of each when defect (alarm) and error conditions are detected. Tandem connection maintenance signals are carried in the Z5 byte for STS-N and in the Z6 byte for VT's. -
Page 209: Tributary Scan
TX300S_e-manual_D07-00-064P_RevA00 Go back to top Go back to TOC 10.2.9 Tributary Scan This function requires VC12 or VT-1.5 mapping and allows you to quickly check the signal structure, trace identifier and the payload. Tributary Scan An important part of any Add Drop Multiplexer (ADM) installation process is the verification of the path routing. Considering that an STS-3 contains 84 x VT-1.5’s and a STS-12 contains 336 x VT-1.5’s checking each path manually can be very time consuming. -
Page 210: Round Trip Delay
TX300S_e-manual_D07-00-064P_RevA00 Go back to top Go back to TOC 10.2.10 Round Trip Delay Round Trip Delay Results The Round Trip Delay (Propagation Delay) measurement works by sending a test pattern. A errors is transmitted in the pattern. The time it takes for the error to reach the receiver is the propagation time through the network. Select SONET as TX/RX standard. -
Page 211: Pdh Tools
TX300S_e-manual_D07-00-064P_RevA00 11.0 PDH Tools Accessing PDH Tools On the TX300, tap on Home (main menu) > Advanced Mode > PDH Tools On the TX300e, tap on Home (main menu) > PDH Tools PDH Menu Go back to top Go back to TOC 11.1 E1 Pulse Mask This function captures and analyzes E1 (2.048Mbps) pulse shape. -
Page 212: E3 Pulse Mask
TX300S_e-manual_D07-00-064P_RevA00 Go back to top Go back to TOC 11.2 E3 Pulse Mask This function captures and analyzes E3 (34.368Mbps) pulse shape. The purpose of maintaining the correct pulse shape is to reduce inter-symbol interference – if the logic 1s and 0s cannot be detected by the receiver correctly, bit and code errors will result. -
Page 213: E1 Frame Words
TX300S_e-manual_D07-00-064P_RevA00 APS Test Procedure: The TX300/e should be connected to a transmission system to ensure that the switching time is measured for the service transported by the E1 links Ensure that no errors or alarms are present on the transmission system because this will impact the measurement The measurement will be triggered by an Alarm Indication Signal (AIS) The TX300/e measures how long the AIS event remains present after the event is first recognized and will continue to measure the total disruption time in the event of multiple disruptions... -
Page 214: Round Trip Delay
TX300S_e-manual_D07-00-064P_RevA00 Go back to top Go back to TOC 11.5 Round Trip Delay Tap the Round Trip Delay in the PDH Tools screen to perform a round trip delay measurement. The Round Trip Delay (Propagation Delay) measurement works by sending a test pattern with an error. The time it takes for the error to reach the receiver is the propagation time through the network. -
Page 215: E1 Isdn Pri
TX300S_e-manual_D07-00-064P_RevA00 E1 RX Data Go back to top Go back to TOC 11.7 E1 ISDN PRI Note: E1 and DS1 ISDN PRI offer identical test options. Setup instructions for both E1 and DS1 are discussed below. 11.7.1 ISDN PRI Call 11.7.1.1 Setup (PRI Call Setup) Configuration parameters for ISDN PRI Call are as follows: Page 1... -
Page 216: Setup (Pri Call Setup)
TX300S_e-manual_D07-00-064P_RevA00 My phone#: Tap on the box and enter the phone number using the alphanumeric keyboard ISDN Setup (Page 1) Page 2 Caller ID: Blocked/Allow. Call Answer: Prompt, Accept or Cancel. Prompt: Prompts the user to answer or reject incoming calls. Selecting Prompt displays an answer and reject button on the Call tab. -
Page 217: Signal
TX300S_e-manual_D07-00-064P_RevA00 The symbols RDY and OOS are port status indicators. Below each status is the port number. Status Description OOS indicates that the port is Out of Service and will be unable to run any tests. If OOS displays on the unit, check for proper connection between the physical ports and cables and that both units' setup screens are configured correctly. - Page 218 TX300S_e-manual_D07-00-064P_RevA00 Call Type: Select Voice or 3.1K Audio Channel Line: If the Channel Config is set to 46B+2D or 47B+D in DS1 mode or Dual PRI in E1, the user can choose which line to use. Numbering Type: Unknown, International, National, or Local Numbering Plan: Unknown, Telephony, or Private Dial To: Tap on the corresponding box and use the alphanumeric keypad to enter the number of the receiving line.
-
Page 219: Call - Data Setup
TX300S_e-manual_D07-00-064P_RevA00 and check utilization rates. Following link establishment, Layer 3 decodes allow technicians to verify such factors as call state, who made or dropped the call, why the call was dropped, where the call is being carried (Interface ID/B-Channel), and call types. ISDN Trace Message Details Go back to top Go back to TOC... - Page 220 TX300S_e-manual_D07-00-064P_RevA00 Pattern Setup Results > Errors/Alarms...
-
Page 221: Data Call Bert Results (Result Tab)
TX300S_e-manual_D07-00-064P_RevA00 Press Call and the other unit should ring. Go back to top Go back to TOC 11.7.1.5 Data Call BERT Results (Result tab) After successfully placing a data call, the BER is available. The Result tab presents the measurement parameters specified in G.821. -
Page 222: Supplementary Service Scan
TX300S_e-manual_D07-00-064P_RevA00 Data Call - BERT - Analysis Go back to top Go back to TOC 11.7.1.6 Supplementary Service Scan In ETSI protocol, a Supplementary Service Scan scans a line to determine which of a variety of supplementary services are available on it. Supplementary Scan Setup... - Page 223 TX300S_e-manual_D07-00-064P_RevA00 SubAddress Type: NSAP to select the Network Service Access Point subaddress User to use a subaddress defined by a user (no standard applied) When the test is finished, the screen displays a list of these services: Supplementary Scan Results CLIP: Calling Line Identification Presentation - presents the Calling Party Number to the called user.
-
Page 224: Multi Call
TX300S_e-manual_D07-00-064P_RevA00 HOLD: Call Hold - the user may interrupt a call, then reestablish it later. Interruption frees the associated B-channel. UUS: User to User Signaling - allows a user to send an Information message in the Setup, Alerting, or Connect message on the D-channel, without connecting the call;... - Page 225 TX300S_e-manual_D07-00-064P_RevA00 Multi Call B Channel Map Multi Call List Using ReVeal MTX300...
-
Page 226: Dtmf
TX300S_e-manual_D07-00-064P_RevA00 Alternatively, the user can prepare a Multi Call list using ReVeal MTX software and upload the list to the test set. Go back to top Go back to TOC 11.7.1.8 DTMF During the call DTMF tones can be transmitted. To transmit DTMF tones, access the DTMF tab. -
Page 227: Dbackup
TX300S_e-manual_D07-00-064P_RevA00 Go back to top Go back to TOC 11.7.1.9 Dbackup To setup a backup D Channel, go to the Dbackup tab and press Swap. This operation is only applicable for 46B+2D Channel Config. Any other Channel Config will yield an error message when pressing Swap. Dbackup Go back to top Go back to TOC 11.7.2 ISDN PRI Monitor... -
Page 228: E1 Vf
TX300S_e-manual_D07-00-064P_RevA00 Please see 11.7.1.7 Multi Call for more information. Trace: Please see Trace: ISDN Protocol Decode under 11.7.1.3 Call - Voice and 3.1K Audio Setup. Result: Press the green arrow to access the action menu and press Start to initiate BERT Testing. Please refer to 11.7.1.5 Data Call BERT Results for more details. -
Page 229: Jitter & Wander
TX300S_e-manual_D07-00-064P_RevA00 ABCD bits monitor and view data in selected T/S channel Go back to top Go back to TOC 11.9 Jitter and Wander For more information on Jitter and Wander, please see 13.0 Jitter and Wander Application. Go back to top Go back to TOC... -
Page 230: Ds1/3 Tools
TX300S_e-manual_D07-00-064P_RevA00 12.0 DS1/3 Tools Accessing DS1/3 Tools On the TX300, tap on Home (main menu) > Advanced Mode > DS3/1 Tools On the TX300e, tap on Home (main menu) > DS3/1 Tools DS1/3 Tools Main Menu If this error message appears, Tap on Setup >... -
Page 231: Ds1 Pulse Mask
TX300S_e-manual_D07-00-064P_RevA00 Go back to top Go back to TOC 12.1 DS1 Pulse Mask This function captures and analyzes DS1 (1.544Mbps) pulse shape. The purpose of maintaining the correct pulse shape is to reduce inter-symbol interference – if the logic 1s and 0s cannot be detected by the receiver correctly, bit and code errors will result. - Page 232 TX300S_e-manual_D07-00-064P_RevA00 feature. Select the appropriate loopback command set by pressing on the corresponding check box. Testing interfaces allow the user to troubleshoot problems and to check the quality of links at the T1 Layer. DS1 Loop Select the loopback command set. Note: In-band, ESF DFL, and HDSL Abbreviated Loopbacks functions allow only one element in loopback mode.
- Page 233 TX300S_e-manual_D07-00-064P_RevA00 armed link. Once the Arm command is sent, the GUI will make other functions available. Arm: Sends the arming code (11000b) to the link. The status of the link can be confirmed by looking a the Arm/Lbk LEDs on any of the line cards in the link. Note that some HTU-Rs configured in NIU/Smartjack mode will loop up with the Arm command.
- Page 234 TX300S_e-manual_D07-00-064P_RevA00 Query Parameters Message Loop Command Status Message The long codes will allow multiple elements to be in loopback mode, as long as the elements are looped up from farthest to nearest. The white arrow on the DS1 Loop Setup screen is used as a visual indicator to remind the user in which direction the codes are being sent.
- Page 235 TX300S_e-manual_D07-00-064P_RevA00 HDSL2 and HDSL4 Command Reference Table Note: Confirmation based on number of errors received. User The user code allows sending programmable codes of up to 16 bits (LSB first) and can be used for those codes or elements not directly supported by the DS1 Loopback feature.
-
Page 236: Round Trip Delay
TX300S_e-manual_D07-00-064P_RevA00 Send: Press this button to send the programmed code for the amount of time set in the time out field. The test set will stop sending the code once time is up. Go back to top Go back to TOC 12.3 Round Trip Delay DS1/3 Round Trip Delay is the same measurement described as the Round Trip Delay... -
Page 237: Ds3 Feac
TX300S_e-manual_D07-00-064P_RevA00 This function captures and analyzes the DS3 (44.736Mbits/s) pulse shape. The purpose of maintaining the correct pulse shape is to reduce inter-symbol interference – if the logic 1s and 0s cannot be detected by the receiver correctly, bit and code errors will result. -
Page 238: Ds1 Isdn Pri
TX300S_e-manual_D07-00-064P_RevA00 Alarm TYPE DS3 Equip. Failure (Service Affecting) DS3 LOS DS3 OOF DS3 AIS RCV DS3 IDLE RCV DS3 EQUIQ FAIL (NON-SERVICE AFFECT) COMMON EQUIP. FAIL (NSA) MULTIPLE DS1 LOS DS1 EQUIP FAIL SINGLE DS1 LOS DS1 EQUIP FAIL (NON-SERVICE AFFECT) LOOP TYPE: Options: NIU, LINE FEAC Tasks RX Go back to top Go back to TOC... -
Page 239: Ds1 Vf Tasks
TX300S_e-manual_D07-00-064P_RevA00 E1 and DS1 ISDN PRI offer identical test options. DS1 ISDN PRI instructions are discussed in 11.7 E1 ISDN PRI. Go back to top Go back to TOC 12.8 DS1 VF Tasks The VF Tasks menu performs a variety of talk/listen functions. DS1 VF Tasks Setup Note: Do not attempt to enter VF Tasks if the Frame LED is not green. - Page 240 TX300S_e-manual_D07-00-064P_RevA00 Go back to top Go back to TOC 12.10 CSU/NIU Emulation for DS1 Accessing CSU/NIU Emulation TX300: To access CSU/NIU from the OTN/SDH/SONET menu tap on Home (main menu) > DS1 > DSU/NIU Emulation. The test set can emulate DS1 customer premises equipment, simulating a CSU or NIU. CSU/NIU emulation allows the test set to be looped up from the central office to verify DS1 service across the entire length of the span.
- Page 241 TX300S_e-manual_D07-00-064P_RevA00 Out of Frame errors CRC Errors Receiving frequency (Hz) Peak-to-peak voltage and voltage level CSU/NIU Buttons Button Command Description Loopback RX to TX, unchanged Line-Loop Loopback RX to TX, only the payload Payload-Loop Can be used to unloop at anytime Loop Down Clear all the counters to 0.
-
Page 242: Jitter Measurement & Generation (Jitter Icon)
TX300S_e-manual_D07-00-064P_RevA00 13.0 Jitter and Wander Accessing Jitter and Wander On the TX300, go to OTN/SDH/SONET Testing from the Test Mode Selection, then select the following: For PDH or DS3/1 signals: Home (Main Menu) > Advanced Mode > PDH or DS3/1 Tools > (DS1/3) Jitter & Wander For SONET or SDH signals: Home (Main Menu) >... -
Page 243: Max Jitter Tolerance
TX300S_e-manual_D07-00-064P_RevA00 The Jitter measurements menu allows the user to measure and analyze received signal jitter. The measurement example is shown above (the vertical grid spacing is 2.0 UIpp). The red bar indicates Max. peak jitter during testing and the yellow bar indicates the current peak jitter. Setup Configure the following settings before starting the test: Filter: HP1+LP or HP2+LP. - Page 244 TX300S_e-manual_D07-00-064P_RevA00 Loss of Signal (LOS) Check If the LOS condition is detected at any time during the MTJ test, the data will become invalid and the test will stop automatically. An error message will appear to notify the user to correct the condition before running the test again. LOS Error Message Table Table values include:...
-
Page 245: Jitter Transfer Function
TX300S_e-manual_D07-00-064P_RevA00 Graph A cross (x) indicates the maximum jitter value tolerated at the frequency. Yellow triangles (▲) indicate that the data point is greater than, while the green "X" symbols represent actual measured values. Greater than implies that the jitter tolerance of the DUT (device under test) is much better than the value measured by the test set. -
Page 246: Wander Measurement
TX300S_e-manual_D07-00-064P_RevA00 Frequency (Hz): Frequency measured JTF (Jitter Transfer Function) (dB): Jitter in divided by jitter out value (in dB) Mask (dB): Jitter output in relationship to the input Progress: The bar at the bottom of the graph shows the test progress A green cross (x) indicates the the jitter transfer value has passed. -
Page 247: Wander Analysis Pc Software
Go back to top Go back to TOC 13.4.3 Wander Analysis PC Software VeEX Wander Analysis PC Software is available for viewing and analyzing TIE data results. It offers the following capabilities: Fast processing of TIE data into MTIE and TDEV analysis... - Page 248 TX300S_e-manual_D07-00-064P_RevA00 To install wander analysis: Copy the VeEX_Wander_Analysis.zip package to a PC or USB drive Unzip the folder and double-click on the Wander Analysis icon to launch the program Viewing TIE Data Use the Browse button to locate the desired folder and load the MTIE file A Linear TIE graph displays the phase behavior recorded from the signal under test MTIE and TDEV Results Click on MTIE/TDEV Analysis to view the screen below...
- Page 249 TX300S_e-manual_D07-00-064P_RevA00 Pass/Fail Wander Assessment Selected masks are drawn and a PASS / FAIL assessment is displayed Users can switch between different applicable masks to compare Adding and Creating New Masks If the required masks are not listed, new ones can be quickly and easily added MTIE and TDEV masks are defined in plain text and with a simple notation Open the Wander Analysis folder and go to \User Mask Select a similar mask to modify or create a new one using simple text tools like Notepad...
- Page 250 TX300S_e-manual_D07-00-064P_RevA00 τ > 2 000 433τ + 0.01τ Syntax for Creating Masks File Content Description G.823 - SDH Equipment Clock (SEC) <-- Mask label, as it will be displayed in the menu MTIE <-- Starts the MTIE definition section 0.1 < x <= 2.5,250 Write formulas replacing τ...
-
Page 251: Otu-Xe
TX300S_e-manual_D07-00-064P_RevA00 14.0 OTU-Xe 14.1 OTU-Xe Overview Overclocked OTN Testing An Overclocked option verifies extended bit rates to ITU-T series G supplement 43 standards. Overclocked OTN compensates for the rate mismatch between 10 GbE LAN and OPU2 payload by raising the overall OTU2 data rate from the standard 10.709 Gbps to fit the 10GbE LAN client signal. -
Page 252: Home Menu And Switch Test Mode
TX300S_e-manual_D07-00-064P_RevA00 14.2 Home Menu and Switch Test Mode The Home menu can be accessed at anytime during operation by pressing the Home key on the rubber keypad. The screen is divided into three presentation areas: 1 - Left: LEDs: Displays soft LEDs associated with Errors and Alarms Tools: IP connection status, Advanced IP features (Net Wiz, WiFi Wiz, VoIP, and IPTV applications) Utilities: Applications (Help, Settings, Files) which are common to all VePAL handheld test sets 2 - Middle:... - Page 253 TX300S_e-manual_D07-00-064P_RevA00 Enabling Ethernet Options on the OTUx Home Menu The Home menu features different test applications depending on Setup configuration. To enable Ethernet options (BERT, RFC 2544, Throughput) and access them from the Home menu, select 10GE SYNC or 10GE ASYNC for the OTN Mapping. For more information on configuring the OTN mapping, please see 14.3.1.1 Hierarchy.
-
Page 254: Otn Setup
TX300S_e-manual_D07-00-064P_RevA00 14.3 OTN Setup Tap on the Setup icon to access the tabs featured in this section. 14.3.1 Signal Setup Signal Setup Tap on the Signal tab to set up the Transmitter and Receiver interfaces and associated test parameters prior to running a test. 14.3.1.1 Hierarchy To access the Hierarchy setting, tap on the Hierarchy box from the Signal tab. -
Page 255: Interface
TX300S_e-manual_D07-00-064P_RevA00 Scrambler: ON/OFF. FEC: FEC encoder can be ON/OFF (activated/deactivated). Go back to top Go back to TOC 14.3.1.2 Interface Tapping the Interface box opens the Interface Setup screen. Interface Setup Test Port: Optical interface is available for OTU-1e, OTU-2e signals. Clock Source: Can be configured as follows: Internal clock: The clock for the transmitter is derived from the internal clock. -
Page 256: General
TX300S_e-manual_D07-00-064P_RevA00 PRBS Pattern: Use the pattern drop-down box to select the test pattern which will be inserted into the transmitted signal. Pseudo Random Bit Sequences (PRBS) defined by ITU-T 0.150 and 0.151 standards, fixed words and 24-bit or 32 bit user defined patterns are available. - Page 257 TX300S_e-manual_D07-00-064P_RevA00 Audible Alarm: OFF, ON. Results on start: On or Off. Provides an automatic move to Result screen when it starts. Measurement Clock Source: Internal Clock or Tx Clock Source; the measurement is synchronized to the Transmitted (Tx) Clock. Go back to top Go back to TOC 14.4 OTN Results Accessing OTN Results Measurements are accessed by tapping the Results icon in the main menu.
- Page 258 TX300S_e-manual_D07-00-064P_RevA00 Go back to top Go back to TOC 14.4.1 Summary The Summary tab displays a summary page of test results and parameters. At a glance, the user is able to see if there are any alarms, errors or signal failure pertaining to the OTN signal and its payload. Summary tab Go back to top Go back to TOC 14.4.2 Errors/Alarms...
-
Page 259: Errors/Alarms
TX300S_e-manual_D07-00-064P_RevA00 Green: No error or alarm is present. Red: An error or alarm condition is detected and is currently present. Yellow: Indicates a history condition. An error or alarm was detected during the measurement interval but it is no longer present or active. - Page 260 TX300S_e-manual_D07-00-064P_RevA00...
- Page 261 TX300S_e-manual_D07-00-064P_RevA00 Go back to top Go back to TOC Errors/Alarms (Page 2)
- Page 262 TX300S_e-manual_D07-00-064P_RevA00 Page 2 lists the OTU Errors in logical order that are associated with the signal under test. All errors are evaluated and stored. The Elapsed Time [ET] is shown in the right hand corner of the header. Error conditions are displayed in red including count and rate.
- Page 263 TX300S_e-manual_D07-00-064P_RevA00 Errors/Alarms (Page 5) Errors/Alarms (Page 7) Page 7 lists the BERT Errors/Alarms in logical order that are associated with the signal under test. All alarms are evaluated and stored. Errors/Alarms (Page 7) Go back to top Go back to TOC 14.4.3 Event Log The Event log tab brings up the screen listing the error and alarm events recorded during a test.
-
Page 264: Event Log
TX300S_e-manual_D07-00-064P_RevA00 Event Log Go back to top Go back to TOC 14.4.4 Signal Level (Page 1) The Signal tab displays the Level and Frequency screen. Page 1 displays the level measurement Loss of Signal (LOS); the Saturation level for optical signals is shown graphically, including the level measurement in dBm. Signal (Page 1) Go back to top Go back to TOC Frequency (Page 2) - Page 265 TX300S_e-manual_D07-00-064P_RevA00 Frequency: The received signal frequency and offset is measured and displayed. OTN Current (bps): Indicates the frequency of the input signal Offset (ppm): Indicates the difference between the standard rate and the rate of the input signal Min (ppm): Indicates the difference between the standard rate and the minimum deviation detected in the input signal Max (ppm): Indicates the difference between the standard rate and the maximum deviation detected in the input signal Go back to top Go back to TOC Optical Information (Page 3)
-
Page 266: Otu-Xe Ethernet Applications
TX300S_e-manual_D07-00-064P_RevA00 14.5 OTU-Xe Ethernet Applications Accessing Ethernet Applications from OTU-Xe To enable and access Ethernet applications from the Home menu (RFC 2544, BERT, Throughput), tap on Setup [Home menu] > Hierarchy > OTN Mapping and select 10GE SYNC or 10GE ASYNC from the drop-down menu. Hierarchy Setup After configuring the OTU-Xe signal, press the Home Key on the keypad and tap on the desired Ethernet test. -
Page 267: Otu-Xe With 10Ge Bert
TX300S_e-manual_D07-00-064P_RevA00 Setup and results for Ethernet applications featured in OTU-x (-1e, -2e) are the same as those featured in Ethernet Testing mode. Please refer to the corresponding Ethernet testing section for more information on the following applications: 14.5.1 OTU-Xe with 10GE BERT redirects to 15.2 BERT 14.5.2 OTN/10GE RFC 2544 Conformance Testing redirects to 15.3 RFC 2544 Conformance Testing... -
Page 268: Ethernet
TX300S_e-manual_D07-00-064P_RevA00 15.0 Ethernet Test mode, test port(s), and network settings are required prior to performing any measurements or applications. Setup Test Port Selection Port Setup 1GE Fiber Port 1GE Copper Port 10GE Port Measurement Settings Clock Synchronization Process MX Discover and Control OAM Discover ViPAG Router Test ViPAG Setup... - Page 269 TX300S_e-manual_D07-00-064P_RevA00 Port setup or test interface configuration are accessed via the Setup menu located on the Home page. The available configuration settings depend on the interface selected in the Test Mode selection. The user selects the operation mode and the interfaces that will be used to carry out tests. Once the operating mode and interfaces are selected, the user can independently configure the auto-negotiation, speed, duplex, and flow control settings for each port (where applicable).
- Page 270 TX300S_e-manual_D07-00-064P_RevA00 1 GE Copper Port Auto Negotiation: On or Off. Matches the test set's negotiation settings to those of the link partner. Speed (only when Auto Negotiation is Off): 10 Mbps, 100 Mbps, 1000 Mbps. Duplex (only when Auto Negotiation is Off): Half or Full. Advertisement (only when Auto Negotiation is On): Default-All or Custom.
- Page 271 TX300S_e-manual_D07-00-064P_RevA00 The Status tab lists current port settings. Please note that the Status tab is only available if a fiber port option is selected from the Test Port Selection menu. Note: TX300/e units shipped before January 2012 support up to +/- 50 ppm offset only. Units shipped from 2012 onwards, support up to +/- 150 ppm offset.
- Page 272 Clock Synchronization Device: Disable, GPS, CDMA. Select the device to be used to synchronize the clock to perform the One Way Delay measurement. The choices are GPS and CDMA. The following devices are recommended by VeEX for best performance:...
- Page 273 TX300S_e-manual_D07-00-064P_RevA00 2. The pop-up box asks to ensure that all the connections to the GPS/CDMA hardware are correctly made. Click OK. GPS Device Connection The GPS/CDMA Device will be connected and External Clock Input, UTC ToD and Clock Sync Time fields will show on the screen. The GPS?CDMA Connection icon on the top of the screen will turn Green if the ToD synchronization is acquired.
- Page 274 TX300S_e-manual_D07-00-064P_RevA00 3. Tap the Clock Sync Time field to enter a time to synchronize with the UTC ToD. Note: The same time settings need to be set in the other unit with which the One Way Delay test is to be conducted. Both units need to be synchronized together at the same time.
- Page 275 Note: If using OAM Discover, it is unnecessary to assign an IP address to the local or remote unit. MX Discover MX Discover enables the TX300/e test set to discover other VeEX VePal test sets and devices with an assigned IP address on the same subnet. To discover other devices using MX Discover: Tap on the MX Discover button and then press Discover.
- Page 276 TX300S_e-manual_D07-00-064P_RevA00 Control The Control button becomes available on the right side menu when any Ethernet application (V-SAM, RFC 2544, Throughput, BERT) is selected. Press the Control button to configure loop up and loop down commands necessary to control a far-end unit. The loop up command contains information about the test layer.
- Page 277 TX300S_e-manual_D07-00-064P_RevA00 Like MX Discover, OAM Discover can also be used to discover far-end test units without manually configuring the local or remote unit's destination address. If OAM is enabled on the TX300/e, any link partner that supports the IEEE 802.3ah protocol will be discovered automatically and displayed under the OAM Discover tab.
- Page 278 TX300S_e-manual_D07-00-064P_RevA00 Quick Test Setup Fill out each screen and press NEXT to proceed to the next page or Previous to go back to the previous screen. Step 1: Select the router test interface. "Local unit" denotes a router wrap test while "end-to-end" conducts an end-to-end test. The frame size for each option listed below is 256 bytes.
- Page 279 TX300S_e-manual_D07-00-064P_RevA00 Step 6: Reviewing Configuration Settings After starting the test, the Error Injection button becomes available and the screen displays Quick Test view and the following results for both ports: Link Up/Down status Optical Power in dBm ARP - Pass/Fail status PING - Pass/Fail status Round Trip Delay (RTD) measurement in ms Throughput - Pass/Fail status...
- Page 280 TX300S_e-manual_D07-00-064P_RevA00 Setup VePAL test sets come preconfigured. To customize settings for both ports, go to the Setup tab. For configuration instructions, please refer to 15.2 BERT. Setup Go back to top Go back to TOC Results Summary Results...
- Page 281 TX300S_e-manual_D07-00-064P_RevA00 The Summary tab lists the Pass/Fail status of each ARP, Ping, and Throughput test along with test measurements. The Results tabs for each port lists statistical results similar to those featured in the BERT Results section. Please see 15.2.2 BERT Results for more information.
-
Page 282: Bert
TX300S_e-manual_D07-00-064P_RevA00 15.2 BERT Setup Overview Header Settings VLAN Data MPLS Data RX Filter Traffic Settings Error Injection Starting / Stopping a BERT Results Summary Errors Events Traffic Rates Delay Alarms Signal 15.2.1 BERT Setup Overview: BER testing at Layer 1, 2, 3, and 4 is supported. The BERT can be configured to use either regular PRBS test patterns, stress patterns (specifically for 10Gigabit Ethernet) or user defined test patterns to simulate various conditions. - Page 283 TX300S_e-manual_D07-00-064P_RevA00 BERT Setup - Header (Layer 2) Layer 3: Framed BERT (same as Layer 1 & 2 Framed) MAC Address: A default or user configured Media Access Control (MAC) address is added to the frame IP Address: A default or user configured IP address is added to the frame BERT Setup - Header (Layer 3) Layer 4: Framed BERT (same as Layer 1, 2, &...
- Page 284 TX300S_e-manual_D07-00-064P_RevA00 Go back to top Go back to TOC 15.2.1.1 Header Settings BERT Profile: Load a previously configured test profile or create a new profile from existing settings. Please see 6.0 Profiles in the ReVeal MTX300 manual for more details on how to create new profiles using ReVeal software.
- Page 285 TX300S_e-manual_D07-00-064P_RevA00 Options are Layer 1 Unframed, Layer 1 Framed, Layer 2, Layer 3, and Layer 4 Frame Type: Select the Ethernet frame type for Layer 2 or Layer 3 802.3 Raw (IEEE 802.3 frame without LLC) - Not available when Layer 3 is selected 802.3 LLC (IEEE 802.3 frame with LLC header) 802.3 SNAP (IEEE 802.3 frame with SNAP header) Ethernet II (DIX) (named after DEC, Intel, and Xerox, this is the most common frame type today)
- Page 286 TX300S_e-manual_D07-00-064P_RevA00 Go back to top Go back to TOC VLAN Tab: In the VLAN tab the following parameters are configured: VLAN ID: Configurable in the range 1 to 4094. VLAN ID is the identification of the VLAN, which is basically used by the standard 802.1Q. It has 12 bits which allows the identification of 4096 (2^12) VLANs.
- Page 287 TX300S_e-manual_D07-00-064P_RevA00 Go back to top Go back to TOC MPLS Tab: In the MPLS tab the following parameters are configured: MPLS label: Configurable in the range 16 through 1,048,575 (labels 0 to 15 are reserved). Note: Composed of 20 bits which allows for the creation of over one million labels. CoS: Configurable in the range 0 to 6.
- Page 288 TX300S_e-manual_D07-00-064P_RevA00 IP TOS (for Quality of Service testing): Legacy TOS (Precedence): The first three bits of the IP TOS field can be edited: 000 - Best Effort 001 - Bulk Data 010 - Transactional 011 - Call Signaling 100 - Streaming Video 101 - Voice 110 - Routing 111 - Reserve...
- Page 289 TX300S_e-manual_D07-00-064P_RevA00 BERT Setup - Data selection - (Layer 1 Unframed) Layer 1 Unframed Test Patterns HFPAT (High Frequency Pattern): This test pattern is to test random jitter (RJ) at a BER of 10-12, and also to test the asymmetry of transition times. This high frequency test pattern generates a one, or light on, for a duration of 1 bit time, followed by a zero, or light off, for a duration of 1 bit time.
- Page 290 TX300S_e-manual_D07-00-064P_RevA00 receiver's CDR to large instantaneous phase jumps. The pattern alternates repeating low transition density patterns with repeating high transition density patterns. SNPAT (Supply Noise Pattern): Designed to simulate the worst case power supply noise that could be introduced by a transceiver. Go back to top Go back to TOC Layer 2, 3, &...
- Page 291 TX300S_e-manual_D07-00-064P_RevA00 Go back to top Go back to TOC RX Filter Tab: Allows the user to filter incoming streams. When checked, the incoming traffic flows not matching these criteria will not be considered for these results. MAC Destination address MAC Source address VLAN VLAN Priority VLAN Eligible...
-
Page 292: Traffic Settings
TX300S_e-manual_D07-00-064P_RevA00 Go back to top Go back to TOC 15.2.1.2 Traffic Settings Traffic tab: The user configures the traffic profile for the stream, including traffic flow, frame size, frame type, and transmit rate. Traffic Flow: Select from the following traffic flows: Constant: The selected frame is transmitted continuously according to the selected bandwidth %. - Page 293 TX300S_e-manual_D07-00-064P_RevA00 Note: Frame Size Limitations Layer 1 framed mode - Frame size configuration is not available. Layer 1 unframed mode - Traffic profile is constant at 100% bandwidth. Go back to top Go back to TOC 15.2.1.3 Error Injection Error injection can be performed during testing. The error type and injection rate are configured in the Error Injection tab. Error type: Select from Bit, CRC, IP Checksum (Layer 3, 4 only), Pause, TCP/UDP Checksum (Layer 4 only).
-
Page 294: Error Injection
TX300S_e-manual_D07-00-064P_RevA00 Error Injection After pressing Start, error injection can be enabled by pressing the Error Inj. button on the right side of the screen. Go back to top Go back to TOC 15.2.1.4 Starting/Stopping a BERT Once all configurations have been made, the user can start the BERT test (press the Start icon on the top right section of the screen). -
Page 295: Results
TX300S_e-manual_D07-00-064P_RevA00 Once the far-end unit has been looped back, start the test by pressing the Start button. When the all of the selected test are completed, the BERT test suite will stop automatically. Once all tests have been completed and there is no need to test again, go back to the Control tab, and press the Loop Down button. -
Page 296: Events
TX300S_e-manual_D07-00-064P_RevA00 Go back to top Go back to TOC 15.2.2.3 Events Events tab: A time stamped record or log of anomalies, alarms, test status (start/stop) and test application are displayed. BERT Results - Events Go back to top Go back to TOC 15.2.2.4 Traffic Traffic tab: The following Traffic statistics are displayed: Frame type: Test and non-test frames... - Page 297 TX300S_e-manual_D07-00-064P_RevA00 BERT Results - Traffic Distribution Go back to top Go back to TOC Frames tab: The following Frame distribution statistics are displayed in Count (#) and Percentage (%): Received (RX) frames: Total frames Test frames VLAN tagged frames Q-in-Q VLAN stacked frames Non-test frames Transmitted (TX) frames: Total frame - Total # frames transmitted...
-
Page 298: Traffic
TX300S_e-manual_D07-00-064P_RevA00 Traffic Type tab: The following Traffic distribution statistics are displayed in Count (#) and Percentage (%): Layer 2 Unicast frames: Number of Unicast frames received without FCS errors. Layer 2 Broadcast frames: Number of Broadcast frames received without FCS errors. Broadcast frames have a MAC address equal to FF-FF-FF-FF-FF-FF. -
Page 299: Rates
TX300S_e-manual_D07-00-064P_RevA00 Go back to top Go back to TOC 15.2.2.5 Rates Rates tab: Rate statistics are displayed in a graph format. Tap on either gauge to see rate details in table form. The table shows transmitted (Tx) and received (Rx) current, minimum, maximum and average frame rates (FPS) and Data Rates (Mbps). Frame rate in Frames per second (FPS): Number of received frames (including bad frames, Broadcast frames and Multicast frames) Data rate in Mbps: Received data rate expressed in Mbps... -
Page 300: Alarms
TX300S_e-manual_D07-00-064P_RevA00 Current Minimum Maximum Variation (Current) - Interframe delay variation BERT Results - Delay Go back to top Go back to TOC 15.2.2.7 Alarms Alarms tab: The following Alarms (Current and Total) are displayed: LOS: Loss of Signal LOS Sync: Loss synchronization Pattern Loss: Indicates errors related to test pattern Service disruption associated with loss of signal: Current: Duration of the current service disruption... - Page 301 TX300S_e-manual_D07-00-064P_RevA00 Go back to top Go back to TOC 15.2.2.8 Signal The Signal tab (fiber ports only) displays the optical level measured by the SFP or XFP transceiver. BERT Results - Signal Go back to top Go back to TOC...
-
Page 302: Signal
TX300S_e-manual_D07-00-064P_RevA00 15.3 RFC 2544 Conformance Testing Overview Setup - Standard Mode Header Settings Frames Settings Threshold Settings Peer-to-Peer Asymmetric Testing Asymmetric Testing Setup Throughput Settings Latency Settings Frame Loss Settings Burst Settings Starting / Stopping a RFC2544 Measurement Results - Standard Mode Status Summary Signal... - Page 303 TX300S_e-manual_D07-00-064P_RevA00 Go back to top Go back to TOC 15.3.1 Setup - Standard Mode Unless otherwise noted, the Frame Header and related setups are identical to the setups described in the BERT Application above. A summary of the RFC 2544 setup options are outlined below. 15.3.1.1 Header Settings RFC 2544 Profile: Load a previously configured test profile or create a new profile from existing settings.
- Page 304 TX300S_e-manual_D07-00-064P_RevA00 Test: Select the test layer to perform the test. Options are Layer 2, Layer 3, and Layer 4. Frame Type: Select the Ethernet frame type for Layer 2, Layer 3 or Layer 4. 802.3 Raw (IEEE 802.3 frame without LLC) - Not available when Layer 3 is selected 802.3 LLC (IEEE 802.3 frame with LLC header) 802.3 SNAP (IEEE 802.3 frame with SNAP header) Ethernet II (DIX) (named after DEC, Intel, and Xerox, this is the most common frame type today)
- Page 305 RFC 2544 Setup - MAC address editing Data Tab: No payload selection is possible. The payload area is populated with a VeEX signature field and other proprietary data. RX Filter Tab: Depending on test layer, allows the user to filter streams by:...
-
Page 306: Frame Settings
TX300S_e-manual_D07-00-064P_RevA00 The user can also configure the following IP header fields; IP TOS (for quality of service testing), TTL, fragment offset byte, and the protocol field. Please refer to the BERT application for more details. Go back to top Go back to TOC 15.3.1.2 Frames Settings Frames tab: User configures the following: Preset Frames: User selects from a list of recommended test frame sizes defined in RFC 2544:... -
Page 307: Peer-To-Peer And Asymmetric Testing
TX300S_e-manual_D07-00-064P_RevA00 Go back to top Go back to TOC 15.3.1.4 Peer-to-Peer and Asymmetric Testing Remote Partner Control When the local unit connects to the remote (peer) partner, it loads the same configuration profile (header, traffic, and frame size) to the remote partner, with the MAC and IP addresses inverted. From the peer-to-peer menu, asymmetric testing becomes available. -
Page 308: Throughput, Latency, Frame Loss, And Burst Settings
TX300S_e-manual_D07-00-064P_RevA00 Asymmetric Testing Setup Partner Address: Select MX Discovered or User Defined. For instructions and further information on the MX Discovered and User Defined options, please see 15.1.4 MX Discover and Control. Mode: Select an asymmetric test configuration: Asymmetric Up: Tests traffic in the upstream direction (local to remote direction). Asymmetric Down: Tests traffic the downstream direction (remote to local direction). - Page 309 TX300S_e-manual_D07-00-064P_RevA00 user simply has to enable/disable which tests to perform by checking/unchecking a selection box in the respective tab for each test. By default all four tests are enabled. The following parameters must be configured before running the RFC 2544 conformance test suite. Throughput tab: Max Rate: Up to 100% of the negotiated line rate.
- Page 310 TX300S_e-manual_D07-00-064P_RevA00 Go back to top Go back to TOC Frame Loss tab: Max Rate: Up to 100% of the negotiated line rate. The default value is 100%. This is the maximum transmit rate to perform the frame loss test for each test frame size. The user may configure this rate as a % of the total line rate or in Mbps.
-
Page 311: Starting/Stopping A Rfc 2544 Measurement
TX300S_e-manual_D07-00-064P_RevA00 In the burst test, frames are always transmitted at the maximum rate for a given minimum and maximum burst duration. Minimum Duration: Selectable in the range 2 to 999 seconds. Default value is 2 seconds. This is the duration of the first burst. Maximum Duration: Selectable up to 999 seconds. -
Page 312: Results - Standard Mode
TX300S_e-manual_D07-00-064P_RevA00 Go back to top Go back to TOC 15.3.2 Results - Standard Mode The progress and current result of the RFC 2544 can be viewed as the test is in progress. Results tab: Navigate the respective sub-tabs (throughput, latency, frame loss, or burst) to view the results for each test. For the burst test, the results can be viewed in summary table format or test log format. - Page 313 TX300S_e-manual_D07-00-064P_RevA00 Go back to top Go back to TOC Signal tab: The Signal tab (fiber ports only) displays the optical level measured by the SFP or XFP transceiver. RFC 2544 Results - Signal RFC 2544 Results - Signal (page 2)
- Page 314 TX300S_e-manual_D07-00-064P_RevA00 Go back to top Go back to TOC Events tab: A time stamped log of each test is displayed. RFC 2544 Results - Events Go back to top Go back to TOC The Throughput tab displays the maximum throughput rate of the link under test. Results are displayed in graphical and table formats.
- Page 315 TX300S_e-manual_D07-00-064P_RevA00 RFC 2544 Results - Throughput (Summary Table) RFC 2544 Results - Throughput (Test Log Table)
- Page 316 TX300S_e-manual_D07-00-064P_RevA00 Go back to top Go back to TOC Latency and frame jitter measurements results are displayed in the following formats. Use the drop-down menu to select the Latency format: Graphical: Latency results displayed in line graph form (Latency [us] vs Frame size [bytes]). Summary and Test log tables display: byte size Latency (us): Round trip delay latency.
- Page 317 TX300S_e-manual_D07-00-064P_RevA00 RFC 2544 Results - Latency (Jitter Graphical) RFC 2544 Results - Latency (Jitter Summary)
- Page 318 TX300S_e-manual_D07-00-064P_RevA00 RFC 2544 Results - Latency (Jitter Test log) Go back to top Go back to TOC Frame Loss tab: Frame loss displays the percentage of frames not received. Use the drop-down menu to select the Frame Loss format: Summary and Test log tables display test frame length, byte size, frame loss (%) from received traffic, and rate (%) transmitted.
- Page 319 TX300S_e-manual_D07-00-064P_RevA00 RFC 2544 Results - Frame Loss (Test log) Go back to top Go back to TOC Burst tab: Burstability (back-back) results are the number of frames successfully transmitted/received at the line rate. It is displayed in the following formats: Summary table: Displays Average Frame Count received for each test frame length Test log table: Displays Average Frame Count and Duration (seconds) for each test frame length RFC 2544 Results - Burstability (Summary)
-
Page 320: Saving Rfc 2544 Results
TX300S_e-manual_D07-00-064P_RevA00 RFC 2544 Results - Burstability (Test Log) Go back to top Go back to TOC 15.3.3 Saving RFC 2544 Results Once the test has been stopped the results can be saved by pressing the Save key on the VePAL’s keypad. The results will be saved and named automatically. - Page 321 TX300S_e-manual_D07-00-064P_RevA00 For Header, Frames, Thresholds, Throughput, Latency, Frame Loss, and Burst, please refer to Setup - Standard Mode. Background - General # of Back. Streams: From 1 to 7 streams RFC 2544 Test Stream (%): This is the max rate set in frame loss Background Stream # (%): Allocated Bandwidth per Stream: The total bandwidth for all streams cannot exceed 100% Total (%): Sum of all stream rates in % Setup - Background - General...
-
Page 322: Background Results - Advanced Sla Mode
TX300S_e-manual_D07-00-064P_RevA00 Starting/Stopping an Advanced SLA Mode Please see Starting/Stopping a RFC 2544 Test for information on starting/stopping the test. Go back to top Go back to TOC 15.3.5 Background Results - Advanced SLA Mode For information on Global and Per Stream Results in Advanced SLA Mode, please refer to 15.5.2 Throughput Results. -
Page 323: V-Sam
Event Log Overview V-SAM (VeEX Service Activation Methodology) is an automated Ethernet service activation test feature conforming to the ITU-T Y.1564 standard, created to address and solve the deficiencies of RFC 2544: • RFC 2544 was limited to test at the maximum throughput line rate for a single service. SAM is able to run multiple... - Page 324 TX300S_e-manual_D07-00-064P_RevA00 Phase 2: Service Performance test: The services running on the same line are tested simultaneously over an extended period of time, to verify network robustness. Test Application Phase 1: Service Configuration Test The service configuration test is broken down into three steps. The steps are tested individually for all the services delivered on the same line.
- Page 325 TX300S_e-manual_D07-00-064P_RevA00 General (Page 1 and 2) V-SAM Profile: Delete, Save, Save as..., Default, or Last Configuration. # of Services: Select the number of services to run. Up to 8 services can be chosen for a 1 GE interface and up to 10 services can be chosen for a 10 GE interface.
- Page 326 TX300S_e-manual_D07-00-064P_RevA00 CIR Test Configuration CIR Test Config.: Select Simple Test, Step Load Test, or Simple and Step. Simple Test: Starts the tests at the CIR. Step Load Test: Starts the test below the CIR and continues in steps until it reaches the CIR. Simple and Step Load Test: Step Load Test performs only if the Simple Validation test fails.
- Page 327 TX300S_e-manual_D07-00-064P_RevA00 For EMIX (1GE only): The default value is abceg. Tap the zoom (magnifying glass) icon to define other values. Select the values from the drop down lists on the next screen. Note: Any EMIX configuration of 5 frames is allowed. Encapsultaion Type: None or Provider Backbone Bridge (PBB-TE): Provider Backbone Bridge MAC-in-MAC (IEEE 802.1ah) encapsulation are configured trunks that add resiliency and configurable performance levels in the provider backbone network.
-
Page 328: Service Attributes
TX300S_e-manual_D07-00-064P_RevA00 V-SAM Setup - Services - PBB Settings Go back to top Go back to TOC 15.4.1.2 Service Attributes Bandwidth Profile Parameters The Bandwidth Profile specifies how much traffic the customer is authorized to transmit and how the frames are prioritized within the network. - Page 329 TX300S_e-manual_D07-00-064P_RevA00 forwarded on a best effort basis, but may be dropped in the event of congestion within the network. The combined CIR and EIR must not exceed the line bandwidth. Traffic beyond CIR + EIR will be dropped when it enters the carrier's network.
-
Page 330: Results
TX300S_e-manual_D07-00-064P_RevA00 AVAIL: Minimum percentage of service availability allowed to still be compliant with the SLA. The service becomes unavailable if more than 50% of the frames are errored or missing in a one second interval. Availability is only guaranteed for traffic conforming to the CIR. Enter a percentage from 0-100. The user can also choose to Disable the AVAIL threshold evaluation. - Page 331 TX300S_e-manual_D07-00-064P_RevA00 Note: To run the test, make sure that traffic is being looped back at the far-end of the network under test. Configuration Test The Config. Tests tab lists the Pass/Fail status of each service and test. Tapping on the table brings up a screen with CIR, CIR/EIR and Policing Test results for the chosen Service.
- Page 332 TX300S_e-manual_D07-00-064P_RevA00 evaluated towards pass/fail criteria. CIR/EIR Test - Service 1 CIR/EIR test: The test passes if the received IR value is between the CIR (minus the margin allowed by the FLR) and CIR+EIR. Policing Test - Service 1 Policing test: The test passes if the received traffic rate is at least at the CIR (minus the margin allowed by the FLR) but does not exceed the allowed CIR+EIR.
- Page 333 TX300S_e-manual_D07-00-064P_RevA00 Summary: The Summary tab displays the status of each service and test as Pass, Failed, Pending, or Disabled. Perf. Test - Service 1 Performance Test The Service # tabs display min, mean, and max values for IR Mbps, FTD, FDV, Frame Loss Count, Frame Loss Ratio (%), Availability, and Errored Frame Count.
- Page 334 TX300S_e-manual_D07-00-064P_RevA00 Event Log A time stamped record or log of test types and test statuses (start/stop). Event Log Go back to top Go back to TOC...
-
Page 335: Throughput Testing (Multiple Streams)
TX300S_e-manual_D07-00-064P_RevA00 15.5 Throughput Testing (Multiple Streams) Overview: The throughput application (or the multiple streams application) performs the following measurements: throughput performance, frame loss analysis, delay analysis, frame/packet arrival analysis, received traffic type analysis, and received traffic frame size analysis. On the transmit side, the throughput application allows for the configuration of up to 8 traffic streams with their own MAC and IP addresses, VLAN tags (up to 3 per stream), bandwidth/rate, frame size, and L2 and/or L3 quality of service (QoS) parameters. - Page 336 TX300S_e-manual_D07-00-064P_RevA00 Page 2: #of Streams: From 1 to 10 streams. Note: # of Streams can be specified either on Page 1 or Page 2. It will be reflected on both pages. Delay Measurement Mode: Disable, Round Trip Delay, One-Way Delay with GPS/CDMA or Local One-Way Delay (for Dual Port Mode).
- Page 337 TX300S_e-manual_D07-00-064P_RevA00 Multiple Streams All streams are configured for the same test layer - if Layer 2 is selected, all streams will be Layer 2 traffic. Go back to top Go back to TOC 15.5.1.2 MX Discover and Control Settings For instructions on how to loop up/down the TX300/e with another test set or device, please refer to 15.1.4 MX Discover and Control.
- Page 338 TX300S_e-manual_D07-00-064P_RevA00 Multiple Streams - MAC/IP Address Setup If all of the streams are going to the same far-end unit, then the MAC/IP destination addresses must be the same on all of the streams. If any of the traffic streams are going to more than one far-end unit then ensure the correct MAC/IP destination addresses are configured for the respective streams.
- Page 339 TX300S_e-manual_D07-00-064P_RevA00 Go back to top Go back to TOC 15.5.1.5 Error Injection Settings (Per Stream Configuration) Error injection can be performed during test. The type of errors and error injection are configured in the Error Injection tab. Once the test is running, error injection can be performed by pressing the Error Inject button on the right side of the screen. Stream #: Select the stream to configure.
- Page 340 TX300S_e-manual_D07-00-064P_RevA00 Alarm injection can be performed during test. The type of alarms and alarm injection are configured in the Alarm Injection tab. Once the test is running, alarm injection can be performed by pressing the Alarm Inject button on the right side of the screen. Note: Alarm Injection is available only with 10GE Port Tests.
- Page 341 TX300S_e-manual_D07-00-064P_RevA00 Throughput Test - Summary (IP List) Throughput Test - Summary (VLAN List) Throughput Test - Summary (Port List)
-
Page 342: Starting/Stopping A Throughput (Multiple Streams) Test
TX300S_e-manual_D07-00-064P_RevA00 Go back to top Go back to TOC 15.5.1.8 Starting/Stopping a Throughput (Multiple Streams) Test Once all configurations have been made, the user can start the Throughput test (press the Start icon on the top right section of the screen). The following are three scenarios of how to prepare and start the unit for Throughput testing. Note: If testing on the fiber ports, make sure the LASER is turned On before starting the test. - Page 343 TX300S_e-manual_D07-00-064P_RevA00 The Global results pages displays measurements for all traffic streams as well as non test traffic. The Global Stream Summary screen displays: Stream number (#) Total received bandwidth per stream Errors/alarms associated with the stream Quality of Service (QoS) performance verification associated with each stream Throughput Results - Global Stream Summary QoS values are based on packet statistic thresholds for roundtrip delay, jitter, frame loss, and IP checksum from the ITU-T Y.1541 standard.
- Page 344 TX300S_e-manual_D07-00-064P_RevA00 IP Network QoS Class Definitions and Network Performance Objectives (Classes 4-7) Go back to top Go back to TOC The Aggregate screen displays these parameters:...
- Page 345 TX300S_e-manual_D07-00-064P_RevA00 Line Rate (Mbps): Negotiated rate of the interface (10M, 100M, or 1000M). This value is always fixed since it depends on the maximum capacity of the link under test, hence the test interface that is configured. Framed Rate: (Payload + MAC/IP Header + VLAN Tag + Type/Length + CRC) / (Payload + Total Overhead) * Line Rate % (in Mbps).
- Page 346 TX300S_e-manual_D07-00-064P_RevA00 Go back to top Go back to TOC The Global Errors screen displays the Current and Total error count of all streams: FCS/CRC: Number of received frames with an invalid Frame Check Sequence (FCS) IP Checksum: Invalid IP Frame Check sequence TCP/UDP Checksum (Layer 4 only) Jabber frames: Number of received frames larger than 1518 bytes containing an invalid FCS Runt frames: Number of received frames smaller than 64 bytes containing an invalid FCS...
- Page 347 TX300S_e-manual_D07-00-064P_RevA00 Throughput Results - Global Alarms Go back to top Go back to TOC The Global Events screen displays the Time, Event Type, Number of Events, and Test Type. Throughput Results - Global Events The Global Traffic screen displays: Frame Type of all streams Traffic Type of all streams Frame size of all streams Throughput Results - Global Traffic Summary...
-
Page 348: Per Stream Results
TX300S_e-manual_D07-00-064P_RevA00 Go back to top Go back to TOC The Global Delay tab: Delay measures the interpacket gap, start of the frame, and preamble duration. Frame arrival statistics are displayed in tabular format: Current, minimum, average, and maximum frame arrival time Current Frame Delay Variation Throughput Results - Global Delay Go back to top Go back to TOC... - Page 349 TX300S_e-manual_D07-00-064P_RevA00 Rates: Rate information associated with each stream. Throughput Results - Summary per Stream Go back to top Go back to TOC The Per Stream Errors screen displays the Current and Total error count of each stream. Bit: Indicates errors related to test pattern (Bit Error or LSS [Pattern Loss]) BER: Bit Error Ratio FCS/CRC: Number of received frames with an invalid Frame Check Sequence (FCS) IP Checksum: Invalid IP Frame Check sequence...
- Page 350 TX300S_e-manual_D07-00-064P_RevA00 Go back to top Go back to TOC The Per Stream Events screen displays a Date and Time stamped record of bit errors, alarms and other anomalies pertaining to each stream. Throughput Results - Events per Stream Go back to top Go back to TOC The Per Stream Traffic screen displays the frame type and frame size distribution pertaining to each stream.
- Page 351 TX300S_e-manual_D07-00-064P_RevA00 Go back to top Go back to TOC The Per Stream Delay screen displays the frame delay information pertaining to each stream. The Histogram shows the sampling points for the delay. Round Trip Delay Results and Histogram: Throughput Results - Delay per Stream Throughput Results - Round Trip Delay Histogram...
- Page 352 TX300S_e-manual_D07-00-064P_RevA00 One Way Delay Results and Histogram (Table and Graph): Throughput Results - Delay per Stream (One Way Delay) Throughput Results - One Way Delay Histogram Graph...
- Page 353 TX300S_e-manual_D07-00-064P_RevA00 Throughput Results - One Way Delay Histogram Table Go back to top Go back to TOC The Per Stream Rate screen displays the frame rate and data rate pertaining to each stream. Throughput Results - Rates per Stream Throughput Results - Rates per Stream (Rate Details)
-
Page 354: Saving Throughput (Multiple Streams) Results
TX300S_e-manual_D07-00-064P_RevA00 Go back to top Go back to TOC 15.5.2.4 Saving Throughput (Multiple Streams) Results Once the test has been stopped the results can be saved by pressing the Save key on the VePAL’s keypad. The results will be saved and named automatically. Once the results are saved, the user may view or rename the results file by going to Home > Files >... -
Page 355: Ethernet Oam Testing
TX300S_e-manual_D07-00-064P_RevA00 15.6 Ethernet OAM Testing Ethernet OAM provides automatic defect detection, fault management and performance monitoring tools for network links and end-to- end Ethernet Virtual Circuits (EVC). The OAM service supports IEEE 802.3ah, IEEE 802.1ag, and ITU-T Y.1731. Go back to top Go back to TOC 15.6.1 OAM Setup 15.6.1.1 Link Level 802.3ah OAM Setup 802.3ah functions include:... - Page 356 TX300S_e-manual_D07-00-064P_RevA00 802.3ah OAM Tap on the check box to start 802.3ah protocol testing. Transmission of OAM PDUs starts as soon as the box is checked. OAM Mode Select Active or Passive mode from the drop-down menu. Active and passive mode determines the type of actions the test set will take.
-
Page 357: Service Level Oam: 802.1Ag/Y.1731 Setup
TX300S_e-manual_D07-00-064P_RevA00 Notice that each device can be placed in any mode as long as the remote and local device are not both in passive mode. Discovery Capabilities: Capabilities advertised during discovery process Remote Loopback Link Events: Supported, but no stateful MIB Retrieval: Can be advertised but is not supported in current release Unidirection Remote Loopback: The user can transmit a loopback command to place the remote unit into loopback mode. - Page 358 TX300S_e-manual_D07-00-064P_RevA00 Service Level OAM Configuration Parameters MD Name: Name of the Maintenance Domain (only for 802.1ag) MA Name: Enter the name of the 802.1ag MA or Y.1731 MG MD Level: Maintenance domain level (0 to 7) MEP ID: End point identifier (1 to 8191) Primary VLAN ID: VLAN ID associated with the MA or MEG Direction Up: Inward facing MEP used for MA/MEG with a wider reach (i.e., end-to-end, beyond a single link)
- Page 359 TX300S_e-manual_D07-00-064P_RevA00 Some terms differ between the two protocols. The chart below describes the differences. Definition Equivalencies Maintenance Point Roles Go back to top Go back to TOC OAM Services Setup Under the same tab, OAM Services pertaining to 802.1ag and/or Y.1731 can be enabled. The tests listed include: Continuity Check (CCM) Loopback (LBM/LBR) Link Trace (LTM/LTR)
- Page 360 TX300S_e-manual_D07-00-064P_RevA00 Loss Measurement (LMM/LMR) (Y.1731 Only) Delay Measurement (DMM/DMR) (Y.1731 Only) General Setup To run any 802.1ag/Y.1731 Tests, fill out the listed parameters and press Start. In the case of CCM, select Enable from the drop- down menu to run that test. Details on individual test parameters will be listed in the specified section. 802.1ag/Y.1731 Connectivity Fault Management Functions 802.1ag/Y.1731 Connectivity Fault Management Functions supported by the TX300/e are as listed: Fault Detection –...
- Page 361 TX300S_e-manual_D07-00-064P_RevA00 CCM Configuration Parameters Enable: Enable sending Continuity Check messages Disable: Disable sending Continuity Check messages Priority: 802.1p priority in the CCM VLAN Tag Tx Interval: Choose from the supported CCM intervals: 1 s, 10 s, 1 min, 10 min. Link Trace and Loopback Messages OAM - Service Level OAM (Page 2) Link Trace Messages (LTM/LTR)
- Page 362 TX300S_e-manual_D07-00-064P_RevA00 Link Trace Message Format Link Trace Response Format Loopback Message (LBM/LBR) LBM (Loopback Message) are unicast messages transmitted on demand to a destination MAC address. A destination address responds with an LBR (Loopback Reply Message). LBM Diagram Loopback Message Format...
- Page 363 TX300S_e-manual_D07-00-064P_RevA00 Link Trace and Loopback Message Config. Parameters Destination MEP: Sends LTM/LBM to the destination MEP as configured on Page 1. MAC: Sends LTM/LBM to a destination MAC address. Priority: 802.1p priority in the LTM/LBM VLAN Tag. Destination MAC: Configure the destination MAC address used for the LTM/LBM. This field is only used if Destination is set to MAC.
-
Page 364: Oam Results
TX300S_e-manual_D07-00-064P_RevA00 Press Start to initiate testing. Frame Loss Measurement Two local counters for each peer MEP: TxFCf: Counter for in-profile data frames transmitted towards peer MEP RxFCf: Counter for in-profile data frames received from peer MEP Single-ended ETH-LM: On demand OAM MEP sends LMM frame (Unicast DA or Multicast Class 1 DA) and receives LMR frame (Unicast DA) with counters CCM frames contain frame counters. - Page 365 TX300S_e-manual_D07-00-064P_RevA00 Link OAM Discovery The discovery page lists Local (the current test unit) and Remote (far-end device) parameters. OAM - Link - Discovery (Page 1) Mode: Lists Active or Passive mode configuration. Supported and unsupported capabilities advertised during Discovery are listed, including: Unidirection, Link Events, Remote Loopback, MIB Retrieval, and MTU Size.
-
Page 366: Oam Service Results
TX300S_e-manual_D07-00-064P_RevA00 OAM PDU OAM PDU Transmitted and received 802.3ah OAM PDU are displayed with other Link OAM statistics: Information: Information OAM PDU acts as a "heartbeat" message. Discovery must be restarted if no OAM PDU is received after 5 seconds. Unique and Duplicate Events are Threshold crossing events not supported in the current TX300/e release. - Page 367 TX300S_e-manual_D07-00-064P_RevA00 OAM CCM Results RDI, LOC, XCON, UNEXP, and Alarm will display an I or A status with I = Inactive, A = Active. MPID: MEP ID of the remote MEP. Remote MAC: MAC address of the remote MEP. RDI: The CCM received contains the RDI flag set. LOC: The MEP detects loss of connectivity.
- Page 368 TX300S_e-manual_D07-00-064P_RevA00 No Match: The loopback transaction ID between the LBM and LBR do not match OAM - Service - LTM OAM LTM Results Action: RlyHit indicates that the LTM has reached the destination MAC/MEP (i.e., final point) MAC: MAC address of the responder TTL: TTL field on the response, indicated how many hops have been traversed Flags: If set, indicates that only MAC addresses learned in a Bridge's Filtering Database, and not information saved in the MIP CCM Database, is to be used to determine the Egress Port...
- Page 369 TX300S_e-manual_D07-00-064P_RevA00 OAM LMM Parameters OAM - Service - DMM OAM - DMM Message...
- Page 370 TX300S_e-manual_D07-00-064P_RevA00 OAM DMM Parameters DMM Status: Lists status (In progress, Fail, or Complete) Delay Samples: Number of frames transmitted Average Delay: Average round trip delay over the number of delay samples Average Variation: Average round trip delay variation over the number of delay samples Last Delay: Last round trip delay value measured Last Variation: Last round trip delay variation value measured Go back to top Go back to TOC...
-
Page 371: Setup
TX300S_e-manual_D07-00-064P_RevA00 15.7 Monitor (Pass Through) Test Port Selection Pass through monitor mode enables the test set to be used for long term in-service testing. This allows for bi-directional monitoring of up to full gigabit Ethernet line rate on the two 1000Base-X ports or the two 10/100/1000T ports. The Pass Through functionality allows: In-line traffic monitoring in both directions Long or short term network monitoring for troubleshooting network traffic problems... -
Page 372: Results
TX300S_e-manual_D07-00-064P_RevA00 Thresholds: Set values for Port 1 and Port 2. The thresholds can be enabled or disabled depending on test requirements. When enabled, the pass through will show a pass/fail status based on the configured threshold values. Utilization in % CRC error count Service Disruption in ms Optical Power level in dBm (1000Base-X connections only) -
Page 373: Loopback Mode
TX300S_e-manual_D07-00-064P_RevA00 15.8 Loopback Mode The Loopback application in the main menu allows the user to establish a manual loopback on the test set. The loopback function is used when an end-to-end test needs to be performed with one of the test partners in software loopback mode. The loopback function will loopback the incoming traffic to the test set back into the network under test. - Page 374 TX300S_e-manual_D07-00-064P_RevA00 Go back to top Go back to TOC...
-
Page 375: Advanced Tools (Tx300 Only)
TX300S_e-manual_D07-00-064P_RevA00 15.9 Advanced Tools (TX300 only) Advanced Tools All VePAL V300 units feature two Advanced Tools menus--one that offers test applications common to all V300 units and one that offers applications on select units. The descriptions for each menu are described below. Please note, IPTV, Net Wiz, and Packet Capture functions are covered in 8.0 Advanced, V300 Common Functions manual. - Page 376 TX300S_e-manual_D07-00-064P_RevA00 VLAN Scan scans up to 4096 VLAN IDs for switch configuration and displays VLAN ID bandwidth rates, useful for identifying top bandwidth users based on VLAN ID. Monitor mode monitors up to eight live traffic streams (in terminate mode) and filters them based on VLAN ID configuration, providing key traffic metrics such as frame type, rates, and errors and alarms.
- Page 377 TX300S_e-manual_D07-00-064P_RevA00 Monitoring Traffic To only receive traffic streams meeting specific criteria, stop the scan and go to the Monitor tab to configure filter criteria. Tap on a parameter box to configure it. Place a check next to a parameter to only receive traffic that matches this criteria. For descriptions of each parameter, please see, 15.5.1 Setup for Throughput Testing (Multiple Streams).
- Page 378 TX300S_e-manual_D07-00-064P_RevA00 Monitor Per Stream Results Note: If no stream information is displayed in the Per Stream tab, return to the VLAN ID tab (Results > Scan > VLAN ID) and verify that the VLAN ID boxes are checked. Go back to top Go back to TOC...
-
Page 379: Fiber Channel
TX300S_e-manual_D07-00-064P_RevA00 16.0 Fiber Channel Fibre Channel Applications Introduction Enterprises worldwide rely on complex IT infrastructures to store and maintain critical data and applications. Storage Area Networks (SANs) have evolved to improve availability, resiliency, performance, modularity and geographical distribution of data storage systems and Fiber Channel is an important technology for linking SANs together. -
Page 380: Setup
TX300S_e-manual_D07-00-064P_RevA00 The TX300/e Fibre Channel option addresses all the transport layers by measuring the optical power level and supporting the generation/analysis of bit errors, order sets, frame delimiters, frame transmission, and the generation of primitive sequences. User defined bytes, fixed test patterns or industry-standard PRBS patterns can be selected and inserted into the payload field depending on the test layer. -
Page 381: Test Applications
TX300S_e-manual_D07-00-064P_RevA00 Confusing naming and spelling conventions have stuck with Fibre Channel during its development. The word “channel” in no way indicates a preference for channel protocols or environments. Even though “fibre” and “fiber” are semantically equivalent (“fibre” is the international English spelling), “Fibre Channel”... -
Page 382: Port Configuration
TX300S_e-manual_D07-00-064P_RevA00 order to be displayed or be enabled. Note: The IP function is not supported in the V300 series. Go back to top Go back to TOC 16.1.3 Port Configuration Fiber Channel - Port Setup Fiber Profile: Predefined Fiber Channel test profiles or Default setting Speed: Selectable test rates via drop-down menu: 1G (1.0625 Gbps) 2G (2.125 Gbps) -
Page 383: Bert/Throughput
TX300S_e-manual_D07-00-064P_RevA00 Only available when PSP is enabled Initializes the Fibre Channel link and manages various states, including link failure, loss of synchronization, loss of signal, or protocol violations B-to-B (Tx): Buffer to Buffer: Valid settings are in the range from 1 to 65535. Number of local port frame buffers are available to receive frames from another port Determines how many frames can be sent before receiving R_RDY acknowledgements. - Page 384 TX300S_e-manual_D07-00-064P_RevA00 demux equipment for error monitoring and detection. The TX300/e displays the BERT test results continuously and any anomaly is recorded in an event log which is date and time stamped. All results can be saved and exported into ReVeal MX for analysis or customer test report generation.
-
Page 385: Setup
TX300S_e-manual_D07-00-064P_RevA00 FC-3 defines common services that may be available across multiple ports in a node. This level has no standard now. Services for multiple ports on one node FC-4 defines the mapping between the lower levels of Fibre Channel, and the command sets that use Fibre Channel. Upper Layer Protocol (ULP) mapping Small Computer System Interface (SCSI) Internet Protocol (IP) - Page 386 TX300S_e-manual_D07-00-064P_RevA00 FC-2: Only FC-2 frames have a header, so these fields are not available for FC-1 frames. Defines the framing rules and mechanisms for controlling the different service classes. The following building blocks are defined by the standard: Ordered Set Frame Sequence Exchange...
- Page 387 TX300S_e-manual_D07-00-064P_RevA00 CRC - The Cyclic Redundancy Check (CRC) Is a four byte field that follows the Data Field and is used to verify the data integrity of the Frame Header and Data Field. SOF and EOF delimiters are not included in the CRC verification The CRC field is calculated on the Frame Header and Data Field prior to encoding for transmission and after decoding upon reception Frame Delimiters...
- Page 388 TX300S_e-manual_D07-00-064P_RevA00 SOF Normal (SOFnx) The following delimiters identify the start of all frames other than the first frame of a Sequence based on class of service. SOFnx is used to indicate SOFn1, SOFn2, SOFn3 and SOFn4. SOF_n3: Contains a code value of 0x36 indicating SOF Normal Class 3. The SOFn3 shall be used for all frames except the first frame of a Sequence for Class 3 Service.
- Page 389 TX300S_e-manual_D07-00-064P_RevA00 Go back to top Go back to TOC Payload The TX300/e implements and observes "Methodologies for Jitter and Signal Quality Specification (MJSQ)". A major goal of MJSQ is to improve the relationship between measurements on signals and receiver performance in terms of bit errors. The unit transmits a "compliant pattern"...
- Page 390 TX300S_e-manual_D07-00-064P_RevA00 FC-1 Test Patterns CRPAT sequence is offered for TX jitter measurements. CRPAT and CJTPAT are available for RX jitter tolerance measurements - use these test patterns to test the resilience of the receiver (Clock Data Recovery - CDR) and its tolerance to signals with jitter.
- Page 391 TX300S_e-manual_D07-00-064P_RevA00 BERT Testing Tips A BERT samples every incoming bit and looks for something that doesn't occur often. This traditional method typically used in SONET/SDH measurements, can however take a very long time. For example, in a 1Gbps Fiber Channel system, errors occur on average once every 1000 s –12 (about 17 Min) for 1x10 BER, so you would need to detect at least 10 to 100 errors before you...
- Page 392 TX300S_e-manual_D07-00-064P_RevA00 FC-2 Header Format The Frame Header is the first field of the frame content and immediately follows the SOF delimiter. The Frame Header is used to control link operations and device protocol transfers as well as detect missing or out of order frames. The values of each field can be edited depending on network setup and test scenario.
-
Page 393: Traffic Generation And Error Injection
TX300S_e-manual_D07-00-064P_RevA00 When supported by FC_Ports, the Priority field shall be used to resolve resource contention or to determine the order to deliver frames. The definition and use of the Priority field is class dependent. S_ID Address Identifier: The S_ID is a three-byte field (Word 1, Bits 23-0) that contains the address identifier of the source Nx_Port. Type (Data Structure Type): The data structure type (TYPE) is a one-byte field (Word 2, Bits 31-24) that identifies the protocol of the frame content for Data frames. -
Page 394: Starting Measurements
TX300S_e-manual_D07-00-064P_RevA00 Valid settings are 1% to 100% in 0.01% increments Traffic Setup Go back to top Go back to TOC Error Injection Setup Error injection can be performed during a test. The type of errors and error injection rate or flow are configured in the Error Injection tab. -
Page 395: Results
TX300S_e-manual_D07-00-064P_RevA00 TX Start button: Activate the Transmitter to initiate the BER measurement. FC-1/2 BERT - Prior to Starting Go back to top Go back to TOC 16.2.5 Results Summary Line Rate: Indicates the transmitted and received bit rate 1.0625 Gbps, 2.125 Gbps, 4.25 Gbps, 8.50Gbps, or 10.52 Gbps displayed in Mbps Framed Rate: Total number of frames including overhead of any type per second (Mbytes) Data rate: Total count of frames with payload data per second (Mbytes) Utilization: Bandwidth utilization in %... - Page 396 TX300S_e-manual_D07-00-064P_RevA00 Current and Total values for: Bits: Number of bits received BER: Bit error ratio based on PRBS received or ratio of payload bit errors to total received payload bits Symbol: Symbol error or Code Violation is a bit error or disparity error occurring in a primitive sequence or Ordered Set FCS/CRC: Number of frames with either a bad or missing CRC or Frame Check Sequence Oversize: Number of Oversize frames received (>...
- Page 397 TX300S_e-manual_D07-00-064P_RevA00 Go back to top Go back to TOC Events Time stamped event table: Time: Indicates when the test was started, an anomaly occurred or a test was stopped Events: Indicates type of anomaly Test: Indicates the test mode BERT - Events Go back to top Go back to TOC Traffic Distribution Overview Graphical representation of:...
- Page 398 TX300S_e-manual_D07-00-064P_RevA00 Go back to top Go back to TOC Traffic Distribution Details - Frames Received Frames (RX) Total: Total number of frames received Test: Number of test frames received Non-Test: Number of non-test frames received Transmitted Frames (TX) Total: Number of test frames transmitted Flow Control: Flow control is the FC-2 control process to pace the flow of frames between Nx_Ports, an Nx_Port and the Fabric and within the Fabric to prevent overrun at the receiver.
- Page 399 TX300S_e-manual_D07-00-064P_RevA00 Traffic Distribution - Traffic Type Fibre Channel supports three classes of services, and a fourth which is a combination of classes 1 and 2. Similar to ATM, different classes allow Fibre Channel to support a variety of communication needs. Class 1: Provides a circuit-emulation service for time-sensitive applications such as video teleconferencing.
- Page 400 TX300S_e-manual_D07-00-064P_RevA00 Delay Frame Arrival Delay or Latency is the round-trip delay experienced by a frame as it traverses the fiber link or network. The difference between the transmitted time and received time is the measured delay. Indicates the Current, Minimum, Maximum, and Average frame arrival delay during the test period. Throughput only Current, Minimum, Maximum, and Average round-trip delay during the test period is also displayed.
- Page 401 TX300S_e-manual_D07-00-064P_RevA00 BERT - Frame Rate Details Go back to top Go back to TOC Signal Level (Page 1) The Signal tab displays the Level and Frequency screen. Page 1 displays the level measurement Loss of Signal (LOS), and the Saturation level for optical signals is shown graphically, including the level measurement in dBm. Signal - Level (Page 1) Optical Information (Page 2) Page 2 displays the Optical module XFP information which includes Vendor name, Part number, and Optical Wavelength.
-
Page 402: Loopback
TX300S_e-manual_D07-00-064P_RevA00 Go back to top Go back to TOC 16.3 RFC 2544 The RFC 2544 Ethernet test suite is adapted to Fiber Channel circuits to verify 1Gbps, 2Gbps, 4Gbps, 8Gbps and 10Gbps SAN networks. The automated RFC 2544 test routine/analysis ensures repeatable installations: Check buffer parameters needed to achieve desired Service Level Agreement (SLA) Determine optimum buffer size - Capacity versus link speed Determine minimum buffer credits for selected throughput for each frame length... - Page 403 TX300S_e-manual_D07-00-064P_RevA00 Modes of operation: Manual and Responder (future) Mode (FC layer): FC-1 or FC-2 Layer loopbacks are supported. In FC-2 mode, the destination and source IDs (D_ID and S_ID) are swapped including any other relevant Header fields (e.g., OX_ID, RX_ID, etc.). FC-1/2 Manual Loopback Active To enable the loopback, press Start from the drop-down menu.
-
Page 404: Interface Specifications
TX300S_e-manual_D07-00-064P_RevA00 17.0 CPRI Testing Overview Interface Specifications CPRI Testing QoS Requirements Test Areas Test Ports CPRI BERT Setup Test Pattern Traffic Pattern Error Injection CPRI BERT Results Summary Signal Errors Alarms Events Saving and Retrieving Files File Management in ReVeal CPRI Overview CPRI stands for Common Public Radio Interface This protocol has been developed by Ericsson AB, Huawei Technologies Co. - Page 405 TX300S_e-manual_D07-00-064P_RevA00 Protocol Stack Go back to top Go back to TOC Physical Layer The following Line bit rates are defined from the standard: Line Coding: 8B/10B line coding shall be used for serial transmission according to IEEE 802.3-2005, clause 36. (Same encoding as used for Gigabit Ethernet and Fibre Channel) Bit Error Correction/Detection: The physical layer is designed in such a way that a very low bit error ratio can be achieved without expensive forward...
- Page 406 TX300S_e-manual_D07-00-064P_RevA00 17.2 CPRI Testing QoS Requirements Bit Error Ratio: The interface shall provide U-plane and C&M plane data transmission (on Layer 1) with a maximum bit error ratio of Maximum Delay: In order to support efficient implementation of UTRA-FDD inner loop power control, the absolute round trip time for U-plane data (IQ data) on the interface, excluding the round trip group delay on the transmission medium (i.e., excluding the cable length), shall not exceed the following maximum value of 5 µs.
- Page 407 TX300S_e-manual_D07-00-064P_RevA00 17.2.1 CPRI BERT Setup Tap on Test Mode and select CPRI Testing from the menu to access this feature. Test Mode Selection Before proceeding with BER testing, configure the Header, Traffic, and Error Injection tabs under Setup (BERT icon > Setup). When finished configuring BERT settings, press the Start button to run the tests.
- Page 408 TX300S_e-manual_D07-00-064P_RevA00 17.2.1.1 Test Pattern Header Configuration Tap on the Data icon to reach the Header Configuration and select a test pattern. Tap the close button , located at the top right corner of the screen to apply configurations and return to the previous screen. Go back to top Go back to TOC 17.2.1.2 Traffic Pattern BERT Traffic Tab...
- Page 409 TX300S_e-manual_D07-00-064P_RevA00 In this release, the error type is fixed as Bit at Single error injection. An error injects each time the Error Injection button is pressed. Go back to top Go back to TOC...
- Page 410 TX300S_e-manual_D07-00-064P_RevA00 17.2.2 Results Results Pressing the Start button brings up the Results screen. Go back to top Go back to TOC 17.2.2.1 Summary The following screen displays a Summary of the test results: Summary tab Line Rate (bps): Negotiated rate of the interface. This value is always fixed since it depends on the maximum capacity of the link under test, hence the test interface that is configured.
-
Page 411: Signal
TX300S_e-manual_D07-00-064P_RevA00 TX Pattern: The test pattern being transmitted. RTD: If Round Trip Delay measurements are enabled, RTD will be indicated as On and results (Current/Average/Min/Max) will be displayed. To enable or disable Round Trip Delay measurement, tap on the RTD On/Off button located in the right side column. -
Page 412: Errors
TX300S_e-manual_D07-00-064P_RevA00 The Signal tab shows Receiver Saturation and Loss of Signal thresholds. Tx and Rx optical power levels are measured by the transceiver. Go back to top Go back to TOC 17.2.2.3 Errors Tap on the Errors tab to view test measurements. The test should run for at least 6 minutes. Please make note of the BER. Bits: Indicates errors related to test pattern (Bit Error or LSS [Pattern Loss]) BER: Bit Error Ratio Symbol: Declared when an invalid code-group in the transmission code is detected... -
Page 413: Alarms
TX300S_e-manual_D07-00-064P_RevA00 Go back to top Go back to TOC 17.2.2.4 Alarms Tap on the Alarms tab to view the Loss of Signal (duration) and Pattern Loss (events). Alarms tab Go back to top Go back to TOC 17.2.2.5 Events This Events tab displays a list of events for the test in progress. Events tab... - Page 414 TX300S_e-manual_D07-00-064P_RevA00 Go back to top Go back to TOC 17.2.2.6 Saving and Retrieving Files At any time when the test is in progress or completed, press the Save key on the rubber keypad to save test results. Use the alphanumeric keyboard to name the file and press Apply to save the results and close the keyboard screen. Saving and Naming Results To access Saved results, access the Files >...
-
Page 415: File Management In Reveal
Go back to top Go back to TOC 17.2.3 File Management in ReVeal All files can be managed through the VeEX ReVeal PC Software. Simply connect the management port of the unit to a PC and launch ReVeal MTX300 on the PC. For further instructions on managing CPRI test results on ReVeal, including downloading and creating reports, please see 5.0 Results in the ReVeal... -
Page 416: Profiles
TX300S_e-manual_D07-00-064P_RevA00 18.0 Profiles Profiles can be created in any application that has a "Profiles" drop-down menu available. The PDH, SDH, OTN, Ethernet and Fiber Channel applications all have the ability to save profiles. Profiles can be viewed and loaded in the Profiles folder located in the Files folder structure. Accessing and Configuring Profiles To access the Profiles menu from the OTN/SDH/SONET Testing main menu, tap on the following icons: Advanced Mode >... -
Page 417: Common Functions
TX300S_e-manual_D07-00-064P_RevA00 19.0 Common Functions IP Tools menu The following functions are common to all V300 test sets. Please refer to the V300 Common Functions manual for these sections. Please note that they are renumbered in the manual: 19.1 (5.0) IP: Ping, Trace Route, Web/FTP, ARP Wiz, VoIP 19.2 (6.0) Net Wiz 19.3 (7.0) WiFi Wiz 19.4 (8.0) Advanced Tools... -
Page 418: Warranty And Software
Replace hardware which proves to be defective provided that the products that the customer elects to replace is returned to VeEX Inc. by the customer along with proof of purchase within thirty (30) days of the request by the customer, freight prepaid. -
Page 419: Product Specifications
TX300S_e-manual_D07-00-064P_RevA00 21.0 Product Specifications The TX300/e product specifications are available for download in PDF format on the VeEX customer website. Please note that Adobe Reader version 9.0 or higher is needed to open and view the file. To get the latest free version of Adobe Reader, click here. -
Page 420: Certification And Declarations
Use of this logo implies that the unit conforms to requirements of European Union and European Free Trade Association (EFTA). EN61010-1 For a copy of the CE Declaration of Conformity relating to VeEX products, please contact VeEX customer service. What is RoHS? RoHS is the acronym for Restriction of Hazardous Substances. - Page 421 TX300S_e-manual_D07-00-064P_RevA00 23.0 About VeEX VeEX Inc., the Verification EXperts, is an innovative designer and manufacturer of test and measurement solutions addressing numerous technologies. Global presence through a worldwide distribution channel provides uncompromised product support. Visit us online at www.veexinc.com for latest updates and additional documentation.
Need help?
Do you have a question about the VePAL TX300M and is the answer not in the manual?
Questions and answers