Table of Contents
Advertisement
Advertisement
Chapters
Table of Contents

Related Manuals for Bruker AVANCE NEO


Summary of Contents for Bruker AVANCE NEO
- Page 1 AVANCE NEO Beginners Guide ● User Guide Version 001 Innovation with Integrity...
- Page 2 © August 21, 2018 Bruker Corporation Document Number: 10000061270 P/N: H171804E For further technical assistance for this product, please do not hesitate to contact your nearest BRUKER dealer or contact us directly at: Bruker Corporation am Silberstreifen 76287 Rheinstetten Germany Phone: +49 721 5161 6155 E-mail: nmr-support@bruker.com...
-
Page 3: Table Of Contents
Contents Contents Introduction............................ 5 Sources of Hazards ...................... 5 Software Version and Command Syntax ................ 5 Safety.............................. 7 Magnetic Safety ........................ 7 2.1.1 Cryogenic Safety......................... 7 Electrical Safety ........................ 7 Chemical Safety........................ 8 CE Certification ........................ 8 Introductory Theory and Terminology ..................... 9 NMR Analysis of Chloroform..................... 11 Reference Compounds, Hertz, ppm ................. 13 Proton NMR - Chemical Shift.................... 14 Proton Spectrum of Benzene.................... 15 Proton Spectrum of Benzylacetate ................... 16... - Page 4 Contents 5.4.2 Probes Equipped with ATM Using the Manual Tuning Routine ........ 41 Spinning the Sample...................... 43 Shimming .......................... 44 5.6.1 Routine Shimming Using TopShim ................... 44 Setting the Probe/Solvent Dependent Parameters ............ 44 Adjusting the Receiver Gain ..................... 44 Starting the Acquisition ..................... 44 5.10 Processing the Data...................... 45 Preparing for Acquisition, Frequency Related Parameters............ 47 Frequency ......................... 47 Numerical Explanation of Transmitted, Basic and Offset Frequencies...... 48...
-
Page 5: Introduction
Introduction Introduction The goal of this manual is to describe the basic components of a Bruker spectrometer, their functionality, and how they are addressed by the TopSpin software to acquire NMR data. This should enable a relatively inexperienced user to carry out a series of basic 1-D High Resolution (HR) NMR experiments. - Page 6 Introduction 6 / 86 H171804E_14_001...
-
Page 7: Safety
Safety Safety In terms of safety the presence of a relatively strong magnet is what differentiates NMR spectrometers from most other laboratory equipment. When designing an NMR laboratory, or training personnel who will work in or around the laboratory, no other feature is of greater significance. -
Page 8: Chemical Safety
Safety Chemical Safety Users should be fully aware of any hazards associated with the samples they are working with. Organic compounds may be highly flammable, corrosive, carcinogenic etc. CE Certification All major hardware units housed in the AVANCE consoles, as well as peripheral units such as the HPPR, shim systems and probe comply with the CE Declaration of Conformity. -
Page 9: Introductory Theory And Terminology
Introductory Theory and Terminology Introductory Theory and Terminology NMR is a technique used to analyze the structure of many chemical molecules, primarily organic compounds. A typical compound might consist of carbon, hydrogen and oxygen atoms. In its simplest form, an NMR experiment consists of three steps: 1. -
Page 10: Figure 3.2: Nmr Spectrum
Introductory Theory and Terminology 2) Local Atomic Environment: Superimposed on the basic resonance frequency is an effect due to the local atomic environment in which an isotope is situated. The precise value of the resonance frequency of H nucleus in a particular compound will depend upon the atoms it is bonded to and surrounded by. -
Page 11: Nmr Analysis Of Chloroform
Introductory Theory and Terminology Note that there are experiments in which more than one nucleus gets excited, e.g. during polarization transfer or decoupling. In these cases one has more than one carrier frequency but still only one observe frequency. Not all isotopes will respond to radio frequency pulses, i.e. not all are NMR active. Three isotopes of the element hydrogen are found in nature: H (hydrogen), H (deuterium), and... -
Page 12: Figure 3.4: Nmr Signals Emitted By Chci3
Introductory Theory and Terminology Figure 3.4: NMR Signals Emitted by CHCI3 1 Intensity 2 Frequency (MHz) This artificial spectrum shows three peaks corresponding to the three isotopes. Taking the relative numbers of the three isotopes into account, one might expect that the intensity of the chlorine, hydrogen and carbon peaks would be in the ratio of 3:1:1. -
Page 13: Figure 3.5: Converting Hertz And Ppm
Introductory Theory and Terminology Reference Compounds, Hertz, ppm It has already been stated that NMR signals are analyzed with respect to two characteristics, intensity and frequency. Absolute frequencies are measured in Hertz (Hz - cycles per second) or Megahertz (MHz). Reporting on measured signals is simplified if all frequency measurements are made with respect to a reference. -
Page 14: Proton Nmr - Chemical Shift
Introductory Theory and Terminology Experienced users will always deal in ppm, and spectra reproduced in scientific journals will have the horizontal scale graduated in ppm and not in Hertz. The reader should be aware of some simplifications that have been made in the above example. -
Page 15: Proton Spectrum Of Benzene
Introductory Theory and Terminology Proton Spectrum of Benzene The structure of the benzene ring is illustrated in the following figure: Figure 3.7: Benzene Ring All six protons (labeled H ) may be deemed identical. They are each single-bonded to one carbon atom. Each carbon atom in turn forms two aromatic bonds with its nearest carbon neighbors. -
Page 16: Proton Spectrum Of Benzylacetate
Introductory Theory and Terminology Proton Spectrum of Benzylacetate Benzylacetate (C - CH - O - CO - CH ) is a more complicated organic molecule whose structure is illustrated in the following figure: Figure 3.9: Benzylacetate We can now distinguish between three different groups of protons that have been labeled accordingly. -
Page 17: Proton Spectrum Of Ethylbenzene With Spin/Spin Coupling
Introductory Theory and Terminology Figure 3.10: Proton Spectrum of Benzylacetate Proton Spectrum of Ethylbenzene with Spin/Spin Coupling The description of proton NMR spectra thus far has been greatly simplified by the fact that all signals, with the exception of those from the benzene ring in benzylacetate, have been singlets. -
Page 18: Figure 3.11: Ethylbenzene
Introductory Theory and Terminology Figure 3.11: Ethylbenzene Figure 3.12: Ethylbenzene Spectrum 18 / 86 H171804E_14_001... -
Page 19: Decoupling
Introductory Theory and Terminology The splitting of NMR signals in the figure Ethylbenzene results from a magnetic interaction between neighboring protons. The two H protons are magnetically equivalent and do not interact with each other. Similarly, the three H protons are magnetically equivalent and do not affect each other. -
Page 20: Figure 3.13: Decoupling Experiment
Introductory Theory and Terminology Figure 3.13: Decoupling Experiment Figure 3.14: Ethylbenzene Spectrum with Homodecoupling The experiment described above is an example of homodecoupling in that the same isotope, namely H, is observed and decoupled. Heterodecoupling is where the isotope to be observed is different to that which is decoupled. In the chapter ¹³C Spectrum with Proton Decoupling [} 67] of this manual you will perform a heterodecoupling experiment where you... -
Page 21: Fid And Spectrum
Introductory Theory and Terminology FID and Spectrum The signals emitted by the excited atoms in the sample are received by the spectrometer and Fourier transformed by the software of the data station computer. The process of receiving the NMR signals is called an acquisition. Data is said to be acquired. A distinction should be made between the two terms;... - Page 22 Introductory Theory and Terminology 22 / 86 H171804E_14_001...
-
Page 23: System Description
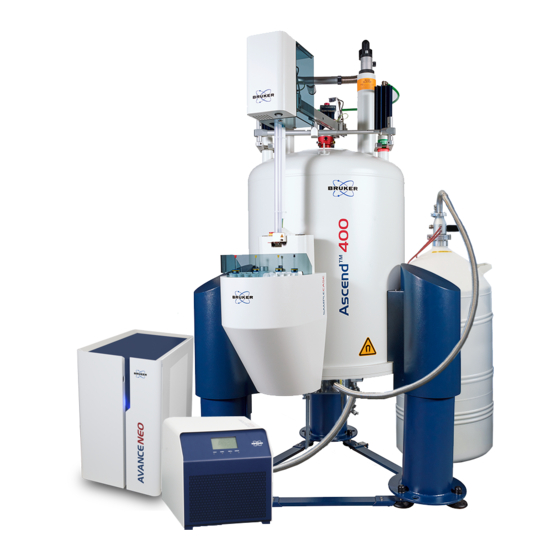
The spectrometer consists of the following subunits: • Operator console including the host computer, monitor and the keyboard. • Console containing the electronic hardware. • Magnet system including the shim system and the probe. Figure 4.1: AVANCE NEO Console and Ascend Magnet H171804E_14_001 23 / 86... -
Page 24: Avance Architecture Overview
System Description AVANCE Architecture Overview The picture below shows a simplified architecture overview of an AVANCE NEO system. Please use the BASH (Bruker Advanced Service Handbook) for further information about the AVANCE system and hardware. Figure 4.2: AVANCE NEO Architecture Overview 4.1.1... -
Page 25: Console
AQS, the BSMS (Bruker Smart Magnet System), as well as various amplifiers and gradient amplifiers (in the case of MicroImaging or Diffusion. AQS: The various units within the AQS generate the radio frequency pulses used to excite the sample and receive, amplify and digitize the NMR signals emitted by the sample. -
Page 26: Link Between The Host Computer And The Aqs
System Description Link between the Host Computer and the AQS Although during a typical TopSpin session this link is permanently in operation and effectively invisible to the user, the link is broken anytime either the host computer or the console is switched off and must be re-established when they are switched back on. -
Page 27: The Magnet And Magnet Dewar
(i.e. battery or mains supply). Once a current is started in a superconducting loop it will continue forever. Bruker magnets consist of such a superconducting loop. The only maintenance required on the magnet is to ensure that the coil is kept immersed in liquid helium. -
Page 28: Room Temperature Bore
System Description Figure 4.4: Superconducting Magnet 1 Insert Probe here 6 Helium Tower 2 Bore 7 Metal Plug 3 Nitrogen Tower 8 Insert sample here 4 Nitrogen Ports 9 Vacuum Chamber 5 Helium Ports 10 Magnet 4.5.1 Room Temperature Bore The helium and nitrogen tanks are wrapped around a central column known as the magnet bore. -
Page 29: Helium Tank
System Description 4.5.2 Helium Tank In a standard magnet the helium tank is suspended from two necks which extend high above the magnet. Access to the helium tank can be made via two ports. One of these ports permits refilling of the liquid helium and is also the entry for a helium level sensor. The other port is used only when the magnet is being charged or discharged. -
Page 30: Probes
System Description Probes The probe is designed to hold the sample, transmit radio frequency signals which excite the sample and receive the emitted response. The transmission and reception is achieved by using specially designed RF coils. The probe is inserted into the bottom of the magnet and sits inside the room temperature shims. -
Page 31: Figure 4.6: Typical Hppr Cabling
System Description Signals enter and leave the coils of the probe via connectors which are clearly labeled and located at the base of the probe. The same cable is used to carry the signal to and from the probe. Each probe has an inner coil (the observe coil). This coil is located closest to the sample volume to maximize sensitivity. -
Page 32: Broadband Probe
System Description Broadband Probe One type of a probe, which will be described here as an example, is the 5 mm BBO Smart probe. As its name suggests this probe is designed for users who are interested in analyzing samples of various nuclei. The X-frequency range is typically from N to P including The left BNC is marked... -
Page 33: Iprobe
NMR probes for dedicated applications. The first probes introduced on this platform include the industry-leading SmartProbe iProbes, available now from 400-600 MHz, offering up to 10% increase in sensitivity. Figure 4.8: The Bruker iProbe Platform H171804E_14_001 33 / 86... -
Page 34: Changing A Probe
10. Insert the new probe and secure using the two screws. 11. Reconnect the coaxial cables, thermocouple, heater, cooling lines and any other connections as appropriate. 12. Turn the heater back on. A movie showing this procedure is available on the Bruker website. 34 / 86 H171804E_14_001... -
Page 35: Basic Procedures
Basic Procedures Basic Procedures This chapter will outline basic operations which are used every time a spectrum is acquired. The TopSpin software has an easy to use work flow-based interface which guides a user through all the necessary steps to obtain a spectrum. All operations are software controlled and can be selected with a mouse click on the work flow tabs (see 1. -
Page 36: Creating A New Data Set
Basic Procedures 5.1.1 Creating a New Data Set Regular use of a spectrometer will soon result in the accumulation of large amounts of data. Users will want to store data in conveniently named files so that they can easily access their data later. - Page 37 Basic Procedures • In the Parameter group click Read parameterset and Select to open the rpar window. • Enable Show Recommended to get the list of the most common small molecule experiments. • Ensure that the source directory is: <Topspin>\exp\stan\nmr\par and not: <Topspin>\exp\stan\nmr\par\user •...
-
Page 38: Sample Preparation
RT Probes Old RT Probes Standard 5 mm sample tube with 19 mm 20 mm 18 mm round end. Bruker Shigemi tube. 17 mm 20 mm 18 mm Figure 5.1: Inserting the Sample into the Spinner 1 Sample Center Line 2 Spinner... -
Page 39: Inserting The Sample Plus Spinner Into The Magnet
Basic Procedures Inserting the Sample plus Spinner into the Magnet The raising and lowering of the sample is controlled by a stream of pressurized air. Before placing a sample onto the top of the bore, make sure that the air flow is present (it is quite audible) and remove any sample which may be rising to the top of the bore. -
Page 40: Tuning And Matching The Probe
(and consequently wasted). Note: Bruker offers two different types of tuning and matching adjustments. In addition to the manual adjustments of the tuning and matching capacitors, the probes can be equipped with an Automatic Tuning Module (ATM). -
Page 41: Probes Equipped With Atm Using The Manual Tuning Routine
Basic Procedures 5.4.2 Probes Equipped with ATM Using the Manual Tuning Routine • On the Tune button, click the drop-down arrow to see more options. • In the list, select Tune/match ATM probe manually. Note: The ATMM Probe Tuning/Matching window (figure below) and a window displaying the wobble curve will be opened. - Page 42 Basic Procedures • In the ATMM control window, click the Tuning buttons to move and display the wobble curve centered. • In the ATMM control window, click the Matching buttons to adjust the dip of the wobble curve to the lowest position. It is very convenient to look at the complex wobble display.
-
Page 43: Spinning The Sample
Basic Procedures Figure 5.5: Examples of Wobble Curves with Different Tuning and Matching Bad matching and tuning. Good matching, bad tuning. Bad matching, good tuning. Good matching and tuning. If you want to optimize the probe for several nuclei (e.g. decoupling experiments) you can choose the next nucleus in the ATMM Probe Tuning/Matching Window. -
Page 44: Shimming
Basic Procedures Shimming Shimming is a process in which minor adjustments are made to the magnetic field until the field homogeneity (uniformity) is optimized. Improving the homogeneity will result in better spectral resolution. It will be necessary to re-shim each time a probe or sample is changed. The system manager has stored appropriate shim values (in so called shim files) for each probe that will greatly reduce the shimming time required whenever a probe is changed. -
Page 45: Processing The Data
Basic Procedures 5.10 Processing the Data A Fourier Transformation is used to convert the FID to a frequency spectrum. The number of points used to form the resulting spectrum is determined by the parameter SI (size). The FID is transformed into a spectrum consisting of SI data points in the real part and SI data points in the imaginary part. - Page 46 Basic Procedures 46 / 86 H171804E_14_001...
-
Page 47: Preparing For Acquisition, Frequency Related Parameters
Preparing for Acquisition, Frequency Related Parameters Preparing for Acquisition, Frequency Related Parameters This chapter will explain two of the most important parameters for observing a NMR spectrum. Before assigning values to various parameters, it is important that the user understands the concept of data sets, as groups of parameters are inextricably linked to these. -
Page 48: Numerical Explanation Of Transmitted, Basic And Offset Frequencies
Preparing for Acquisition, Frequency Related Parameters Numerical Explanation of Transmitted, Basic and Offset Frequencies Consider a 600 MHz spectrometer used to observe hydrogen. The spectrometer is configured to have a BF1 of 600.13 MHz (a 500 MHz spectrometer normally has a BF1 of 500.13 MHz, a 400 MHz a BF1 of 400.13 etc.). -
Page 49: Figure 6.2: Spectrum With Bf1 =600.13 Mhz, 01= 8 Khz
Preparing for Acquisition, Frequency Related Parameters Hence if O1, the offset frequency, is set to 8 kHz, the window is shifted to look like that in the figure below. Figure 6.2: Spectrum with BF1 =600.13 MHz, 01= 8 kHz Frequency Finally, it is clear from the figure above that the NMR signals emitted by the protons in our hypothetical sample occupy only part of the spectral width. -
Page 50: Figure 6.4: Interaction Of Sfo1, Bf1 And O1
Preparing for Acquisition, Frequency Related Parameters It should be noted that the value of SWH used in any given experiment is determined only by the sample under analysis and the required spectral resolution. The value of 14 ppm for hydrogen spectra will ensure that most proton signals are detected. However, for a detailed study of a particular signal, much smaller values of SWH are used. -
Page 51: The Nmr Sample
The NMR Sample The NMR Sample When a solid is investigated using the NMR technique, signals tend to be broad and the fine structure, which is of most interest to scientists, cannot be resolved. Consequently, solid samples are usually dissolved in a suitable solvent prior to acquisition. The same goes for liquid samples. -
Page 52: Sample Tube
The NMR Sample Sample Tube When the sample is being analyzed it may be rotated, depending on the type of probe or experiment. Spinning the sample has the effect of cancelling out field inhomogeneities in the X and Y direction and consequently improves the spectral resolution. A disadvantage of spinning is that it may lead to the presence of spinning sidebands. -
Page 53: Sample Handling
The NMR Sample Sample Handling It is good practice to filter NMR solutions directly into the sample tube to keep the solution free from dust and other contamination. Note: The sample tube should always be held by the top! A typical procedure to prepare a sample might be as follows: 1. - Page 54 The NMR Sample 54 / 86 H171804E_14_001...
-
Page 55: Proton Spectrum
Proton Spectrum This chapter describes the acquisition and processing of a one-dimensional 1H NMR spectrum using the standard Bruker parameter set PROTON. The pulse sequence zg30 (see figure below) consists of the recycling delay, the radio-frequency (RF) pulse, and the acquisition time during which the signal is recorded. - Page 56 Proton Spectrum • In the Create New Dataset window, enter or select: NAME = Proton_exp EXPNO = 1 Directory = e.g. C:\Data Directory, NAME and EXPNO define where the new experiment dataset will be stored on the computer: Directory/NAME/EXPNO/ In the example: C:\Data\proton_exp\1 Directory can be selected in the drop-down list, or a new location can be typed in the text field.
- Page 57 Proton Spectrum • Enable Show Recommended to get the list of the most common small molecule experiments. • Ensure that the source directory is <Topspin>\exp\stan\nmr\par and not <Topspin>\exp\stan\nmr\par\user • In the table select PROTON as experiment and click Set selected item in editor. •...
- Page 58 Proton Spectrum Lock the solvent • On the Workflow button bar, click Lock. • In the Solvents table window, select the solvent, e.g. DMSO. Click OK. Tune and match the probe • On the Workflow button bar, click Tune. This performs an atma (automatic tuning and matching) and requires a probe equipped with an automatic tuning module.
-
Page 59: Acquisition
Proton Spectrum Shim the sample • On the Workflow button bar, click Shim. This executes the command topshim. The shimming starts momentarily and should take less then a minute. On the Shim button, click the drop-down arrow to see more options. Load the prosol parameters •... - Page 60 Proton Spectrum • If TMS is added to the sample for referencing, enable Set Spectrum Reference (sref). • In the proc1d window, click Execute and then click Save to save the selected processing settings. Now all future datasets can be processed with the defined actions with a click on Proc Spectrum.
-
Page 61: Integration
Proton Spectrum Integration To quantitatively analyze an observed proton signal, the integrated intensity of the peaks is compared within each other. It is common to integrate a proton spectrum to account for the number of protons in the analyzed molecule. To get more precise quantitative integration results, please refer to the Quantitative NMR manual. - Page 62 Proton Spectrum • Repeat the last step for all peaks of interest. 62 / 86 H171804E_14_001...
-
Page 63: Plotting The 1D Proton Spectra
Proton Spectrum • On the Integration Tool bar, click Return, save region to save the integration regions. Plotting the 1D Proton Spectra • Expand the spectrum to include all peaks. • On the toolbar, click Retain expansion and scale. The spectrum can be printed as it is displayed in the SPECTRUM tab with a click on Print active window The spectrum can also be printed with a predefined layout with a click on Export active data or plot window as PDF... -
Page 64: Optimizing The Sweep Width
Proton Spectrum Optimizing the Sweep Width Optimizing the sweep width will achieve a better resolution and separation of the peaks in the Proton spectrum. • On the toolbar, click Exact Zoom. • Enter the following F1 [ppm] values: From = 4.6 To = 3.6 •... - Page 65 Proton Spectrum • On the toolbar, click Set sw to current region and SFO1 to center of region. • In the New setting of SW window, click Close. • On the Workflow button bar, click Run. • On the menu bar, click Process. •...
- Page 66 Proton Spectrum 66 / 86 H171804E_14_001...
-
Page 67: ¹³C Spectrum With Proton Decoupling
This chapter describes the acquisition and processing of a one-dimensional C NMR spectrum. The standard Bruker parameter set C13CPD includes the pulse sequence zgpg30 shown in the figure below. The C channel consists of the recycling delay, a RF pulse, and the acquisition time during which the signal is recorded. -
Page 68: Experiment Setup
¹³C Spectrum with Proton Decoupling Experiment Setup • On the menu bar, click Acquire | Create Dataset to open the Create New Dataset window. • In the New Dataset window, enter or select: NAME = carbon_exp EXPNO = 1 Directory = e.g. C:\Data •... - Page 69 ¹³C Spectrum with Proton Decoupling • In the list, select Eject sample manually (ej). The sample lift is turned on. Wait until the sample lift air is turned on and remove any sample which may have been in the magnet. •...
-
Page 70: Acquisition
¹³C Spectrum with Proton Decoupling • On the Spin button, click the drop-down arrow to see more options. • In the list, select Turn sample rotation on (ro on). Rotation may be turned off for probes such as BBI, TXI, TBI and for small sample probes. •... - Page 71 ¹³C Spectrum with Proton Decoupling • In the proc1d window, click Execute. • In the proc1d window, click Save to save the selected processing settings. Now all future datasets can be processed with the defined actions with a click on Proc Spectrum.
-
Page 72: Peak Picking
¹³C Spectrum with Proton Decoupling Peak Picking • Expand the spectrum to include all peaks. • On the menu bar, click Analyse. • On the Workflow button bar, click Pick Peaks. • On the Pick Peaks button, click the drop-down arrow to see more options. This enters the manual peak picking mode. -
Page 73: Plotting The 1D Carbon Spectrum
¹³C Spectrum with Proton Decoupling • On the Peak Picking toolbar, click Return, save region to store the peak values. • To display the peak picking labels, right click in the spectrum window and select Spectra Display Preferences. In the Spectrum components enable Peak labels and Peak annotations. - Page 74 ¹³C Spectrum with Proton Decoupling If desired, any changes can be administered with the tools on the left side of the display. • In the left Print section, click the drop-down arrow to see more options. • In the list, select Print. 74 / 86 H171804E_14_001...
-
Page 75: 10 Contact
WEEE DE43181702 NMR Hotlines Contact our NMR service centers. Bruker BioSpin NMR provides dedicated hotlines and service centers, so that our specialists can respond as quickly as possible to all your service requests, applications questions, software or technical needs. Please select the NMR service center or hotline you wish to contact from our list available at: https://www.bruker.com/service/information-communication/helpdesk.html... - Page 76 Contact 76 / 86 H171804E_14_001...
-
Page 77: List Of Figures
Figure 3.14: Ethylbenzene Spectrum with Homodecoupling ............Figure 3.15: Fourier Transformation ....................Figure 4.1: AVANCE NEO Console and Ascend Magnet ............... Figure 4.2: AVANCE NEO Architecture Overview ................Figure 4.3: Photo of Magnet, Shim System, Probe and HPPR............Figure 4.4: Superconducting Magnet.................... - Page 78 List of Figures 78 / 86 H171804E_14_001...
-
Page 79: List Of Tables
List of Tables List of Tables Table 3.1: Table of Data for Various Isotopes (frequencies quoted for an 11.7T magnet) ....Table 3.2: Frequency Variations (quoted for an 11.7 T magnet) ............H171804E_14_001 79 / 86... - Page 80 List of Tables 80 / 86 H171804E_14_001...
-
Page 81: Glossary
Glossary Glossary Aquisition System BSMS The Bruker Smart Magnet Control System (BSMS) provides computer control of various functions associated with magnet, magnetic field, and sample. BSVT Bruker Smart Variable Temperature System chemical shift The variation in precise resonance frequency. deuterated solvent... - Page 82 Glossary 82 / 86 H171804E_14_001...
-
Page 83: Index
HPPR ........... 25, 27, 29 HPPR/2 ............ 27 BASH.............. 24 BF .............. 47 Broadband Impurities ............ 51 coil ............... 31 Integrated intensity ........... 10 Bruker Smart Magnet System ...... 25 Intensity ............ 10 BSMS ............ 25, 26 of a signal ............ 10 Isotopes ............ 11 Isotype Basic resonance frequency ...... 9 Cardiac pacemakers .......... 7 Carrier frequency.......... 10... - Page 84 Index Factors in selecting ........ 51 Solvents Observe coil Solubility ............ 51 l.............. 31 Temperature dependence ...... 51 Observe nucleus .......... 10 Viscosity ............ 51 Operator console ........ 23, 24 Water content .......... 51 Organic solvents.......... 51 Spectral resolution.......... 44 Spinning ............ 52 Spinning sidebands .......... 52 spin-spin coupling the effects of.......... 19 Parafilm ............ 53 Stray fields............ 7 Parameter:SFO1 .......... 10...
- Page 85 H171804E_14_001 85 / 86...
- Page 86 ● Bruker Corporation info@bruker.com www.bruker.com Order No: H171804E...
Need help?
Do you have a question about the AVANCE NEO and is the answer not in the manual?
Questions and answers