
Related Manuals for Bruker QUANTAX EDS


Summary of Contents for Bruker QUANTAX EDS
- Page 1 QUANTAX Energy-dispersive X-ray spectrometer for electron microscopy User Manual...
- Page 2 Suggestions for improvement are welcome. Order no. DOC-M82-EXS066 © 2015 Bruker Nano GmbH, Berlin, Germany. All trademarks and registered trademarks are the sole property of their respective owners. Printed in the Federal Republic of Germany.
-
Page 3: Table Of Contents
2 Safety Information ........................7 2.1 Radiation Safety ......................9 2.2 Beryllium ........................10 2.3 Electrical Safety ......................10 2.4 Electromagnetic Compatibility ................... 11 3 The QUANTAX EDS System ..................... 13 3.1 Hardware System Components ................. 15 3.1.1 XFlash ®... - Page 4 User Manual Contents 5.3 Image Capture ......................55 5.4 Image Extension ......................57 5.5 Drift Correction ......................59 5.6 Image Processing ....................... 61 5.7 Spectrum Acquisition ....................63 5.8 Using the Spectrum Chart ..................65 5.9 Sample Coating Correction ..................68 5.10 System Factor Calibration/ Beam Current Setting ............
-
Page 5: Introduction
In case of necessary maintenance, reinstallation, severe computer breakdown, hardware changes, etc. the Bruker customer support or your local supplier have to be contacted for further assistance and instructions. According to the modular structure of QUANTAX not all parts of this manual may apply in detail to a given installation nor should be taken literally in all cases. -
Page 7: Safety Information
Safety Information 2.1 Radiation Safety ......................9 2.2 Beryllium ........................10 2.3 Electrical Safety ......................10 2.4 Electromagnetic Compatibility ................... 11... - Page 8 User Manual 2 Safety Information...
-
Page 9: Radiation Safety
QUANTAX system - e.g. the X-ray detectors - may be contained in the according manuals. The QUANTAX EDS microanalysis system may only be used in combination with electron microscopes or similar devices. Any other use beyond that is considered non-intended usage. -
Page 10: Beryllium
User Manual 2 Safety Information 2.2 Beryllium Beryllium safety issues apply only to X-ray detectors with beryllium X-ray entrance windows. Low energy windows do not contain toxic substances. Beryllium is highly toxic! Beryllium is toxic if parts are inhaled or swallowed. If a beryllium window is destroyed despite all caution, absolutely all frag- With X-ray detectors, however, this is only possible... -
Page 11: Electromagnetic Compatibility
This disadvantage under normal circumstances because the QUANTAX system works under the same conditions electron microscopes laboratory environment is designed to meet the requirements of these instruments. Bruker devices fulfill all requirements regarding active electromagnetic compatibility (emission rules). -
Page 13: The Quantax Eds System
The QUANTAX EDS System 3.1 Hardware System Components ................. 15 3.2 ESPRIT 2 Software ..................... 18 3.3 General Operating Instructions .................. 19... - Page 14 User Manual 3 The QUANTAX EDS System...
-
Page 15: Hardware System Components
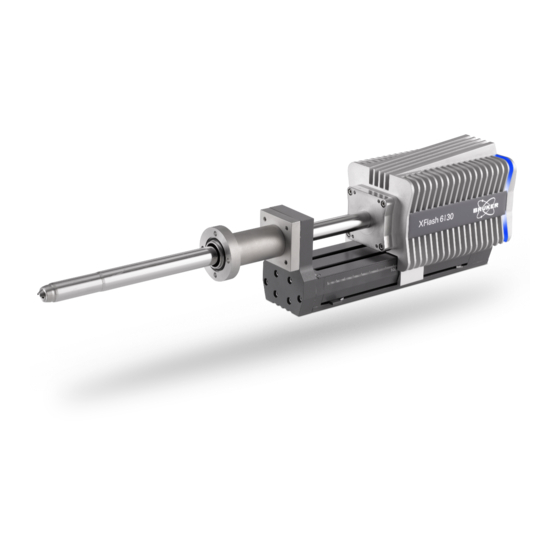
3.1 Hardware System Components QUANTAX EDS 3.1 Hardware System Components Typical QUANTAX EDS system parts System components of QUANTAX comprise the X- ray detector, interface hardware, one or more XFlash ® energy dispersive X-ray computers, and several software modules. All parts... -
Page 16: Spectrometry Data Interface And Em Control
Interface and EM data in real time to the QUANTAX server. The PCI Control plug-in board Bruker IO-Scan can connect up to 4 spectrometers simultaneously. Bruker MegaLink is a serial interface protocol featuring full galvanic isolation for improved noise immunity at connection length of up to 30 m. -
Page 17: Computer Workstations
3.1 Hardware System Components QUANTAX EDS QUANTAX scan system. The PCI plug-in board IO- Scan also contains the necessary hardware for controlling the x/y electron beam deflection as well as two separate digitizers for the image signals of the electron microscope (EM). Position tagged... -
Page 18: Esprit 2 Software
7 with a service pack level specified at ® time of installation. Operating system updates are to be approved by Bruker Nano. Only computers provided or approved by Bruker Nano may be used. Windows administrator rights are required for the ®... -
Page 19: General Operating Instructions
3.3 General Operating Instructions QUANTAX EDS USB Dongle. The QUANTAX dongle for standalone systems (systems without access to a QUANTAX server) fits any USB-port on the regarding PC. A software driver for the dongle must be installed during system installation; the dongle must be present to use the data station. -
Page 20: Electronic Units
User Manual 3 The QUANTAX EDS System Cooling mode. A mode selection for the detector cooling is provided for XFlash detectors. Maximum ® cooling will provide the optimum energy resolution. Thermostat mode will reduce possible changes due to varying environment temperature. Though these... -
Page 21: Software And Data Handling
3.3 General Operating Instructions QUANTAX EDS Backing up data. Even state-of-art, complex and 3.3.3 Software and Data versatile software systems cannot be designed to Handling completely exclude the possibility of damage or impairment by improper operation and/or misuse. Additionally no existing computer system is actually immune against potential hardware or software errors. -
Page 23: The Esprit 2 Software
The ESPRIT 2 Software 4.1 Start-up and Login ...................... 25 4.2 User Administration ....................26 4.3 Workspaces........................ 28 4.4 Display Control ......................29 4.5 Configurator Bar ......................31 4.6 Loading and Saving Data and Results ................ 39 4.7 System Functions ...................... 41 4.8 The Help System ...................... -
Page 25: Start-Up And Login
4.1 Start-up and Login QUANTAX EDS 4.1 Start-up and Login The ESPRIT software runs on the QUANTAX server and the client workstations. However the user only has to start the client application; the server software and communication drivers will start and log in automatically. -
Page 26: User Administration
Fig. 4.2-1 QUANTAX communication server of settings can render the system useless and lead access to severe data loss. New users are to be assigned from the QUANTAX communication server. Double clicking the Bruker icon in the Windows system tray opens the ®... - Page 27 4.2 User Administration QUANTAX EDS Altering user name and password can be done at any time from the QUANTAX communication server (icon in the Windows ® task bar) by clicking QUANTAX user tab. The user data and profile are automatically copied to the new user data structures.
-
Page 28: Workspaces
EDS analysis. Mapping allows the acquisition of maps: intensity maps and HyperMaps (Bruker’s position- tagged spectrometry tool (spectral imaging)). Mapping also includes the chemical phase analysis tool AutoPhase. Fig. 4.3-1 ESPRIT workspace list in normal,... -
Page 29: Display Control
4.4 Display Control QUANTAX EDS EBSD When changing the workspace gives access to the fully integrated EBSD during an active measurement, a (electron backscattered diffraction) analysis confirmation dialog box pops up and after clicking OK the current package. Refer to the QUANTAX EBSD User measurement will be terminated. - Page 30 User Manual 4 The ESPRIT 2 Software To scale individual parts of the program window the splitter (dark grey lines) between different screen areas on the ESPRIT interface can be dragged (a changing mouse cursor indicates availability of this option). Full screen / dual screen mode.
-
Page 31: Configurator Bar
4.5 Configurator Bar QUANTAX EDS Using the triangles at the control buttons opens drop-down menus to enter acquisition and analysis options. Diagram axis labels and column titles can be selected with Data lists and thumbnail images will be highlighted by clicking onto them. Multiple items can be selected by using the SHIFT or CTRL key to perform batch processing. -
Page 32: Sample Configuration
User Manual 4 The ESPRIT 2 Software Use the downward-facing arrow in the left bottom corner of a configurator ( icon, depending on the display mode) to access the corresponding configuration dialog. The Sample configurator is used to display and 4.5.1 Sample Configuration manage information... -
Page 33: Microscope Configuration
4.5 Configurator Bar QUANTAX EDS activated. The configurator displays the following information about the system and the standards library: Number of standards in the standards library Calibration date (of the system factor) Calibration time (of the system factor) ... -
Page 34: Scan Configuration
User Manual 4 The ESPRIT 2 Software checked to maintain communication between the microscope and the ESPRIT software, otherwise relevant microscope parameters for image scaling and quantitative analysis will not be transferred to ESPRIT. The communication is set up during installation and automatically enabled after starting ESPRIT. - Page 35 4.5 Configurator Bar QUANTAX EDS desired detector can be selected here. For each channel only one image detector can be selected at a time. If only Ch1 and Ch2 can be selected from the dropdown menu, note that the image channel names can be changed in the System workspace under Microscope to e.g.
-
Page 36: Eds Configuration
User Manual 4 The ESPRIT 2 Software counter inputs for TTL impulse signals. Detailed information is given in the IO scan reference manual. EDS configurator displays measuring 4.5.5 EDS Configuration parameters of the available EDS detector(s). Pulse rate (input count rate) ... -
Page 37: Additional Configurators
4.5 Configurator Bar QUANTAX EDS Cooling mode. The XFlash detectors can be ® operated in Thermostat mode, where the Peltier cooling operates at constant temperature (default setting) or in Maximum cooling mode, where the Peltier cooling operates at full power. -
Page 38: Report
User Manual 4 The ESPRIT 2 Software WD spectrometer. If a WD spectrometer is attached to the system, it can be configured under the WDS detector configurator. For details see the QUANTAX WDS User Manual and the XSense Reference Manual. EBSD detector. -
Page 39: Loading And Saving Data And Results
4.6 Loading and Saving Data and Results QUANTAX EDS 4.6 Loading and Saving Data and Results Loading and saving data or adding to project or report can be done in two different ways: using the Import/ Export function ( icon) or with a right mouse click into the data field. - Page 40 User Manual 4 The ESPRIT 2 Software workspace or to the Report. Other data types including result tables and free texts can be imported to the Report or to the current Project. Multiple spectra can be selected for loading by holding the SHIFT or CTRL key when clicking onto the file list.
-
Page 41: System Functions
4.7.1 System user license administration, and control of the spectrometer settings. All items in this section are generally only of interests to Bruker service personnel. Unless explicitly requested, please do not alter any parameters within the system assignments. System report. This area lists all relevant system settings. - Page 42 The assignment is completely automatic. Each detector to be assigned must be connected to either Bruker MegaLink port, a RS232 port, an USB port or via Ethernet of the QUANTAX server and powered on when the button is clicked.
-
Page 43: Appearance
4.7 System Functions QUANTAX EDS 4.7.2 Appearance tab allows the user to configure settings related to the display of the ESPRIT software. The subsection allows the user to Languages change the display language. Select a language and confirm by clicking... -
Page 44: Spectrometer
Calibration report. The calibration report lists all relevant calibration settings of the QUANTAX The calibration timing schedule system. If requested, please provide this document should be adjusted to the laboratory regulations or practice and to the Bruker service personnel. constraints defined by the application. -
Page 45: Imaging
Image input. communications between ESPRIT software and the EM. The settings here are microscope dependent and should only be modified by Bruker service personnel. Image calibration. image calibration performed to calibrate the pixel values within the ESPRIT software. It is possible to calibrate based on... - Page 46 User Manual 4 The ESPRIT 2 Software Fig. 4.7-7 Stage calibration Once all images have been acquired, fine tune the overlap in the X/Y directions or the rotation and press ENTER on the keyboard. The correction in X will only change the overlap in the X-direction, the same applies to Y.
-
Page 47: Wds
(e.g., SE, BSE, HAADF,…). It is not controlled via CONFIGURATION dialog. To enable advised for users to modify the other settings in this the microscope data transfer, the section unless explicitly advised by Bruker Service Communication active checkbox personnel. must be ticked. 4.7.7 Stage To verify the stage limits, select the tab. -
Page 49: Step-By-Step Guides
Step-by-Step Guides 5.1 Preparatory Steps ....................... 51 5.2 Energy-Channel Calibration ..................53 5.3 Image Capture ......................55 5.4 Image Extension ......................57 5.5 Drift Correction ......................59 5.6 Image Processing ....................... 61 5.7 Spectrum Acquisition ....................63 5.8 Using the Spectrum Chart ..................65 5.9 Sample Coating Correction .................. - Page 50 User Manual 5 Step-by-Step Guides...
-
Page 51: Preparatory Steps
QUANTAX EDS This chapter gives the analyst an overview of the most important tools of the ESPRIT software, permitting a quick start to perform analyses with the QUANTAX EDS system. The procedures described here assume standard (default) ESPRIT settings. They also refer to the use of a scanning electron microscope (SEM) or a scanning transmission electron microscope (STEM) or similar. - Page 52 User Manual 5 Step-by-Step Guides Fig. 5.1-1 Preparatory steps for measurements with the ESPRIT software...
-
Page 53: Energy-Channel Calibration
5.2 Energy-Channel Calibration QUANTAX EDS 5.2 Energy-Channel Calibration Correct energy-channel calibration is a prerequisite for reliable qualitative and quantitative analysis results. Calibration should be checked on a regular basis or after re-start of the signal processing unit (SVE). Step Examples/hints... - Page 54 User Manual 5 Step-by-Step Guides Fig. 5.2-1 Spectrometer calibration...
-
Page 55: Image Capture
5.3 Image Capture QUANTAX EDS 5.3 Image Capture This section describes how to capture electron microscope images with the ESPRIT software. Step Example/hints 1 Select a workspace (Objects, Line scan, These workspaces allow capturing an EM image. or Imaging). Mapping,... - Page 56 User Manual 5 Step-by-Step Guides Fig. 5.3-1 Image capture...
-
Page 57: Image Extension
5.4 Image Extension QUANTAX EDS 5.4 Image Extension This section describes the automatic capturing of multiple microscope images using sample stage movement. The images are put together into a mosaic image instantly. Step Example/hints 1 Select a workspace (Objects, Line scan, These workspaces allow capturing an EM image. - Page 58 User Manual 5 Step-by-Step Guides Fig. 5.4-1 Image extension...
-
Page 59: Drift Correction
5.5 Drift Correction QUANTAX EDS 5.5 Drift Correction The drift correction tool compensates sample drift when performing long and/or high-resolution acquisitions. Step Example/hints 1 Select a workspace (Objects, Line scan, These workspaces allow capturing an EM image and beam control. - Page 60 User Manual 5 Step-by-Step Guides Fig. 5.5-1 Image drift correction...
-
Page 61: Image Processing
5.6 Image Processing QUANTAX EDS 5.6 Image Processing This section describes the workflow for the imaging workspace. Step Example/hints 1 Select the workspace. Refer to section 5.3. Alternatively, load a an image. saved image by using the workspace icon of the... - Page 62 User Manual 5 Step-by-Step Guides Fig. 5.6-1 Image processing...
-
Page 63: Spectrum Acquisition
5.7 Spectrum Acquisition QUANTAX EDS 5.7 Spectrum Acquisition This section describes the workflow for spectrum acquisition within the Spectra workspace. It is recommended to acquire a preview spectrum before proceeding with analysis in various workspaces. Step Examples/hints Choose appropriate measurement Refer to the previous sections 5.1, 5.2, and... - Page 64 User Manual 5 Step-by-Step Guides The acquired spectrum appears in the a spectrum. spectrum chart and the quantification results in the spectrum list (refer to section 5.8). The spectrum can be further processed (element identification, quantification). 6 Use the workspace icon to data to project...
-
Page 65: Using The Spectrum Chart
5.8 Using the Spectrum Chart QUANTAX EDS 5.8 Using the Spectrum Chart This section describes the features of the Spectrum chart, available in the Spectra, Objects, Line scan, and Mapping workspaces. The assigned numbers do not indicate that a certain order needs to be followed. - Page 66 User Manual 5 Step-by-Step Guides 4e Use the icon for Automatic scaling (spectrum fills display area) Set a rectangle by holding the left mouse key 4f Use the icon to zoom in the to zoom into the area of interest. spectrum window.
- Page 67 5.8 Using the Spectrum Chart QUANTAX EDS Fig. 5.8-1 Features in the spectrum chart...
-
Page 68: Sample Coating Correction
User Manual 5 Step-by-Step Guides 5.9 Sample Coating Correction This section describes how to use sample coating correction in two ways: 1. Set an element (e.g. carbon) as coating material and omit the net counts originating from it. 2. Measure a reference coating spectrum and subtract this from measured spectra. Step Example/hints Set an element (e.g. - Page 69 5.9 Sample Coating Correction QUANTAX EDS Fig. 5.9-1 Sample coating correction – Step 1 to 8 Fig. 5.9-2 Sample coating correction – Step 9 to 11...
-
Page 70: System Factor Calibration/ Beam Current Setting
User Manual 5 Step-by-Step Guides 5.10 System Factor Calibration/ Beam Current Setting For standard-based quantification, a probe current-dependent system factor has to be determined. There are two ways to proceed depending on sample type and whether a picoamperemeter / beam current monitor is available or not. The system factor value is stored in the ESPRIT software and saved along with the following measurements until the software is closed. - Page 71 5.10 System Factor Calibration/ Beam Current Setting QUANTAX EDS Fig. 5.10-1 System factor calibration Beam Current Setting Use this guide for electron transparent samples and for bulk samples when a picoamperemeter / beam current monitor is available to measure the beam current.
- Page 72 User Manual 5 Step-by-Step Guides Fig. 5.10-2 Beam current setting...
-
Page 73: Standards Library
5.11 Standards Library QUANTAX EDS 5.11 Standards Library 5.11.1 Maintain Standards Library for Bulk Samples This guide describes how to create and maintain a standards library for the standard-based quantification of bulk samples. Step Example/hints Create/open a standards library See Fig. 5.11-1. - Page 74 User Manual 5 Step-by-Step Guides 7 Add reference concentrations and click 8 Close quantification dialog with Repeat step 4 to 8 until all standard samples are processed. Edit existing standard values See Fig. 5.11-1. 9 Click the icon in the bottom left corner of the Standards configurator open the...
- Page 75 5.11 Standards Library QUANTAX EDS Fig. 5.11-2 Quantification dialog...
-
Page 76: Maintain Standards Library For Electron Transparent Samples - Cliff-Lorimer Factors
Bruker service. If the geometry parameters do not match, proceed with step 3. If they match, proceed with quantification as described in section 5.13.1 or 5.13.2. 3 Use the... - Page 77 5.11 Standards Library QUANTAX EDS 6* Click on a Cliff-Lorimer value to edit it It is advised to calculate theoretical factors or set standards as described in section 5.13.2. manually. Save the standards library (containing Cliff- 7 Use the standards library icon to Lorimer factors) as .esl file.
-
Page 78: Maintain Standards Library For Electron Transparent Samples - Zeta Factors
User Manual 5 Step-by-Step Guides 5.11.3 Maintain Standards Library for Electron Transparent Samples – Zeta Factors This guide describes how to set up the Zeta factor standards library. Quantification of electron transparent samples with the Zeta factor method requires knowledge of the beam current in [pA] for standard and “unknown”... - Page 79 5.11 Standards Library QUANTAX EDS The updated Zeta factors for elements 8 Click to close the VALIDATION contained in the reference sample will be dialog. marked red in the Zeta factor list. NOTE: Save the updated standards library. If the “unknown” sample contains other...
- Page 80 User Manual 5 Step-by-Step Guides 4* Click on a Zeta-factor value to edit it * It is advised to proceed with step 5. manually. A polynomial is fitted on the standard 5 Click to perform a elements Zeta factors. Zeta factors for polynomial fit based on the already elements not contained in the standard existing standard composition values.
-
Page 81: Quantitative Eds Analysis Of Bulk Samples
5.12 Quantitative EDS Analysis of Bulk Samples QUANTAX EDS 5.12 Quantitative EDS Analysis of Bulk Samples 5.12.1 Using the Method Editor This section describes how to use the Method editor and how to set up a quantification method for the automatic quantification of multiple spectra. Setting up a quantification method is also important to turn a HyperMap into a QMap (see section 5.18). - Page 82 User Manual 5 Step-by-Step Guides a) Use to generate an automatic background fit b) Activate and drag with right Deactivate the button to use spectrum mouse key in the spectrum diagram to diagram for Element finder (see step 8) set a background fit area manually. 7 Select the Deconvolution settings Series fit...
-
Page 83: Standardless Quantification
5.12 Quantitative EDS Analysis of Bulk Samples QUANTAX EDS 5.12.2 Standardless Quantification This section describes the steps of automatic standardless quantification and quantification using the quantification dialog. Step Examples/hints 1 Select the This workflow also applies to any spectrum chart available in the ESPRIT software. - Page 84 User Manual 5 Step-by-Step Guides 9 The displays non- Use this list to change or review element Element overview list parameters. default settings for selected elements. 10 Use Background settings to set background fit areas and fit model a) Use to generate an automatic background fit Deactivate Add button to use spectrum...
- Page 85 5.12 Quantitative EDS Analysis of Bulk Samples QUANTAX EDS Fig. 5.12-2 Automatic standardless quantification...
-
Page 86: Standard-Based Quantification With A Temporary Reference
User Manual 5 Step-by-Step Guides 5.12.3 Standard-based Quantification with a Temporary Reference This guide describes how to perform standard-based quantification without calibration of system factor, measuring reference and unknown samples with same microscope/beam conditions. Step Example/hints 1 Prepare an “unknown” sample, “Unknown”... - Page 87 5.12 Quantitative EDS Analysis of Bulk Samples QUANTAX EDS Load a standard-based quantification method 15 Click on the button and e.g. Linemarker Standards.mtdx. select Load… Alternatively, open the Method editor and select under Use standards Quantification model. …unless automatic quantification during or 16 Click after acquisition is enabled.
-
Page 88: Standard-Based Quantification With Standards Library
User Manual 5 Step-by-Step Guides 5.12.4 Standard-based Quantification with Standards Library Standard-based quantification using a standards library allows the measurement of standard and unknown samples at different times using beam current dependent system factor. Step Example/hints Follow section 5.11.1 to measure standard 1 Click the icon in the bottom left samples and update the standards library. - Page 89 5.12 Quantitative EDS Analysis of Bulk Samples QUANTAX EDS Fig. 5.12-4 Standard-based quantification with a standards library...
-
Page 90: Quantitative Eds Of Electron Transparent Samples
User Manual 5 Step-by-Step Guides 5.13 Quantitative EDS of Electron Transparent Samples 5.13.1 Standardless Cliff-Lorimer Quantification This guide describes the steps of standardless quantification of electron transparent samples. Step Example/hints 1 Load or create a standards library Follow section 5.11.2. containing theoretical Cliff-Lorimer factors. - Page 91 5.13 Quantitative EDS of Electron Transparent Samples QUANTAX EDS Save the modified quantification method for 9 Use the icon of the result table to further use. Use on the Copy, Save Add to Project Add to button or the button in the report.
-
Page 92: Standard-Based Cliff-Lorimer Quantification
User Manual 5 Step-by-Step Guides 5.13.2 Standard-based Cliff-Lorimer Quantification This guide describes the Cliff-Lorimer quantification of electron-transparent samples using standard samples. Step Example/hints 1 Load or create a standards library Follow section 5.11.2. containing theoretical Cliff-Lorimer factors. Acquire or open a spectrum of the 2 Select the reference/standard sample. - Page 93 5.13 Quantitative EDS of Electron Transparent Samples QUANTAX EDS Fig. 5.13-2 Standard-based Cliff-Lorimer quantification...
-
Page 94: Standard-Based Zeta Quantification
User Manual 5 Step-by-Step Guides 5.13.3 Standard-based Zeta Quantification This section describes how to perform standard-based quantification of electron transparent samples using beam current and thickness of standard sample as reference values. Step Example/hints 1 Click the Standards configurator’s calibration icon to open the SYSTEM FACTOR CALIBRATION dialog. - Page 95 5.13 Quantitative EDS of Electron Transparent Samples QUANTAX EDS Fig. 5.13-3 Standard-based Zeta quantification...
-
Page 96: Object Analysis
User Manual 5 Step-by-Step Guides 5.14 Object Analysis This section describes the steps of user-defined area analysis with image capture using the Objects workspace. Step Example/hints 1 Select the workspace. Refer to section 5.3. an image. 3 Select the desired object type. Objects types are point, rectangle, ellipse, and polygon or a grid of points (optional grid, random, both). - Page 97 5.14 Object Analysis QUANTAX EDS Fig. 5.14-1 Object analysis...
-
Page 98: Line Scan
User Manual 5 Step-by-Step Guides 5.15 Line Scan This section describes the steps of line scan analysis using the Line scan workspace. Step Example/hints 1 Select the workspace. Refer to section 5.3. an image. 3 Highlight the line and drag and adjust the endpoints to the desired position. - Page 99 5.15 Line Scan QUANTAX EDS 11 Use the Profiles icon to Save data Save the composite element profile as .bmp, .jpg, .png, .tif file format including Composite element profile, Scan image or both. data to project Alternatively, right click into the profile and use the local menu.
-
Page 100: Quantitative Line Scan (Qline)
User Manual 5 Step-by-Step Guides 5.16 Quantitative Line Scan (QLine) This section describes how to quantify a line scan. Step Example/hints 1 Select the workspace. See section 5.15. a line scan or a stored line scan file (.rtl) from the Load workspace menu, or... - Page 101 5.16 Quantitative Line Scan (QLine) QUANTAX EDS Highlight elements in profile thumbnails. 8 Use the thumbnail bar icon to Select Individual element profiles to add Line scan to report. separate profiles for each element. Select to show all Composite element profile selected elements in one diagram.
-
Page 102: Map Acquisition
User Manual 5 Step-by-Step Guides 5.17 Map Acquisition This section describes the acquisition of maps using the Mapping workspace. Maps can be saved as element distribution images or datacube (HyperMap data)*. Step Example/hints Use high count rate for good count statistics. 1 Select the workspace. - Page 103 5.17 Map Acquisition QUANTAX EDS 10 Use the thumbnail bar icon to Save Images Individual element images of selected thumbnails will be saved. To select them mark the individual element images with left mouse-click + SHIFT or CRTL key. images...
-
Page 104: Quantitative Mapping (Qmap)
User Manual 5 Step-by-Step Guides 5.18 Quantitative Mapping (QMap) This section describes the quantification of mappings. Step Example/hints 1 Select the workspace. Good spectrum statistics may improve the 2 a) a map or quantification accuracy. b) open a .bcf file. Use a previously optimized method 3 Click on the... - Page 105 5.18 Quantitative Mapping (QMap) QUANTAX EDS 12 Use the thumbnail bar icon to Save Images Individual element images of selected thumbnails will be saved. images to project Composite and individual element images will be added to the Project. images to report.
-
Page 106: Map Processing
User Manual 5 Step-by-Step Guides 5.19 Map Processing This section describes the online and offline processing of HyperMap data (datacube/.bcf files*). Step Example/hints 1 Select the workspace. Select elements by clicking on the Auto ID 2 Use the icon to open the periodic use the Finder in the Spectrum tab. - Page 107 5.19 Map Processing QUANTAX EDS 8 Select the tab to see element Choose and displayed Chart Color settings, Mode Elements in the below the correlations or element histogram. Chart settings Chart diagram. Make sure to have good count statistics in the map.
- Page 108 User Manual 5 Step-by-Step Guides Fig. 5.19-1 Map processing...
-
Page 109: Phase Analysis
5.20 Phase Analysis QUANTAX EDS 5.20 Phase Analysis The AutoPhase tool calculates images that reveal the local distribution of different phases in a sample. Step Example/hints Refer to section 5.17. Phase analyses can be 1 Select the workspace and performed on qualitative and quantitative acquire a map or open a bcf. - Page 110 User Manual 5 Step-by-Step Guides Sensitivity Represents how similar (high sensitivity) or different (low sensitivity) the chemical compositions of the distinguished phases area. Area Represents the minimum size of a phase, ranging from 0 to 1 area % of the map image. iii.
- Page 111 5.20 Phase Analysis QUANTAX EDS Fig. 5.20-1 Performing phase analysis...
-
Page 112: Creating A Report
User Manual 5 Step-by-Step Guides 5.21 Creating a Report This section describes how to create a report based on the data obtained or processed in all workspaces of QUANTAX ESPRIT. Step Example/hints 1 Select a workspace and perform an Reports can also be composed from files or project entries. - Page 113 5.21 Creating a Report QUANTAX EDS Fig. 5.21-1 Creating a report...
-
Page 114: Managing Projects
User Manual 5 Step-by-Step Guides 5.22 Managing Projects This section describes how to use Project to manage and archive data obtained or processed by ESPRIT. Use Project as a data clipboard to transfer data between the workspaces or save all data added to Project as one file to disk. - Page 115 5.22 Managing Projects QUANTAX EDS Please note: Items in the project are not automatically saved to the hard disk! Save the project file manually to archive your data. Do not use Project to store HyperMap data. The current map display can be added to the project, but not the HyperMap data (point spectra).
-
Page 117: Index
Index QUANTAX EDS Index Transfer of SEM- ..........17 Datacube ..........102, 106 Dead time ............16 Access rights ............21 Delete Administrator rights ..........18 User ............... 27 Analysis Detector Line scan ............98 Broken window ........10, 20 Map .............. - Page 118 Area ..............30 Timing ............34 Imaging .............. 28 Import/Export menu ........... 39 Quantification IO-Scan, Bruker- ..........18 Bulk samples- ........83, 86, 88 Electron transparent samples- ... 90, 92, 94 Standard-based- ........86, 88 Standard-based Cliff-Lorimer- ......92 Jobs ..............29 Standard-based Zeta- ........
- Page 119 Index QUANTAX EDS Coating ............32 System Factor Calibration ........70 Coating correction .......... 68 Configuration ..........32 Stress ............. 34 Tilt ..............33 Thermostat mode (detector setting) .... 20, 36 Save Twain export ............39 Image ............. 39 Spectrum ............39 Scan Configuration ..........
Need help?
Do you have a question about the QUANTAX EDS and is the answer not in the manual?
Questions and answers