Table of Contents
Advertisement
Quick Links
Advertisement
Chapters
Table of Contents

Related Manuals for Anritsu MS9740B


Summary of Contents for Anritsu MS9740B
- Page 1 MS9740B Optical Spectrum Analyzer Operation Manual Fourth Edition For safety and warning information, please read this manual before attempting to use the equipment. Keep this manual with the equipment. ANRITSU CORPORATION Document No.: M-W3998AE-4.0...
- Page 2 Ensure that you clearly understand the meanings of the symbols BEFORE using the equipment. Some or all of the following symbols may be used on all Anritsu equipment. In addition, there may be other labels attached to products that are not shown in the diagrams in this manual.
-
Page 3: For Safety
For Safety DANGER Replacing Battery ● When replacing the battery, use the specified battery and insert it with the correct polarity. If the wrong battery is used, or if the battery is inserted with reversed polarity, there is a risk of explosion causing severe injury or death. - Page 4 Calibration ● The performance-guarantee seal verifies the integrity of the equipment. To ensure the continued integrity of the equipment, only Anritsu service personnel, or service personnel of an Anritsu sales representative, should break this seal to repair or calibrate the equipment. Be careful not to break the seal by opening the equipment or unit covers.
- Page 5 For Safety WARNING ● This equipment uses a Liquid Crystal Display (LCD). DO NOT subject the equipment to excessive force or drop it. If the LCD is subjected to strong mechanical shock, it may break and liquid may leak. This liquid is very caustic and poisonous. DO NOT touch it, ingest it, or get in your eyes.
- Page 6 For Safety CAUTION Cleaning ● Always remove the main power cable from the power outlet before cleaning dust around the power supply and fan. Clean the power inlet regularly. If dust accumulates around the power pins, there is a risk of fire. Keep the cooling fan clean so that the ventilation holes are not obstructed.
- Page 7 MS9740B-002 1530-1570 11.5 (option) *: Indicates the possible optical output power when each and every reasonably foreseeable single-fault condition is included. Table 2 Specifications of Laser Built into MS9740B Max. Optical Pulse Width (s)/ Emitted Beam Divergence Model Name Output Power (mW)
- Page 8 For Safety Table 4 Labels on Product Type Label Affixed to: Model Name MS9740B + Explanation Figure 1, A MS9740B-002 (option) MS9740B + Certification Figure 1, B MS9740B-002 (option) MS9740B + Identification Figure 1, C MS9740B-002 (option) Laser Radiation Markings...
- Page 9 Back-up Battery backup the memory. This battery must be replaced by service personnel when it has reached the end of its useful life; contact the Anritsu sales section or your nearest representative. Note: The battery used in this equipment has a maximum useful life of 4 years.
- Page 10 For Safety CAUTION Exposure to corrosive gases such as hydrogen sulfide, sulfurous acid, Use in Corrosive and hydrogen chloride will cause faults and failures. Atmospheres Note that some organic solvents release corrosive gases.
- Page 11 In addition, this warranty is valid only for the original equipment purchaser. It is not transferable if the equipment is resold. Anritsu Corporation shall assume no liability for damage or financial loss of the customer due to the use of or a failure to use this equipment, unless the damage or loss is caused due to Anritsu Corporation’s intentional or gross...
- Page 12 Anritsu Corporation Contact In the event of this equipment malfunctions, please contact an Anritsu Service and Sales office. Contact information can be found on the last page of the printed version of this manual, and is available in a separate file on the...
- Page 13 Notes On Export Management This product and its manuals may require an Export License/Approval by the Government of the product's country of origin for re-export from your country. Before re-exporting the product or manuals, please contact us to confirm whether they are export-controlled items or not. When you dispose of export-controlled items, the products/manuals need to be broken/shredded so as not to be unlawfully used for military purpose.
- Page 14 2012/19/EU (the “WEEE Directive”) in European Union. For Products placed on the EU market after August 13, 2005, please contact your local Anritsu representative at the end of the product's useful life to arrange disposal in accordance with your initial contract and the local law.
- Page 15 Anritsu electronic equipment, etc.). By using this Software, you shall be deemed to have agreed to be bound by the terms of this EULA, and Anritsu Corporation (hereafter Anritsu) hereby grants you the right to use this Software with the Anritsu specified equipment (hereafter Equipment) for the purposes set out in this EULA.
- Page 16 US embargoed countries or (b) to anyone financial or otherwise, due to your violation restricted by the Japanese export control of the terms of this EULA, Anritsu shall have regulations, or the US Treasury the right to seek proportional damages from Department's list of Specially Designated you.
- Page 17 Cautions Against Computer Virus Infection ● Copying files and data Only files that have been provided directly from Anritsu or generated using Anritsu equipment should be copied to the instrument. All other required files should be transferred by means of USB flash drive or CompactFlash media after undergoing a thorough virus check.
- Page 18 CE Conformity Marking Anritsu affixes the CE conformity marking on the following product in accordance with the Decision 768/2008/EC to indicate that it conforms to the EMC, LVD, and RoHS directive of the European Union (EU). CE marking 1. Product Model...
- Page 19 Directive 2011/65/EU as amended by (EU) 2015/863. (Pb,Cd,Cr6+,Hg,PBB,PBDE,DEHP,BBP,DBP,DIBP) If the third digit of the serial number is "6", the product complies with Directive 2011/65/EU. (Pb,Cd,Cr6+,Hg,PBB,PBDE) Third digit Serial number example 4. Contact Name: Anritsu GmbH Address, city: Nemetschek Haus, Konrad-Zuse-Platz 1 81829 München, Country: Germany...
- Page 20 UKCA Marking Anritsu affixes the UKCA marking on the following product in accordance with the guidance to indicate that it conforms to the EMC, LVD, and RoHS regulations in the United Kingdom. UKCA marking 1. Product Model Model: MS9740B Optical Spectrum Analyzer 2.
- Page 21 RCM Conformity Marking Anritsu affixes the RCM mark on the following product in accordance with the regulation to indicate that it conforms to the EMC framework of Australia/New Zealand. RCM marking 1. Product Model Model: MS9740B Optical Spectrum Analyzer 2. Applied Standards...
- Page 22 About Eco label The label shown on the left is attached to Anritsu products meeting our environmental standards. Details about this label and the environmental standards are available on the Anritsu website at https://www.anritsu.com xxii...
-
Page 23: About This Manual
MS9740B Optical Spectrum Analyzer (hereafter, MS9740B). For remote control of the MS9740B Optical Spectrum Analyzer via a PC, refer to the MS9740B Optical Spectrum Analyzer Remote Control Operation Manual (W3999AE). - Page 24 Manual Notation System The MS9740B Optical Spectrum Analyzer is abbreviated MS9740B in this manual. The names of panel and function keys are in bold. Example: Center, f1 λMkr A:...
-
Page 25: Table Of Contents
Table of Contents For Safety ............iii About This Manual ..........I Outline ..........1-1 Introduction of Optical Spectrum Analyzer ....1-2 Intended Use .............. 1-6 Glossary ..............1-7 Before Use ......... 2-1 Unpacking and Installation .......... 2-2 Part Names ..............2-5 Power Connection ............ - Page 26 3.10 Releasing Panel Lock ..........3-28 Changing Measurement Conditions........4-1 Wavelength-related Settings ........4-2 Setting Level Display........... 4-5 Changing Data Capturing Method ....... 4-7 Displaying Level Peaks and Dips ......4-11 Analyzing Waveform ..........4-13 Changing Waveform Memory Settings and Calculation between Memories ............
- Page 27 Performance Test ............7-3 Replacement of Optical Connector ......7-8 Optical Connector/Optical Adapter Cleaning ....7-10 Daily Maintenance ............ 7-14 Cautions on Storage MS9740B for Extended Period . 7-15 Transporting and Disposal ........7-16 Troubleshooting ............7-17 Appendix A Specifications ....... A-1 Appendix B Initial Values .........
-
Page 29: Outline
Chapter 1 Outline This chapter introduces the optical spectrum analyzer, explains its intended use, and lists technical terms and abbreviations. Introduction of Optical Spectrum Analyzer ....1-2 1.1.1 Description of Optical Spectrum Analyzer ..1-2 1.1.2 Feature ............1-4 Intended Use .............. 1-6 Glossary .............. -
Page 30: Introduction Of Optical Spectrum Analyzer
Chapter 1 Outline 1.1 Introduction of Optical Spectrum Analyzer 1.1.1 Description of Optical Spectrum Analyzer The MS9740B Optical Spectrum Analyzer (hereafter, MS9740B) measures the power distribution (spectrum) of optical wavelengths. Figure 1.1.1-1 shows a measurement example. Figure 1.1.1-1 Measurement Example of Optical Spectrum Analyzer The horizontal axis indicates the wavelength only. - Page 31 Introduction of Optical Spectrum Analyzer The scale unit is as follows. Horizontal axis Wavelength nm (nanometer) 1 nm = 10 Frequency THz (terahertz) 1 THz = 10 Vertical axis Linear scale, W (watt), normal value mW (milliwatt) 1 mW = 10 state µW (microwatt) 1 µW = 10 nW (nanowatt)
-
Page 32: Feature
MS9740B allows setting VBW at 1kHz Fast and at 200 Hz Fast that enable faster sweeps than those by the existing MS9740A. The adoption of Windows improved the data management and interface convenience of MS9740B. - Page 33 Introduction of Optical Spectrum Analyzer Table 1.1.2-1 Abundant Features Item Function References Trace Displays up to 10 waveform traces and Refer to 4.6 “Changing calculates between waveforms Waveform Memory Max. Hold, Min. Hold functions Settings and Calculation between Memories”. Device Analysis Wavelength analysis and evaluation of optical Refer to Chapter 5 elements (DFB-LD, FP-LD, LED, LD)
-
Page 34: Intended Use
This is achieved by measuring the optical spectrum in the optical circuit. The MS9740B has the functions and performance needed to make parts evaluation, WDM communication, and etc. For a detailed explanation of these measurements, refer to Chapter 5 “Measurement Functions”. -
Page 35: Glossary
Sweep Speed Time Sweep time is the time required to start measurement and write the results to the screen. The sweep time of the MS9740B depends on the measurement conditions such as the Rx bandwidth, number of averaging as well as on the waveform shape. - Page 36 Chapter 1 Outline Figure 1.3-1 Example of Measurement at VBW 1 MHz Figure 1.3-2 Example of Measurement at VBW 10kHz...
- Page 37 Glossary Figure 1.3-3 Example of Measurement at VBW 100Hz When measuring intense modulated light using an external trigger, set the value of VBW to a higher value than the modulation signal. If the VBW value is lower than the modulation frequency, the level is not measured accurately.
- Page 38 Chapter 1 Outline Dynamic Range Near the wavelengths of input lights, the detectable level is limited by the effect of the lights. Dynamic range is the ratio between the maximum level of this input optical spectrum and the detectable optical level. Figure 1.3-4 shows the definition of dynamic range.
- Page 39 MS9740B and dividing by the peak level. The values used in the calculation are the defaults values at factory shipment or the values measured by executing resolution calibration.
- Page 40 Figure 1.3-7 Measurement Example of Resolution 1.0 nm Remote Control This is a function for sending commands from a PC to the MS9740B via the Ethernet or GPIB (Option) interface to change the measurement conditions and to send the measurement results from the MS9740B to the MS9740B Optical Spectrum Analyzer Remote Control PC.
- Page 41 Glossary The abbreviations used in this manual and on the analyzer panels and screens are listed in Table 1.3-1. Table 1.3-1 Abbreviations Abbreviation Formal Name Act-Res Actual Resolution Align Alignment Amplifier Angled Physical Contact Amplified Spontaneous Emission Attenuator Average Band Pass Filter Back Space Band Width Calibration...
- Page 42 Chapter 1 Outline Table 1.3-1 Abbreviation (Cont'd) Abbreviation Formal Name LMker Level Marker Logarithm Maximum Minimum Marker Mode Cpl Mode Coupling Noise Figure Number Optical OSNR Optical Signal to Noise Ratio Overlap Physical Contact Peak PLZN Polarization Polarization Mode Dispersion Polarizer POLY Polynomial equation...
-
Page 43: Before Use
Before Use This chapter describes the procedures from how to unpack the package through how to turn on the power, basic information about parameter and screen names, and function configurations. Unpacking and Installation .......... 2-2 2.1.1 Unpacking ............2-2 2.1.2 Installation............2-3 Part Names .............. -
Page 44: Unpacking And Installation
The CD includes two MS9740B Optical Spectrum Analyzer Operation Manuals: Mainframe and Remote Control. Options for the MS9740B listed in Table 2.1.1-2 are provided. Select one, as you need. The MS9740B might be returned to Anritsu Service and Sales Office for installing some options. For the specifications, refer to Appendix A “Specifications”. -
Page 45: Installation
Install the MS9740B horizontally as shown in Figure 2.1.2-1. Good Installation method Figure 2.1.2-1 Installation Orientation CAUTION If the MS9740B is not installed in a “good” direction as above, a small shock may turn it over and harm the user. - Page 46 A fan is installed in the MS9740B to prevent the internal temperature from rising. Place the MS9740B in a location with the vents at least 10 cm away from walls, peripherals or other obstructions so as not to block the fan perimeter.
-
Page 47: Part Names
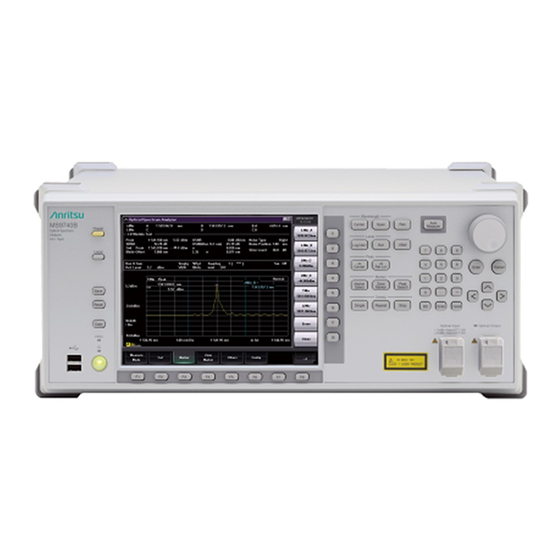
Part Names 2.2 Part Names 2.2.1 Front Panel Auto Center Span Auto Measure key Measure Numeric input key Shortcut key Ref Lvl Center Marker Zone Peak Select Marker Search — Measurement Single Repeat Stop Recall key Cancel key Save key Enter key Local key Rotary knob... -
Page 48: Rear Panel
Chapter 2 Before Use When using the optical input/output connector, open the optical connector cover as shown. Figure 2.2.1-2 How to Opening the Optical Connector Cover 2.2.2 Rear Panel GPIB Inlet Trigger input Serial Number, Option Number Label Ethernet Not used Line input Line output Mic input... - Page 49 Part Names Inlet GPIB Trigger input Serial Number, Option Number Label Line output Ethernet Monitor output Figure 2.2.2-2 Rear Panel (MS9740B-108 and MS9740B-208)
-
Page 50: Power Connection
This section describes the procedures for supplying power. For your safety, read the following operating procedures before turning on the MS9740B. 2.3.1 Power Requirements For normal operation of the MS9740B, use the power voltage range described below. Power source Voltage range Frequency... -
Page 51: Connecting Power Cord
Power Connection 2.3.2 Connecting Power Cord Insert the power plug into an outlet, and connect the other end to the power inlet on the rear panel. To ensure that the instrument is earthed, always use the supplied 3-pin power cord, and insert the plug into an outlet with an earth terminal. -
Page 52: Connecting Peripheral Devices
USB connector. No panel operations are required before removing USB devices from the MS9740B. USB devices can be removed at any time as long as no files are being written to or read from the USB device. -
Page 53: Connecting Remote Control Devices
Do not use the right Ethernet connector. Use a category-5 or better crossover cable. GPIB GPIB can be used when the MS9740B-001/101 is installed. Connect the cable to the rear-panel GPIB connector. Note: The MS9740B cannot print directly to a printer with a GPIB interface. 2-11... -
Page 54: Cautions On Handling Optical Fiber Cables
Chapter 2 Before Use 2.6 Cautions on Handling Optical Fiber Cables Optical fiber cables may degrade in performance or be damaged if handled improperly. Note the following points when handling them. CAUTION Do not pull the cable when removing the connector. - Page 55 Cautions on Handling Optical Fiber Cables CAUTION Do not excessively pull on or twist an optical fiber cable. Also, do not hang anything by using a cable. Doing so may break the optical fiber inside the cable. CAUTION Be careful not to hit the end of an optical connector against anything hard such as the floor or a desk by dropping the optical fiber cable.
-
Page 56: Precautions At Measurement
When connecting an SM optical fiber with an NA larger than 9.5/125 µm, not all the light radiated from the fiber is captured by the MS9740B, causing connection loss equivalent to the lost amount of light. As a result, the measured level is smaller than the true level. - Page 57 Effect of Water Vapor on Spectrum Absorption Water vapor (OH radicals) in air have multiple absorption spectra around 1350 to 1450 nm. If there is water vapor in the MS9740B, ripple will be observed in the measured spectrum due to the water vapor absorption spectra.
- Page 58 Chapter 2 Before Use Effect of Secondary Refraction on Measurement Results The MS9740B uses a diffraction grating that outputs wavelengths simultaneously as integer fractions. The diffraction grating outputs a ghost harmonic wavelength at a position of twice the wavelength of the measured wavelength.
- Page 59 The 14 dB loss when connecting 50 µm/125 µm multimode optical fiber degrades the light reception sensitivity. The MS9740B has an MM mode function to correct loss when connecting 50 µm/125 µm multimode optical fiber and to display the level.
-
Page 60: Turning Power On/Off
2.8 Turning Power On/Off 2.8.1 Power-on Connect the power cord plug, referring to 2.3 “Power Connection”. The MS9740B enters the standby state and the power switch lamp lights orange. Press the power switch. The power lamp lights green and the Windows start-up begins. -
Page 61: Power-Off
Yes by the left arrow key and press Enter to start shutting down. Power-off using mouse connected to MS9740B 1. Connect the supplied mouse to the MS9740B and click the “Minimize” button located in the upper right corner of the application window of the MS9740B. - Page 62 A fault may have occurred if the power cannot be turned off even by pressing the Power switch for 4 or more seconds. Unplug the power cord from the power outlet and contact your Anritsu Service and Sales Office or agent. ●...
-
Page 63: Setting Control Panel
Setting Control Panel 2.9 Setting Control Panel The MS9740B is set to the factory defaults for optimal measurement. Changing the Windows settings is outside the scope of operation warranty. In addition, the performance may drop or functions may not operate correctly if the Windows settings are changed. -
Page 64: Confirming Windows Version
Chapter 2 Before Use 2.9.2 Confirming Windows Version The MS9740B uses Windows Embedded Standard 7 (WES7) 32 bit version or Windows 10 IoT Enterprise (Win10) 64 bit version (hereinafter, referred to as “Windows”) as the operating system. Settings for Windows and the system can be operated by connecting a mouse and a keyboard. - Page 65 Setting Control Panel When the OS is Win10 Click the Start ( ), and on the Start menu, click the Settings ( Click About to display device information (specifications), and check the processor and edition information. Processor: CPU @ N3350E Edition: Windows 10 Figure 2.9.2-2 Windows 10 IoT (Win 10)
-
Page 66: Setting Control Panel
Display Intel® GMA Driver for Mobile ● This setting must be changed when connecting an external monitor to the MS9740B VGA connector. See Section 2.9.4 "Using external display" for details. ● Changing the screen resolution, refresh rate or power management, or enabling the screen saver may cause abnormal MS9740B operation. -
Page 67: Using External Display
Setting Control Panel 2.9.4 Using external display An external display can be connected to the VGA connector on the back of the MS9740B to display multiple screens. This operation is described below. When the OS is WES7 Figure 2.9.4-1 External Display Setting Connect the display to the VGA connector. - Page 68 Connect the display to the monitor output on the rear panel of the MS9740B. When the MS9740B is powered off, turn on the power to display on the external display. When the MS9740B is powered on, right-click the VGA icon in the task tray at the bottom right of the screen, select Enable VGA, and you can display on the external display.
- Page 69 Setting Control Panel Right-click an empty area of the desktop, and click Intel® Graphics Settings. The Intel® HD Graphics Control Panel is displayed. Figure 2.9.4-3 Intel HD Graphics Control Panel Click Display > Multiple Displays, and change the settings. When not using an external display ...
- Page 70 Chapter 2 Before Use Notes: ● If the MS9740B is powered on without an external display connected to the VGA connector, the settings are initialized so that only the built-in display can be used. When continuously using an external display, it is recommended to keep it connected.
-
Page 71: Windows Security Measures
MS9740B uses Windows Embedded Standard 7 (WES7) 32 bit version or Windows 10 IoT Enterprise (Win10) 64 bit version. When connecting the MS9740B to a network, in addition to connecting to secure and virus-protected networks, the following procedures are recommended in order to add protection against malware (malicious software) and viruses. -
Page 72: Installing Windows Important Update Programs (Windows Update)
MS9740B, deactivate automatic updates for Windows Update. Instead, it is recommended to check for new updates, execute downloads and installations periodically when MS9740B is not in use for measurement. When the OS is WES7 Click Start → Control Panel from the Windows menu bar hidden in the lower part of the screen. - Page 73 2.10 Windows Security Measures Select Never check for updates (not recommended) in Important updates, then click OK. Figure 2.10.1-2 Change settings display To check for newly available update programs (manual update), click Check for updates in Windows Update display. Figure 2.10.1-3 Windows Update display (manual update) When a new update program is found, download and install following the displayed instructions.
- Page 74 Chapter 2 Before Use When the OS is Win10 Click the Start ( ) to open the Start menu, and then click Settings Click Update & Security to show Windows Update window. To turn off automatic updates, select Windows Update found in left side of Windows Update window, and then click Advanced options.
- Page 75 2.10 Windows Security Measures To check for newly available update programs (manual update), click Check for updates in Windows Update window. Figure 2.10.1-6 Windows Update Window (manual update) When a new update program is found, download and install following the displayed instructions. 2-33...
-
Page 76: Using Antivirus Software
MS9740B, do not execute them. Instead, it is recommended to run them periodically when MS9740B is not in use for measurement. The antivirus software that checked operation in MS9740B is shown below. -
Page 77: Restoring Hard Disk Drive
When restoring the hard disk drive, the software installed on MS9740B is also restored to early state. Download the latest version of the software from the Anritsu website, and install it. For details on how to install the software, refer to 6.3 “Updating Software”. - Page 78 Chapter 2 Before Use Click Next. Click OK, leaving the Password box blank. Click Reinstall Windows. 2-36...
- Page 79 The Recovery Processing window in Windows is displayed. The recovery processing requires 10 to 30 minutes. After Windows restarts several times, the application window of the MS9740B will appear. Click the “Minimize” button located in the upper right corner of the application window.
- Page 80 Chapter 2 Before Use When the OS is Win10 Disconnect the MS9740B from the network if connected. Connect the keyboard and mouse to the mainframe, and then turn the MS9740B power On. When the following screen is displayed, press the F8 key on the keyboard several times at intervals of about one second.
- Page 81 2.10 Windows Security Measures Click Troubleshoot. Click Advanced option. 2-39...
- Page 82 Chapter 2 Before Use Click System Image Recovery. Click AnritsuUser. 2-40...
- Page 83 2.10 Windows Security Measures In the password box, enter “AnritsuUser”, and click Continue. 10. Select Use the latest available system image, and click Next. 2-41...
- Page 84 Chapter 2 Before Use 11. Click Next without making any changes. 12. Click Finish. 2-42...
- Page 85 14. After the system recovery is complete, you will see the following message. Click Restart now. If the MS9740B does not restart, it will automatically restart after a certain period of time. After a few reboots, the application window will appear.
-
Page 86: Configuring Storage Media
Chapter 2 Before Use 2.11 Configuring Storage Media The MS9740B has a built-in hard disk for storing the operating system, application software, user data, etc. The MS9740B hard disk is partitioned as follows: Volume C: System Partition The following files are saved: ●... -
Page 87: Screen Names
2.12 Screen Names 2.12 Screen Names Level scale Marker Measurement Message condition field field Date/time Reference level Horizontal function key Trace Wavelength Graph Vertical function key Figure 2.12-1 Measurement Screen 2-45... - Page 88 Chapter 2 Before Use Level Wavelength Wavelength Sweep marker marker D marker B marker A Level marker C Trace Trace marker Zone marker Delta marker Figure 2.12-2 Names of Trace and Marker 2-46...
- Page 89 2.12 Screen Names Value of wavelength marker Wavelength marker wavelength difference Level Marker Value Level Marker Level Difference Reference level Trace marker/Delta marker value Level Start Wavelength Center Wavelength in air Stop scale wavelength scale wavelength / Wavelength in wavelength vacuum Figure 2.12-3 Marker, Level Scale, Wavelength Displays Actual...
- Page 90 Chapter 2 Before Use 2-48.
-
Page 91: Measurement
Chapter 3 Measurement This chapter explains how to measure using shortcut and measurement keys, save and read measurement results, and initialize measurement conditions. Calibrating Before Measurement ........3-2 3.1.1 Automatic Alignment of Optical System ... 3-4 3.1.2 Calibrating Wavelength ........3-5 3.1.3 Calibrating Resolution ........ -
Page 92: Calibrating Before Measurement
3.1.2 Wl Cal (Ref) Wavelength calibration is performed using a Calibration light source of option 002. (MS9740B-002) When Align with cal is On, automatically aligns the optical axis using the light source before performing calibration. Wavelength 3.1.2 Wl Cal (Init) Initializes the wavelength calibration data. - Page 93 Calibrating Before Measurement Table 3.1-1 Calibration Functions (Cont’d) Calibration Items Where: Button Description Sets auto offset 3.1.2 Auto Cal At On, the internal temperature change is calibration for monitored every 10 minutes and the offset is On/Off temperature auto-calibrated when temperature changes change On/Off significantly.
-
Page 94: Automatic Alignment Of Optical System
For this alignment, the external light source that meets the specification is required. Also, if MS9740B-002 Light Source for Wavelength Calibration is installed, the function of Automatic Alignment of Optical System is added. To align the optical axis automatically using this function, refer to 3.1.2 “Calibrating Wavelength”. -
Page 95: Calibrating Wavelength
Wavelength can be calibrated using either an external or wavelength calibration light source (MS9740B-002). High-accuracy measurement is supported by the wavelength calibration light source of MS9740B-002. Before calibrating wavelength, always refer to 3.1.1 “Automatic Alignment of Optical System”, and then perform automatic alignment of the optical system. - Page 96 Chapter 3 Measurement To calibrate using option wavelength calibration light source Calibrate using the following procedures when MS9740B-002 has been installed. Connect the front-panel Optical Output connector to the Optical Input connector using an SM fiber. Press F8 to display Others on the horizontal function keys.
- Page 97 Calibrating Before Measurement To set automatic calibration: This function suppresses level and wavelength errors by automatically calibrating the offset in the optical module after measuring the ambient temperature and air pressure. Use this function as per the following procedures. Press F8 to display Cal on the horizontal function keys. Press F2 Cal.
- Page 98 Chapter 3 Measurement To execute Zero Cal: Zero Cal performs the same offset calibration as Auto Cal. Run Auto Cal periodically to perform offset calibration when the temperature conditions are met. Press the Zero Cal button to execute offset calibration. Note: Zero Cal cannot be executed when Auto Cal is set to On.
-
Page 99: Calibrating Resolution
The resolution is calibrated to improve the level accuracy of this type of level measurement. The actual resolution is adjusted using an Anritsu reference light source before shipment. Calibration of the resolution determines the actual resolution matching the light source being used. -
Page 100: Inputting Offset
Chapter 3 Measurement To initialize the calibrating data Initialize the actual resolution using the following procedure Press F8 to display Cal on the horizontal function keys. Press F2 Cal . Pres f7 More 1/2 . Press f1 Res Cal . Press f3 Init to initialize the calibrating resolution data. -
Page 101: Connecting Dut
Connecting DUT 3.2 Connecting DUT Use an optical fiber cord to connect the optical source for measurement to the optical input connector of the instrument. Optical transceiver for multi-mode fiber FC connector LC connector Multi-mode fiber Figure 3.2-1 Connection Example of Optical Transceiver LD module SC connector Single mode fiber Figure 3.2-2 Connection Example of Laser Diode Module... -
Page 102: Inputting Data
Chapter 3 Measurement 3.3 Inputting Data The following keys are used to input data. Rotary Knob – Keypad Arrow keys Enter key Cancel key Figure 3.3-1 Data Input Keys and Rotary Knob Keypad – (Minus) Changes sign of numeric value (Back space) Deletes preceding character at the left side of the cursor Sets input... -
Page 103: Measurement Types
Measurement Types 3.4 Measurement Types There are three kinds of the measurement methods. Automatic measurement Automatically sets wavelength, resolution and level and performs measurement Single measurement Sweeps waveform once When the trace Storage Mode is set to Sweep Average, Min Hold, or Max Hold, waveform sweeping is performed for the number of times set at Sweep Average. -
Page 104: Changing Wavelength And Resolution
Chapter 3 Measurement 3.5 Changing Wavelength and Resolution This section explains how to change the wavelength and resolution on the horizontal axis of the screen. 3.5.1 Changing Wavelength To change the screen center wavelength Press Center . Enter the center wavelength using the rotary knob or keypad. The input setting range is from 600 to 1750 nm. -
Page 105: Setting Level Scale
Setting Level Scale 3.6 Setting Level Scale To set the level scale, the vertical axis on the screen is set. 3.6.1 Changing Scale Press Log (/div). Input the scale per division using f1 though f7 keys or the rotary knob. The input setting range is 0.1 to 10 dB. 3.6.2 Changing Reference Level Press Ref. -
Page 106: Using Markers
3.7 Using Markers The trace data can be read using markers. 3.7.1 Marker types There are following markers in the MS9740B. Wavelength marker Used to read waveform, wavelength and wavelength difference The following data can be read. ● Wavelength at waveform peaks and dips ●... - Page 107 Using Markers Figure 3.7.1-1 Waveform Marker Display Figure 3.7.1-2 Level Marker Display 3-17...
- Page 108 Chapter 3 Measurement Figure 3.7.1-3 Trace Marker Display Figure 3.7.1-4 Delta Marker Display 3-18...
- Page 109 Using Markers Figure 3.7.1-5 Analysis Range Limited By Zone Markers Zoom In Zoom Out Figure 3.7.1-6 Enlarged Zone Marker Display 3-19...
-
Page 110: Using Wavelength And Level Markers
Chapter 3 Measurement 3.7.2 Using Wavelength and Level Markers To display the makers reading wavelength and level: Press Marker Select . Select the marker with f1 through f6 . f1 λMkr_A : wavelength marker A f2 λMkr_B : wavelength marker B f3 LMkr_C : level marker C f4 LMkr_D : level marker D f5 TMkr : trace marker... -
Page 111: Using Zone Markers
Using Markers 3.7.3 Using Zone Markers Setting zone markers restricts the peak and dip point search range (4.4 “Displaying Level Peaks and Dips”) and the waveform analysis range (4.5 “Analyzing Waveform”) and expands the on-screen display. Press Zone Marker. Press f1 Zone Center. Enter the center wavelength of the zone marker using the rotary knob and keypad. -
Page 112: Saving And Reading Data
● Image files with either the bmp or png extensions. These files are ideal for reading with word-processing or graphics-editing software. Files saved in the Image format cannot be read using the Recall function. Note: The data saved by MS9740B cannot be read out by MS9740A of V1.06.02 or older. 3-22... -
Page 113: Saving Measurement Conditions And Waveform Data
Steps 1 and 2 are not required for second and subsequent operations. Note: If the save destination is external USB flash drive, the path [\Anritsu Corporation\Optical Spectrum Analyzer\User Data] is created automatically in the USB flash drive root directory. Figure 3.8.1-1 File Name Input Dialog Box Select the characters on the dialog box to enter the file name. - Page 114 Chapter 3 Measurement Automatically Creating File Name and Saving File If the file name is created automatically, inputting the file name at the dialog box can be omitted. Select Data + sequence number (000-999) at step 2 of the Input File Name and Save File procedures.
-
Page 115: Saving Screens
Saving and Reading Data 3.8.2 Saving Screens Pressing Copy saves the screen display to a file. The file extension, name and save destination folder can be set at the Copy Settings described in Section 6.1.1 “Setting Interfaces and File Operating Environment”. When a USB flash drive is connected, you can specify it as a save destination. -
Page 116: Reading Data From File
Chapter 3 Measurement 3.8.3 Reading Data from File Press Recall . Press f1 Device . If the device selection dialog box opens, use the arrow keys to select the device from where the file will be read. Press f7 Set . Press f3 Recall XML . -
Page 117: Initializing Measurement Conditions
Initializing Measurement Conditions 3.9 Initializing Measurement Conditions Initialize the MS9740B measurement conditions. Press Preset . Press f1 Preset. For the initialized conditions and values, refer to Appendix B “Initial Values”. At the same time that measurement conditions are initialized, waveforms are erased from display. -
Page 118: Releasing Panel Lock
Chapter 3 Measurement 3.10 Releasing Panel Lock When this instrument is under remote control, panel keys except the Power and Local keys are disabled. This is called the panel lock state. Press Local to disable the panel lock. The panel is locked again at remote control after the panel lock has been previously released. -
Page 119: Changing Measurement Conditions
Chapter 4 Changing Measurement Conditions This chapter explains how to change the measurement conditions using the function keys. Wavelength-related Settings ......... 4-2 Setting Level Display ............ 4-5 Changing Data Capturing Method ........ 4-7 Displaying Level Peaks and Dips ....... 4-11 Analyzing Waveform ........... -
Page 120: Wavelength-Related Settings
Chapter 4 Changing Measurement Conditions 4.1 Wavelength-related Settings Press F1 Wavelength key to set the wavelength related to Figure 4.1-1. Numeric entry input Wavelength Center Wavelength in air/ Start Stop scale Wavelength in a vacuum Figure 4.1-1 Names of Wavelength Display To set screen display Center wavelength: Press f1 Center or Center . - Page 121 Wavelength-related Settings To set left screen wavelength start: Press f4 Start. Enter the wavelength using the rotary knob and keypad. The Start setting range is from 600 to 1750 nm. Input a smaller wavelength than the Stop value. Note: The Center and Span are also changed when the Start is changed. To set right screen wavelength stop: Press f5 Stop.
- Page 122 Chapter 4 Changing Measurement Conditions To switch wavelength display: The wavelength in a vacuum can be displayed using the index of refraction in air determined by the MS9740B internal temperature and pressure. Press f7 Value in Air/Vacuum . When displaying the wavelength in air, in Air is displayed between Center and Stop .
-
Page 123: Setting Level Display
Setting Level Display 4.2 Setting Level Display Press F2 Level Scale key to set the level display. Numerical value entry area Reference level Displays when using Log scale internal attenuator Figure 4.2-1 Name of Level Display To set log scale: Set Level Scale to Log Scale and set the scale ratio to dB units. - Page 124 Chapter 4 Changing Measurement Conditions To set reference level: When Level Scale is set to Log Scale, the reference level is called Reference Level. Note: When Linear Scale is set, the bottom of the vertical axis become 0 W and cannot be changed. Press f2 Ref Level or Ref .
-
Page 125: Changing Data Capturing Method
Changing Data Capturing Method 4.3 Changing Data Capturing Method The following measurement conditions can be set. Resolution This sets the optical wavelength resolution for measuring the optical spectrum (wavelength resolution determined by built-in grating). The actual resolution at the Center wavelength can be displayed. For the resolution and actual resolution, refer to 1.3 “Glossary”. - Page 126 Chapter 4 Changing Measurement Conditions Sampling Point This sets the data points captured at one measurement. When there are many sampling points, the measured data wavelength interval becomes smaller and the measurement time becomes longer. The data capture method is displayed in the measurement condition display field.
- Page 127 In the smoothing processing, the graph line is smoothed using the exact smoothing points and the averaging points of before and after the smoothing points. The MS9740B can set the number of the exact smoothing points and before and after its smoothing points; increasing the smoothing points increases the deformation of the measured waveform.
- Page 128 Chapter 4 Changing Measurement Conditions To set sampling point count: Press f6 Sampling Points . Select the numeric value from f1 to f6 . The sampling point count is the number of points within the sweep width where data is captured. When the number of sampling points is small, the measurement time is shorter.
-
Page 129: Displaying Level Peaks And Dips
Displaying Level Peaks and Dips 4.4 Displaying Level Peaks and Dips The MS9740B has search functions for finding the maximum and minimum waveform levels and peak and dip points. These functions are executed at the Active Trace. Additionally, if the zone markers are displayed, the data between the zone markers is the target data for searching position. - Page 130 Chapter 4 Changing Measurement Conditions To display peak point in ascending order or dip point in descending order: Press f4 Next . At peak point display, the trace marker moves to the next peak level. At dip point display, the trace marker moves to the next dip level. To display peak point in descending order or dip point in ascending order: Press f5 Last At peak point display, the trace marker moves to the previous peak level.
-
Page 131: Analyzing Waveform
Analyzing Waveform 4.5 Analyzing Waveform The spectrum waveform center wavelength, half width, side mode suppression ratio and spectrum integrated power can be analyzed. This function is executed at the Active Trace. In addition, when the zone markers are displayed, data between the zone markers is searched. The target of analysis is data displayed on the screen. -
Page 132: Analyzing Single Spectrum Center Wavelength And Spectrum Width
Chapter 4 Changing Measurement Conditions 4.5.1 Analyzing Single Spectrum Center Wavelength and Spectrum Width Press f1 Threshold . Select the cut level from f1 to f4 and enter the value using the rotary knob or keypad. The cut level, which is an attenuator from the peak level, can be used to calculate the spectrum width. -
Page 133: Analyzing Single Spectrum Smsr
Analyzing Waveform 4.5.2 Analyzing Single Spectrum SMSR The Side Mode Suppression Ratio (SMSR) is the ratio of the spectrum peak and adjacent mode spectrum levels. Press f3 SMSR. Select the side mode from f1 to f3. 2nd Peak: Next highest side mode from maximum level Left: Peak point at short-wavelength side of max. -
Page 134: Analyzing Multiple Spectrum Center Wavelength And Spectrum Width (Ndb Loss Method)
Chapter 4 Changing Measurement Conditions 4.5.3 Analyzing Multiple Spectrum Center Wavelength and Spectrum Width (ndB Loss Method) In the ndB Loss method, the level of the part that is ndB loss below the peak level is the threshold level. The center wavelength, spectrum width and vertical oscillation mode count from the spectrum of the vertical oscillation mode exceeding the threshold level is analyzed. -
Page 135: Analyzing Multiple Spectrum Center Wavelength And Spectrum Width (Envelope Method)
Analyzing Waveform 4.5.4 Analyzing Multiple Spectrum Center Wavelength and Spectrum Width (Envelope Method) In the Envelope method, an envelope is drawn linking the spectrum peak points. The center wavelength and spectrum width are analyzed from the wavelength of the intersection between the envelope line and the cut level part lower than the peak level as well as the spectrum width are analyzed. -
Page 136: Analyzing Multiple Spectrum Center Wavelength And Spectrum Width (Rms Method)
Chapter 4 Changing Measurement Conditions 4.5.5 Analyzing Multiple Spectrum Center Wavelength and Spectrum Width (RMS Method) In the RMS method, the center wavelength and standard deviation (σ) are found from the spectrum with a level exceeding the slice level. The value of the standard deviation (σ) multiplier (k) is displayed as the spectrum half width. - Page 137 Analyzing Waveform The center wavelength (λc) and standard deviation (σ) are calculated by the following formula. ∑ λ λ λ ..λ λ ..∑ ∑ λ λ × − σ ∑ Level of i-th peak point of spectrum exceeding the level lowered slice level from peak level.
-
Page 138: Measuring Spectrum Power By Integration
Chapter 4 Changing Measurement Conditions 4.5.6 Measuring Spectrum Power by Integration Press f6 Spectrum Power . The integrated power of the spectrum data on the screen and the center wavelength λc obtained from the weighted average of the level are displayed. Analysis result display field Figure 4.5.6-1 Spectrum Power Example The center wavelength (λc) and power (p) are calculated by the following... -
Page 139: Erasing Analysis Results
Analyzing Waveform 4.5.7 Erasing Analysis Results Press f7 Off. The analysis results display is erased. Both the Wavelength Marker and Level Marker can be used as markers for analysis. 4-21... -
Page 140: Changing Waveform Memory Settings And Calculation Between Memories
4.6 Changing Waveform Memory Settings and Calculation between Memories The MS9740B has 10 waveform memories called trace memories. The trace display and store methods can be changed. Also, the calculation can be performed between traces. Press the F6 Trace key to use this function. - Page 141 Changing Waveform Memory Settings and Calculation between Memories Start Select Active Trace. Set Trace Type. Trace Type=Write Trace Type= Calculation Set Storage Mode. Set Calculation Formula. Set Display On/Off. Set Absolute/Relative Display Method. Figure 4.6-2 Trace Setting Flowchart 4-23...
- Page 142 Chapter 4 Changing Measurement Conditions Selecting Active Trace The trace setting target is called the Active Trace. First, select the Active trace from A to J. Press f1 Active Trace . Select an active trace, by selecting one of A ( f1 ) to F ( f6 ), or by pressing f7 More 1/2 and selecting one of G ( f1 ) to J ( f4 ).
- Page 143 Changing Waveform Memory Settings and Calculation between Memories Note: When storage mode is set to Overlap, Traces are overwritten on the display. However, only the most recent trace becomes the target traces to be measured. They are: ● Trace whose data can be read out by marker ●...
- Page 144 Chapter 4 Changing Measurement Conditions Setting Relative or Absolute Value Display The Active Trace level display can be set to relative or absolute level. When relative level is set, the spectrum peak level is displayed as 100% or 0 dBm and the units are either % or dB. Press f6 Graph .
-
Page 145: Changing Measurement Mode
Changing Measurement Mode 4.7 Changing Measurement Mode The spectrum measurement modes are listed below. ● High dynamic range mode (High D.Range) ● Sweep start using external trigger (Ext Trigger) ● Sweep repeat at fixed time interval (Interval Time) ● Power measurement (Power Monitor) ●... - Page 146 Chapter 4 Changing Measurement Conditions To change to High dynamic range mode (High D.Range) The measurement time is longer in the high dynamic range mode but the dynamic range performance is improved. Press f1 Dynamic Range to switch to High. The High-D.Range is displayed in the measurement settings display field.
- Page 147 To perform power measurement (Power Monitor) At power measurement, the value of the optical power input to the MS9740B is displayed. Press f4 Power Monitor. Press f1 Wavelength. Select the wavelength from f1 to f4.
- Page 148 Chapter 4 Changing Measurement Conditions To release MM Mode The MM mode is released under the following conditions: ● When connecting single mode fiber. ● When measuring optical output of LD module not in recommended launch mode using dummy fiber patch cord (GSGG) for optical loss measurement Press f5 MM Mode.
-
Page 149: Inputting Title To Waveform Data
Inputting Title to Waveform Data 4.8 Inputting Title to Waveform Data The character strings displayed in the title bar is called title. The title can include up to 32 alphanumeric characters and symbols. To input title: Press F8 to display Others in the horizontal function keys. Press F5 Others. -
Page 150: Using Light Source Option
Press F8 to display Others on the vertical function key. Press F5 Others . Press f1 Optical Output to set to On. The Optical Output LED on the front panel lights. If MS9740B-002 has not been installed, f1 Optical Output is not displayed. 4-32. -
Page 151: Measurement Functions
Chapter 5 Measurement Functions MS9740B has various dedicated measurement functions for measuring optical elements, optical amplifiers, wavelength multiplexers, etc. This chapter explains how to use these functions. Before using the measurement functions described in this chapter, perform the following actions: ●... - Page 152 Chapter 5 Measurement Functions 5.6.3 Calculation Method ......... 5-43 5.6.4 Procedures ............. 5-45 Measuring Optical Amplifier ........5-47 5.7.1 Optical Amplifier Measurement Method ..5-47 5.7.2 Optical Amplifier Measurement Screen Display ............5-53 5.7.3 Measurement With/Without Spectrum Division Method ............5-54 5.7.4 Measurement Using Polarization Nulling Method ............
-
Page 153: Measuring Dfb-Ld (Distributed Feedback Laser Diode)
Measuring DFB-LD (Distributed Feedback Laser Diode) 5.1 Measuring DFB-LD (Distributed Feedback Laser Diode) A DFB–LD is a semiconductor laser diode that generates a single spectrum. The following items can be measured by the DFB-LD measurement functions. ● Peak: Peak wavelength and peak level ●... -
Page 154: Setting Items
Chapter 5 Measurement Functions 5.1.1 Setting Items This function has following setting items. ● Slice Level This is the threshold value for calculating standard deviation σ. ● Side Mode This selects the detected side mode. 2nd Peak: Next highest peak after maximum peak as side mode Left: Peak at left side of maximum peak as side mode Right:... -
Page 155: Calculation Method
Measuring DFB-LD (Distributed Feedback Laser Diode) 5.1.2 Calculation Method ● σ This is calculated using the following formula: ∑ × λ σ= -λ ∑ ∑ × λ λ + λ +・・・ λ λ = = ∑ + +・・・ where, Bn and λn (n = 1, 2, 3 ….i) is calculated as level and wavelength at the point with a level more than a slice level down from the peak. -
Page 156: Procedure
Chapter 5 Measurement Functions 5.1.3 Procedure To measure DFB-LD: Input the optical signal. Set the wavelength, resolution, and level scale. Press Single to start the measurement. When the name of the F7 horizontal key is not Application , press F8 , and then press F7 . -
Page 157: Measuring Fp-Ld (Fabry-Perot Laser Diode)
Measuring FP-LD (Fabry-Perot Laser Diode) 5.2 Measuring FP-LD (Fabry-Perot Laser Diode) A Fabry-Perot laser diode is a semiconductor laser diode with a multi mode oscillation in the spectrum. The following items can be measured by the FP-LD measurement functions. ● Peak: Peak wavelength and peak level ●... -
Page 158: Setting Items
Chapter 5 Measurement Functions 5.2.1 Setting Items This function has following setting items. ● Slice Level This sets whether or not to find the number of longitudinal modes at levels lowered some dB (Slice level) from the peak. 5.2.2 Calculation Method The following equation is used to calculate the level L ---L for all... -
Page 159: Procedure
Measuring FP-LD (Fabry-Perot Laser Diode) 5.2.3 Procedure To measure Fabry-Perot LD: Input the optical signal. Set the wavelength, resolution, and level scale. Press Single to start the measurement. When the name of the F7 horizontal key is not Application, press F8, and then press F7. -
Page 160: Measuring Led (Light Emitting Diode)
Chapter 5 Measurement Functions 5.3 Measuring LED (Light Emitting Diode) A light emitting diode is an optical element with a continuous spectrum. The following items can be measured by the LED measurement functions. ● Peak: Peak wavelength at peak level ●... -
Page 161: Setting Items
Measuring LED (Light Emitting Diode) 5.3.1 Setting Items This function has following setting items. ● Cut Level This sets the threshold level used to calculate Mean Wl (n dB), ndB Width, and PkDens (/1nm). When calculating Mean Wl (FWHM), FWHM (2.35 σ), Total Power, and σ, all data are used irrespective of Cut Level. -
Page 162: Procedure
Chapter 5 Measurement Functions ● Total Power Span ∑ PowerCal ⋅ ⋅ ⋅ Sampl ActRes − Span: Span (nm) Sampl: Sampling point ActRes: Actual Resolution α: Equipment dependent power correction coefficient ● PkDens (1nm) Span ∑ PkDens PowerCal ⋅ ⋅ ⋅... -
Page 163: Measuring Pmd (Polarization Mode Dispersion)
Measuring PMD (Polarization Mode Dispersion) 5.4 Measuring PMD (Polarization Mode Dispersion) Polarization Mode Dispersion is a phenomenon that widens the width of optical pulses due to differences in transmission speed between two polarization modes when an optical pulse is passed through optical fiber and optical equipment. -
Page 164: Setting Items
Chapter 5 Measurement Functions Figure 5.4-2 PMD-Test Example 5.4.1 Setting Items This function has following setting items. ● Auto/Manual This sets the method for capturing the following values used in the calculation. ● First Peak Wavelength in analysis range (1st Peak Wavelength) ●... -
Page 165: Calculation Method
The measurement system is shown in the following diagram. A SLD (Super Luminescent Diode) light source or an ASE (Amplified Spontaneous Emission) light source can be used as the wideband light source. (Optical fiber cable, etc) Polarization controller MS9740B Wideband Optical light Spectrum source Analyzer... - Page 166 Chapter 5 Measurement Functions The measurement results are updated at each measurement. Press f7 Off to finish the polarization mode dispersion measurement. To calculate manually Press f1 Auto/Manual and select Manual. Input the optical signal. Set the wavelength, resolution, and level scale. Press Repeat .
-
Page 167: Measuring Wdm (Wavelength Division Multiplexed) Signals
Measuring WDM (Wavelength Division Multiplexed) Signals 5.5 Measuring WDM (Wavelength Division Multiplexed) Signals Wavelength Division Multiplexing (WDM) is a method for increasing the communication capacity of an optical fiber by using multiple wavelengths in one fiber. The WDM light is composed of multiple optical signals. At WDM measurement, the following items are measured simultaneously for the multiple optical signals. -
Page 168: Wdm Measurement Screen Display
Chapter 5 Measurement Functions 5.5.1 WDM Measurement Screen Display WDM measurement has four types of measurement screens. The displayed measurement result items differ according to the screen display. : Displays –: Does not display Table 5.5.1-1 Items Displayed on the WDM Screen Screen Display Item Multi... - Page 169 Measuring WDM (Wavelength Division Multiplexed) Signals Multi Peak: Up to 15 wavelengths and levels are displayed on one screen. Figure 5.5.1-1 Multi Peak Display Example SNR: Up to 8 wavelengths, levels and signal noises are displayed on one screen. Figure 5.5.1-2 SNR Display Example 5-19...
- Page 170 Chapter 5 Measurement Functions Relative: Up to 5 wavelengths, spacing, wavelength-references, levels, and Level-references are displayed on one screen. Figure 5.5.1-3 WDM Relative Display Example Table: Up to 16 wavelengths, frequencies, levels, signal noises, wavelength intervals and spacing intervals are displayed on one screen. Figure 5.5.1-4 WDM Table Display Example 5-20...
-
Page 171: How To Set The Signal Measurement Method
Measuring WDM (Wavelength Division Multiplexed) Signals 5.5.2 How to Set the Signal Measurement Method In the Signal Parameter dialog box, set the signal detection range (S.Level) and wavelength/level detection method. Figure 5.5.2-1 Signal Parameter Dialog Box Table 5.5.2-1 Setting Range of the Parameters in the Signal Parameter Dialog Box Item Min. - Page 172 Chapter 5 Measurement Functions ● S.Level (Slice Level) This sets the optical signal detection level range and detects peaks above the lower level of the S. Level band below the Peak level as WDM signals. Peaks b, c, d, and e in the following diagram are detected.
- Page 173 Measuring WDM (Wavelength Division Multiplexed) Signals ● Level Detection Type: Detection type of Signal level Point: Point level for Signal wavelength ΣPower: Total level for Signal Span wavelength range Signal Span is set in the range of 0.01 to 50.00. At Σ...
-
Page 174: How To Set The Noise Measurement Method
Chapter 5 Measurement Functions 5.5.3 How to Set the Noise Measurement Method In the Noise Parameter dialog box, set the noise level for the SNR measurement and display/detection method. Figure 5.5.3-1 Noise Parameter Dialog Box Table 5.5.3-1 Setting Range of the Parameters in the Noise Parameter Dialog Box Item Min. - Page 175 Measuring WDM (Wavelength Division Multiplexed) Signals ● Normalization: Calculation method for noise level Off: Level in the wavelength range for the actual resolution Normalized level in the wavelength range of the Noise BW Noise BW: Band width used for noise level calculation. ●...
- Page 176 Chapter 5 Measurement Functions When Point is set to Right, the position is at the dip level on the longer wavelength side of the optical signal. When Point is set to Higher, the position is at the higher level of the dip points on the left or right side of the optical signal (left in Figure 5.5.3-3 (a)).
- Page 177 Measuring WDM (Wavelength Division Multiplexed) Signals 5th POLY: Fifth-order polynomial equation for noise linear data f (λ) = aλ + bλ + cλ + dλ + eλ + f Fitting Curve Display: Fitting curve display setting Off: Does not display fitting curve on screen Displays fitting curve on screen Area Type: Area setting method for calculating fitting curve...
-
Page 178: Calculation Method
Chapter 5 Measurement Functions 5.5.4 Calculation Method Peaks with a level higher than the level set by S. Level setting of Signal Parameter are detected and analyzed. The WDM signal wavelength is measured in accordance with the Wavelength-Detection Type setting of Signal Parameter. The WDM signal peak level is measured in accordance with the Level-Detection Type of Signal Parameter. - Page 179 Measuring WDM (Wavelength Division Multiplexed) Signals :Signal wavelength :Signal level :Noise level Wavelength (nm) Figure 5.5.4-2 Fitting Curve and Noise Level when Area Type is User Specify SNR is calculated using the following equation. (dB) ...
- Page 180 Chapter 5 Measurement Functions When Normalization at Noise Parameter is set to On, the noise level is normalized in the wavelength range set at Noise BW to calculate the noise level per *.* nm. SNR is calculated for this noise level. ...
-
Page 181: Procedures
Measuring WDM (Wavelength Division Multiplexed) Signals 5.5.5 Procedures To measure WDM When the name of the F7 horizontal key is not Application, press F8, and then press F7. Press f5 WDM Test to display the measurement result display field. Input the optical signal. Set the wavelength, resolution, and level scale. - Page 182 Chapter 5 Measurement Functions To set Noise Level when SNR displayed Press f5 Noise Parameter . Set the following items in the dialog box: Normalization: When On is set, Noise BW is used to calculate noise level. Input a value for Noise BW in the range of 0.1 to 1.0 nm.
-
Page 183: Measuring Laser Diode Modules
Measuring Laser Diode Modules 5.6 Measuring Laser Diode Modules When using the laser diode module measurement function, the following items are measured. ● Signal: Signal wavelength and signal level Signal level varies according to the SignalLevel settings made in the Signal Parameter dialog box. ●... - Page 184 Chapter 5 Measurement Functions Figure 5.6-1 LD Module-Test Example 5-34...
-
Page 185: How To Set The Signal Measurement Method
Measuring Laser Diode Modules 5.6.1 How to Set the Signal Measurement Method In the Signal Parameter dialog box, set the level range and wavelength/level detection method. ● SMSR Parameter This selects the detection method for the Side Mode. 2nd Peak: Peak with next highest level after maximum peak becomes side mode Left:... - Page 186 Chapter 5 Measurement Functions ● Signal Parameter The Signal Parameter dialog box sets the level range to calculate standard deviation (Slice Level), and wavelength/level detection method. Figure 5.6.1-2 Signal Parameter Dialog Box Table 5.6.1-1 Setting Range of the Parameters in the Signal Parameter Dialog Box Item Min.
- Page 187 Measuring Laser Diode Modules Note: The center wavelength on the screen becomes the detection wavelength if the wavelength is not detected in the range of level set at Threshold Cut Level. Cut level At Threshold At Peak Threshold level Signal Wl: Signal Wl: Center wavelength of Peak wavelength...
- Page 188 Chapter 5 Measurement Functions When Level Detection Type is set to Point, the optical signal level ) is calculated by the following formula: When the Signal Level is set at [Signal], When the Signal Level is set at [Signal–Noise], − P(λsig): level at detected optical signal wavelength N(λsig):...
-
Page 189: How To Set The Noise Measurement Method
Measuring Laser Diode Modules 5.6.2 How to Set the Noise Measurement Method In the Noise Parameter dialog box, set the noise level for the SNR measurement and detection method. Figure 5.6.2-1 Noise Parameter Dialog Box Table 5.6.2-1 Setting Range of the Parameters in the Noise Parameter Dialog Box Item Min. - Page 190 Chapter 5 Measurement Functions Calculation Left Right range Noise level Noise level (L + R)/2 Fitting curve Noise level Wavelength (nm) Wavelength (nm) Noise level (a) Area (b) Point Figure 5.6.2-2 Detection Method for Noise Level When Detection Type is set to Point, the position for measuring noise level can be set by f3 Noise Position .
- Page 191 Measuring Laser Diode Modules Right Left Left Right Noise level Noise level Noise level Noise level l s – ∆l l s + ∆l Wavelength (nm) Wavelength (nm) (a) Noise Position Off (b) Noise Position On Figure 5.6.2-3 Measurement of Noise at Noise Position Point: Noise level detection point when Detection Type is Point Higher:...
- Page 192 Chapter 5 Measurement Functions Channel: Area setting when Noise Area is Channel Fitting Span: Wavelength range for calculating fitting curve Masked Span: Wavelength range excluded from fitting curve calculation User Specify: Area setting when Noise Area is User Specify Noise Position: Wavelength difference between screen center wavelength and area center wavelength Span: Area wavelength range...
-
Page 193: Calculation Method
Measuring Laser Diode Modules 5.6.3 Calculation Method The peak level of waveform is detected. The side mode wavelength and level are measured in accordance with the Search Resolution. SMSR is measured in accordance with the SMSR Parameter. Mode Offset, Stop Band, Center Offset are calculated. Processing is performed as follows where the wavelength of the maximum peak is λ... - Page 194 Chapter 5 Measurement Functions The noise measurement position and range are determined in accordance with the Noise Parameter Detection Type and Noise Position settings. Table 5.6.3-1 Noise Measuring Point Noise Position Noise Parameter Noise Parameter Detection Type Position Area Type Area Point –...
-
Page 195: Procedures
5.6.4 Procedures To measure laser diode module Input the optical signal in the MS9740B. Set the wavelength, resolution, and level scale. Press Single to start the measurement. When the name of the F7 horizontal key is not Application, press F8, and then press F7. - Page 196 Chapter 5 Measurement Functions 14. f1 On : Sets wavelength difference On. Use the rotary knob or the ten numeric keys to input the wavelength difference for noise measurement. The wavelength difference is input in the range 0.01 to 20 nm. f2 Off : Sets wavelength difference Off.
-
Page 197: Measuring Optical Amplifier
Measuring Optical Amplifier 5.7 Measuring Optical Amplifier 5.7.1 Optical Amplifier Measurement Method The following items can be measured by the optical amplifier functions. ● Noise figure ● Gain: Gain ● Signal Wl: Amplified optical peak wavelength ● ASE Lvl/(Res): ASE level for amplified light ●... - Page 198 Chapter 5 Measurement Functions Spect Div On: Uses the spectrum division method. Pout and Pase are obtained by subtracting the level of the optical input spectrum from the level of the measured output spectrum. PLZN Nulling: Polarization Nulling Method With the polarization nulling method, Pout and Pase are obtained by assuming that the state of polarization of the optical output from the optical amplifier is as follows: The signal is polarized.
- Page 199 Measuring Optical Amplifier Mean Fitting: Fitting Method Utilizing a Linear Function The mean of the data for λ2 and λ3 in Figure 5.7.1-2 (b) is found (mW units). The product of this value and optical band filter correction value is Pase. Pase Pase Wavelength (nm)
- Page 200 O.BPF Lvl Cal This sets the pass and filter levels for the optical bandpass filter inserted between the optical amplifier and MS9740B. Set 0 dB when no filter is inserted or when the characteristics of an optical amplifier with built-in filter are evaluated.
- Page 201 Pin Loss This sets the level difference that is the level of the optical signal input to MS9740B subtracted from the level of the optical signal actually input to the optical amplifier. This is used when measuring the optical input (Pin).
- Page 202 Chapter 5 Measurement Functions MS9740B Light Polarization Optical Spectrum Source Controller Analyzer (a) Measurement of the Output Level of the Polarization Contlroller Analyzer MS9740B Light Polarization Optical Spectrum Source Controller Analyzer (b) Measurement of Analyzer Output Level ● Ext. Trigger Delay This sets the delay time for external sync measurement at pulse or multiple division wavelength measurements.
-
Page 203: Optical Amplifier Measurement Screen Display
Measuring Optical Amplifier 5.7.2 Optical Amplifier Measurement Screen Display To display the optical amplifier measurement functions, When the name of the F7 horizontal key is not Application, press F8, and then press F7. Press f7 More 1/2. Press f1 Opt.AmpTest to display the measurement result display field. -
Page 204: Measurement With/Without Spectrum Division Method
14. Press f3 Write to . 15. Press f2 Pout . 16. Input the output light of the optical amplifier to MS9740B as shown by the connection in Figure 5.7.3-1 (b). If necessary, insert an optical bandpass filter between the optical amplifier and MS9740B to remove the ASE. - Page 205 Measuring Optical Amplifier 19. Set the following items in the dialog box: NF Select: Noise figure calculation method ASE Fitting: Fitting method for the ASE level Fitting Span: Wavelength width targeted for the ASE level calculation Masked Span: Wavelength width excluded from the ASE level calculation Pin Loss: Calibration factor for the optical level input...
-
Page 206: Measurement Using Polarization Nulling Method
Press f3 Pase . Select the traces A to J to store the ASE waveform. Press f7 More 2/2 . Input the output light of the optical amplifier to MS9740B as shown by the connection in Figure 5.7.4-1 (a). Set the wavelength, resolution, and level scale. - Page 207 Measuring Optical Amplifier 17. Input the output light of the optical amplifier to MS9740B as shown by the connection in Figure 5.7.4-1 (b). 18. Adjust the polarization controller to maximize the optical output level. 19. Press Single or Repeat. The data for the trace specified at step 5 is stored.
-
Page 208: Measurement Using Pulse Method
Chapter 5 Measurement Functions 5.7.5 Measurement Using Pulse Method Intensity Modulated Light MS9740B Light Optical Spectrum Source Analyzer Optical Modulation Ext Trigger Bandpass Filter Signal Signal Generator (a) Signal Measurement Optical Bandpass Filter Intensity Optical Output Modulated Light MS9740B Light... - Page 209 Press f3 Pase. Select the traces A to J to store the ASE waveform. Press f7 More 2/2. Input the output light of the optical amplifier to MS9740B as shown by the connection in Figure 5.7.5-1 (a). Input the modulation signal to the Ext Trigger connector on the rear panel.
- Page 210 18. Press f3 Write to . 19. Press f2 Pout . 20. Input the output light of the optical amplifier to MS9740B as shown by the connection in Figure 5.7.5-1 (b). If necessary, insert an optical bandpass filter between the optical amplifier and MS9740B to remove the ASE.
-
Page 211: Measuring Performance With Respect To Wavelength Multiplexed Light
The MS9740B identifies the pulse-modulated optical signal and detects the wavelength for measuring the optical amplifier performance. To measure the performance of the optical amplifier when the optical input is wavelength multiplexed Press f1 Method. - Page 212 Press f3 Pase . Select the traces A to J to store the ASE waveform. Press f7 More 2/2 . Input the output light of the optical amplifier to MS9740B as shown by the connection in Figure 5.7.6-1 (a). Input the modulation signal to the Ext Trigger connector on the rear panel.
- Page 213 Calibration factor for the noise figure O.BPF Lvl Cal: Ratio of pass level and filter level of optical bandpass filter inserted between the optical amplifier and MS9740B O.BPF BW: Optical bandpass filter bandwidth For the input range, refer to Table 5.7.1-1.
-
Page 214: Calculation Method
Chapter 5 Measurement Functions 5.7.7 Calculation Method This section explains the method for calculating the optical amplifier gain and noise figure. The noise figure calculation method differs according to the NF Select setting. Gain (dB) Calculation Method Gain is a comparison of the optical signal level and the amplified signal level. - Page 215 Measuring Optical Amplifier ν: Frequency of optical signal (Hz) Resolution calibrated by Res Cal (nm) real Light Velocity 2.9979 × 10⁸ (m/s) When NF Select is Total The noise figure is calculated from the sum of noises due to four noise sources.
- Page 216 Chapter 5 Measurement Functions Spectrum Division Calculation Method The level of the ASE output from the optical amplifier is the sum of the following levels: ● Noise Level generated in optical amplifier ● Noise level for amplified optical signal The spectrum division method finds the noise level generated in the optical amplifier (spectrum correction value) by subtracting the amplified optical signal level from the optical amplifier output level.
-
Page 217: Measuring Optical Amplifier (Wavelength Division Multiplex)
Measuring Optical Amplifier (Wavelength Division Multiplex) 5.8 Measuring Optical Amplifier (Wavelength Division Multiplex) With the optical amplifier (WDM), the following items are measured simultaneously for the multiple optical signals. Table 5.8-1 Opt. Amp Multi Measurement Items Screen Display Description Peak Count Signal count Gain Slope Slope when a straight line approximation is... - Page 218 Chapter 5 Measurement Functions This function has following setting items. ● ISS Method This selects measurement method. IEC: This measurement method conforms to IEC standards. Advanced: This measurement method has less error due to optical input ASE noise than IEC or Off. Off: This measurement method is equivalent to “5.7.1 Optical Amplifier Measurement Method”, Spect Div Off.
-
Page 219: Optical Amplifier (Wdm) Screen Display
Measuring Optical Amplifier (Wavelength Division Multiplex) 5.8.1 Optical Amplifier (WDM) Screen Display To display the optical amplifier (WDM) measurement functions, When the name of the F7 horizontal key is not Application, press F8, and then press F7. Press f7 More 1/2. Press f2 Opt.Amp (Multi Channel) Test to display the measurement result display field. - Page 220 Chapter 5 Measurement Functions Table: Up to 16 measurement results for each optical signal are displayed in one screen. Figure 5.8.1-2 Table Display Example 5-70...
-
Page 221: How To Set The Signal Measurement Method
Measuring Optical Amplifier (Wavelength Division Multiplex) 5.8.2 How to Set the Signal Measurement Method In the Channel Parameter dialog box, set the optical signal level range and the wavelength detection method. Figure 5.8.2-1 Channel Parameter Dialog Box Table 5.8.2-1 Setting Range of the Parameters in the Channel Parameter Dialog Box Item Min. - Page 222 Chapter 5 Measurement Functions ● S.Level Level difference (dB) from the maximum level, which sets the level range for detecting the signal. Peaks with values above the lowest value in the S. Level portion below the maximum peak are detected as the signal. In the following figure, the peaks detected are points b, c, d, and e.
- Page 223 Measuring Optical Amplifier (Wavelength Division Multiplex) Note: If no wavelength is detected within the level range specified by Threshold Cut Level, the screen center wavelength becomes the detected wavelength. When Threshold is set When Peak is set Cut Level Threshold Level Signal Wl: Signal Wl:...
-
Page 224: How To Set The Estimated Noise Measurement
Chapter 5 Measurement Functions 5.8.3 How to Set the Estimated Noise Measurement Method In the Opt Amp Test Parameter dialog box, set the Opt Amp Multi measurement’s fitting curve display, detection method, NF calculation method, and the actual resolution calculation method. Figure 5.8.3-1 Opt Amp Test Parameter Dialog Box 5-74... - Page 225 Measuring Optical Amplifier (Wavelength Division Multiplex) Table 5.8.3-1 Setting Range of the Parameters in the Opt Amp Test Parameter Dialog Box Item Min. Max. Unit Fitting Span (Manual)* 0.10 100.00 Masked Span* 0.10 100.00 Point (Manual)* 0.10 100.00 Pin Loss (Offset) –10.00 10.00 Pout Loss (Offset)
- Page 226 Chapter 5 Measurement Functions ● Fitting Display Off: The fitting curve is not displayed The fitting curve is displayed ● Area: Set the fitting curve calculation range when Detection Type is Area Fitting Curve: Selects the type of fitting curve. Linear: Linear equation for noise linear data f (λ) = aλ...
- Page 227 Measuring Optical Amplifier (Wavelength Division Multiplex) ● Point: Select the noise level detection position when Detection Type is Point Auto (Center): The halfway point to the neighboring signal is used as the noise level detection position. (See Figure 5.8.3-3) If there is only one signal, then the noise level dependent on Resolution during waveform measurement is used as the detection position.
- Page 228 O.BPF Lvl Cal This sets the pass and filter levels for the optical bandpass filter inserted between the optical amplifier and MS9740B. Set 0 dB when no filter is inserted or when the characteristics of an optical amplifier with built-in filter are evaluated.
-
Page 229: Calculation Method
Measuring Optical Amplifier (Wavelength Division Multiplex) 5.8.4 Calculation Method This section explains the method for calculating the optical amplifier gain and noise figure. The noise figure calculation method differs according to the NF Select setting. ISS Method: IEC calculation method This performs the following calculation when the IN waveform (Pin(λ)) and OUT waveform (Pout(λ)) are gathered, to calculate the gain and noise figure. - Page 230 Chapter 5 Measurement Functions ISS Method: Off Calculation Method This performs the following calculation when the IN waveform (Pin(λ)) and OUT waveform (Pout(λ)) are gathered, to calculate the gain and noise figure. (1) For the IN waveform The peak is detected in accordance with the peak detection setting (S.Level, Search Threshold), and the peak wavelengths (W ) and i..n...
- Page 231 Measuring Optical Amplifier (Wavelength Division Multiplex) The actual resolution for each signal is obtained as follows based on the values obtained in 1. and 2. Actual Resolution Same value Same value Same value Wavelength (nm) Figure 5.8.4-1 Integration Range for Signals in Multiple Channels Auto Auto (Res)
- Page 232 Chapter 5 Measurement Functions Correction value set by NF Cal λsv Wavelength of optical signal in vacuum (nm) Δνs Frequency bandwidth of actual resolution at Pase measurement (Hz) Planck’s Constant 6.626 × 10 (J-s) –34 ν Frequency of optical signal (Hz) Actual resolution (nm) real Light velocity 2.9979 ×...
-
Page 233: Procedure
Press f2 Pout. Select the traces A to J to store the optical output waveform. Press f7 More 2/2. Input the output light of the optical amplifier to MS9740B as shown by the connection in Figure 5.8.5-1 (a). Set the wavelength, resolution, and level scale. - Page 234 Chapter 5 Measurement Functions 14. Input the output light of the optical amplifier to MS9740B as shown by the connection in Figure 5.8.5-1 (b). 15. Press Single or Repeat . The data for the trace specified at step 5 is stored.
- Page 235 Measuring Optical Amplifier (Wavelength Division Multiplex) 21. Press f7 Set to update the value in the measurement result display field. 22. If all of the wavelength data cannot be displayed onscreen, press f7 More 1/2, and f4 Next Page or f5 Last Page. 23.
-
Page 236: Measuring Wdm Filter
Chapter 5 Measurement Functions 5.9 Measuring WDM Filter The WDM filter is an optical filter that passes light having a wavelength defined in ITU-T. The WDM filter function is used to measure the following items: ● CH Wl (nm): Reference wavelength of signal* ●... -
Page 237: Wdm Filter Transmission Characteristics Measurement Method
Measuring WDM Filter 5.9.1 WDM Filter Transmission Characteristics Measurement Method A light source with a continuous spectrum, (for example, SLD (Super luminescent diode)), is required to measure the transmission characteristics of the WDM filter. The spectra of both of the light source and the light passed through the WDM filter are measured. -
Page 238: Wdm Filter Screen Display
Chapter 5 Measurement Functions 5.9.2 WDM Filter Screen Display To display the WDM filter measurement functions, When the name of the F7 horizontal key is not Application , press F8 , and then press F7 . Press f7 More 1/2 . Press f3 WDM Filter Test to display the WDM Filter Measurement screen. - Page 239 Measuring WDM Filter Table: Up to 16 measurement results for each waveform are displayed in one screen. Figure 5.9.2-2 Table Display Example 5-89...
-
Page 240: How To Set The Wdm Filter Measurement Method
Chapter 5 Measurement Functions 5.9.3 How to Set the WDM Filter Measurement Method Press f6 Test Parameter to display the Test Parameter dialog box. In the Test Parameter dialog box, set the detection method for WDM filter wavelength, and the detection level. Figure 5.9.3-1 Test Parameter Dialog Box Table 5.9.3-1 Setting Range of the Parameters in the Test Parameter Dialog Box... - Page 241 Measuring WDM Filter ● S.Level Set the range (dB) from the peak for detecting the signal passed through the WDM filter. Peaks having a level equal to or higher than the level lower than the maximum peak by the amount of the S.Level value are detected as the WDM filter signal.
- Page 242 Chapter 5 Measurement Functions When Peak is selected When Threshold is selected When RMS is selected Cut Level Calculation Cut Level Range Threshold Level CH Wl: CH Wl: CH Wl: Peak Wavelength Center Wavelength at the Calculated Wavelength Threshold Level Figure 5.9.3-3 Measurement Method for Signal Wavelength ●...
- Page 243 Measuring WDM Filter CH Wl Pass-Band Span Cut Level Cut Level Pass Band Figure 5.9.3-4 Measurement Method for Bandwidth ● Level Set the level measurement method for signal spectrum. For details, refer to “Level” in 5.5.2, “How to Set the Signal Measurement Method”. ●...
-
Page 244: Procedures
Trace B is saved as Trace C. The WDM filter analysis is performed on the waveform of Trace C. When measuring the WDM filter, use a light source having a broadband spectrum and a good level stability. MS9740B Optical Spectrum Optical Adapter Analyzer... - Page 245 Measuring WDM Filter 13. Specify the formula for calculating Trace C as follows: Trace B - Trace A. The data of the WDM-filtered waveform is saved to Trace C. To measure the WDM filter When the name of the F7 horizontal key is not Application, press F8, and then press F7.
- Page 246 Chapter 5 Measurement Functions 5-96.
-
Page 247: Setting Operating Environment
Chapter 6 Setting Operating Environment This chapter explains the methods for setting and checking the instrument data as well as managing files and updating software. Setting and Checking Instrument Data ......6-2 6.1.1 Setting Interfaces and File Operating Environment ......6-2 6.1.2 Checking Instrument Data ....... -
Page 248: Setting And Checking Instrument Data
Move between setting items using the arrow keys and select the setting. GPIB Settings: This is displayed when the GPIB option is added. The MS9740B GPIB address can set in the range of 1 to 30 using a rotary knob. Ethernet Settings: IP Address:... - Page 249 Setting and Checking Instrument Data Press f7 Set to change the GPIB address and communication data terminator to the values set at step 2. Figure 6.1.1-1 Interface Settings Dialog Box...
- Page 250 Chapter 6 Setting Operating Environment To set and check the method for saving the display file saved by the Copy key: Press f2 Copy Settings. The dialog box shown in Figure 6.1.1-2 is displayed. Move between setting items using the arrow keys and select the setting.
- Page 251 Setting and Checking Instrument Data Figure 6.1.1-2 Copy Setting Dialog Box To set and check the operation sounds: Press f3 System Settings. The dialog box shown in Figure 6.1.1-3 is displayed. Beep Sound Settings: This sets the operation sounds on and off using arrow keys. Operation sound at message display No operation sound at message display Off:...
- Page 252 Chapter 6 Setting Operating Environment Figure 6.1.1-3 System Settings Dialog Box...
-
Page 253: Checking Instrument Data
Setting and Checking Instrument Data 6.1.2 Checking Instrument Data The following information can be checked. ● Serial number ● Software version ● Optical unit version ● Package version ● Software license ● Option To confirm this information, press F8 to display Config to the horizontal function key, and then press F6. -
Page 254: Resetting System Data
A system reset is executed by selecting Reset with the arrow keys and pressing Enter. Select Cancel and press Enter to cancel System Reset. The MS9740B shuts down after resetting the system. Turn on the power again to continue measurement. -
Page 255: Managing Files
Managing Files 6.2 Managing Files The following operations can be performed on measurement result files and system data files. ● Copy ● Move ● Delete ● Setting and releasing write protection To display file operation screen, press F8 and display Config on the horizontal function keys. - Page 256 Chapter 6 Setting Operating Environment (c) To copy a file that is not on drive D to the internal hard disk:, press f5 Copy to HDD. A message is displayed to confirm the file copied. Select Copy with the arrow keys and press the Enter key to delete the file.
-
Page 257: Updating Software
Press f8 More 1/2. Press f1 Software Install. To update software Connect the USB memory for installation to the MS9740B. The updating software window is displayed. Press f1 Software Install to open the drive selection screen. Select the USB memory drive using the arrow keys, and press f7 Set. - Page 258 Files saved to drive D: are not erased or changed by updating software. To update software license Connect the USB memory for installation to MS9740B. The updating software window is displayed. Press f3 Software License Install to open the drive selection window.
- Page 259 Updating Software Note: When the software version saved in the USB memory for installation is the same as the currently installed software version, pressing f1 Install displays the password inputting window. When installation is continued, enter “ms9740a_osa” using the key board. Select Next using the key board or mouse and press Enter.
- Page 260 Chapter 6 Setting Operating Environment The message is displayed after uninstallation is completed. Select Finish and press Enter. Display the USB memory folder (E:\Anritsu Corporation\Optical Spectrum Analyzer\Install). Double-clicking Setup.exe starts installation. After installation is complete, the power is turned off automatically.
- Page 261 7.2.2 Level Accuracy ..........7-6 7.2.3 Dynamic Range ..........7-7 Replacement of Optical Connector ......7-8 Optical Connector/Optical Adapter Cleaning ....7-10 Daily Maintenance ............ 7-14 Cautions on Storage MS9740B for Extended Period . 7-15 Transporting and Disposal ........7-16 Troubleshooting ............7-17...
-
Page 262: Calibration
The following two items should be calibrated by the user: ‐ Wavelength accuracy ‐ Level accuracy The MS9740B requires calibration of performance once or twice a year. Contact Anritsu Customer Service for periodic calibration of performance. -
Page 263: Performance Test
● Dynamic Range (Refer to 7.2.3) Clean all optical connectors before testing performance. Warm MS9740B up for at least two hours, and then calibrate it, before running performance tests. For details on the calibration, refer to 3.1 “Calibrating Before Measurement”. The Repeat sweeping should be performed at Span 100 nm or more and VBW 10 kHz or more during the warm-up operation. - Page 264 Chapter 7 Performance Test and Maintenance Table 7.2-1 Measurement Instrument List for Performance Test Measurement Recommended Model Test Item Required Performance Instrument (Model Name) Wavelength Wavelength Wavelength range: 1520 to 1620 nm 8164B+81606A accuracy tunable laser Setting resolution: 1 pm (Keysight Technologies) source Wavelength stability: ±1pm...
-
Page 265: Wavelength Accuracy
Set the wavelength of the tunable laser source to 1550.00 nm. Measure the wavelength with a wavelength meter and record it. Set the following values to the MS9740B, and press Single. Center 1550 nm, Span 1 nm, Res 0.05 nm Sampling Points 1001 Press Peak Search. -
Page 266: Level Accuracy
Analyzer Figure 7.2.2-1 Level Accuracy Test Setup Test using the following procedures. Connect the MS9740B and the wavelength tunable laser source as shown in Figure 7.2.2-1. Set the wavelength of the light source and optical power meter to 1550 nm. -
Page 267: Dynamic Range
Analyzer Figure 7.2.3-1 Dynamic Range Performance Test Setup Perform the test as follows: Connect the test equipment to the MS9740B as shown in Figure 7.2.3-1. Adjust the wavelength tunable laser source to 1550 nm. Set the output of the wavelength tunable laser source to On. -
Page 268: Replacement Of Optical Connector
Chapter 7 Performance Test and Maintenance 7.3 Replacement of Optical Connector The standard optical connector is the FC type. The optical connector of the plug-in unit and pull-out type optical sensor can be removed and replaced with another connector (sold separately), and its interior can be cleaned. - Page 269 Replacement of Optical Connector To remove the optical connector: Open the cover. Pull up the connector lever toward you. Check that the latch has been released, and then gently pull the connector out straight toward you. Lever Cover Latch Figure 7.3-2 How to Remove the Optical Connector...
-
Page 270: Optical Connector/Optical Adapter Cleaning
Chapter 7 Performance Test and Maintenance 7.4 Optical Connector/Optical Adapter Cleaning Cleaning the Ferrule End Surface Use an approved adapter cleaner to clean the ferrule end surface in the optical connector. The ferrule in the optical connectors needs periodic cleaning. Although the following procedures use the FC connector and adapter as an example, use the same methods when cleaning other connector and adapter types. - Page 271 Optical Connector/Optical Adapter Cleaning Press the tip of a new (dry) adapter cleaner into the ferrule end surface and then wipe in one direction 2 or 3 times to dry the surface. Figure 7.4-3 Cleaning the Ferrule End Surface 3 Clean the adapter interior with adapter cleaner.
- Page 272 Chapter 7 Performance Test and Maintenance Cleaning the Optical Fiber Cable Ferrule End Surface Use an approved ferrule cleaner to clean the optical fiber cable ferrule of the end surface. Although the following procedures use the FC connector and adapter as an example, use the same methods when cleaning other connector and adapter types.
- Page 273 Check that no light is being emitted when cleaning and checking the ferrule end surface. CAUTION The MS9740B may not satisfy performance when used with dirt or dust adhering to the ferrule end surface. In addition, the connected fiber and/or the MS9740B ferrule end surface may be burned if high output light is emitted in this state.
-
Page 274: Daily Maintenance
Chapter 7 Performance Test and Maintenance 7.5 Daily Maintenance Before daily maintenance of the MS9740B, be sure to turn the power off and unplug it from the AC outlet. Panel surface dirt When surface dirt is noticeable, after the MS9740B has been used in a... -
Page 275: Cautions On Storage Ms9740B For Extended Period
90% or more Recommended storage conditions It is recommended that the MS9740B be stored in a place that meets the ambient conditions suggested above, plus the following conditions, if it is not to be used for a long period of time: ●... -
Page 276: Transporting And Disposal
Wrap the MS9740B in plastic or a similar material to avoid water droplets and dust. Put the MS9740B in the box. Pack the MS9740B in cushioning material so it does not move in the box. 5. Secure the outside of the box with packing cord, adhesive tape, bands, or other similar materials. -
Page 277: Troubleshooting
Check the items in Table 7.8-1 if a failure occurs during operation of the MS9740B. If the failure is not improved, contact an Anritsu Service and Sales office immediately. Contact information can be found on the last page of the printed version of this manual, and is available in a separate file on the PDF version. - Page 278 Chapter 7 Performance Test and Maintenance Table 7.8-1 Check Item (Cont'd) Phenomenon Possible cause Action Incorrect measured Incorrect resolution Set a small resolution for light sources with a spectrum waveform narrow spectrum like LDs. Too many smoothing points Set smoothing to Off or reduce the number of smoothing points Displaying memory Set the trace display to Wri.
- Page 279 Troubleshooting Table 7.8-1 Check Item (Cont'd) Phenomenon Possible cause Action Cannot save File set to read only Change the file properties. measurement data Storage device Remove the write protection. write-protected Destination folder set to read Change the folder properties. only Incorrect date and Windows time clock set Open the Windows Control Panel,...
- Page 280 Chapter 7 Performance Test and Maintenance 7-20.
-
Page 281: Appendix A Specifications
Specifications Model Name MS9740B Optical Spectrum Analyzer Configuration -Main Frame- MS9740B Optical Spectrum Analyzer -Option- MS9740B-001/101/201 GPIB Interface MS9740B-002/102/202 Light Source for Wavelength Calibration MS9740B-108/208 OS Upgrade to Win10 Retrofit -Connector Options- MS9740B-037 FC Connector MS9740B-038 ST Connector MS9740B-039 DIN Connector... - Page 282 Appendix A Specifications Table A.1-2 Optical Characteristics* Item Specifications Applicable optical fiber SM fiber (ITU-T G.652), GI fiber (50/125 µm), PC Connector (return loss 40 dB or more when connected) SM/GI fiber described hereafter means this specified fiber. Wavelength Wavelength range 600 nm to 1750 nm Wavelength sweep 0.2 nm to 1200 nm, 0 nm...
- Page 283 Specifications Table A.1-2 Optical Characteristics* (Cont'd) Item Specifications Level Measurement level* When optical attenuation is Off: 5 to 30°C –65 to +10 dBm ( 600 to 1000 nm) –85 to +10 dBm (1000 to 1250 nm) –90 to +10 dBm (1250 to 1600 nm) –85 to +10 dBm (1600 to 1650 nm)
- Page 284 Appendix A Specifications Table A.1-2 Optical Characteristics* (Cont'd) Item Specifications Level (Cont’d) Dynamic range* High dynamic 70 dB range mode At ±1 nm from peak wavelength 60 dB At ±0.4 nm from peak wavelength 42 dB At ±0.2 nm from peak wavelength Normal dynamic 62 dB range mode...
- Page 285 –40 dBm/nm or more Reference wavelength light, reference light, 10 to 30°C, 1550 ±20 nm, 1 nm setting resolution Output level stability ±0.04 dB 10 minutes after setting output On using MS9740B and measured under following conditions: Measurement Wavelength: 1550 nm Measurement Resolution:...
- Page 286 Appendix A Specifications Table A.1-4 Function Item Specification Measurement function Automatic measure, Pulse light measurement (external trigger), Power monitor Display functions Overlap, Normalized, Max Hold, Value in Air/Vacuum, Effective Resolution Analysis functions Wavelength Subtraction, Marker, Wavelength Analysis (Threshold, ndB-Loss, Envelope, RMS, SMSR, Spectrum Power), Light Source Evaluation (FP-LD, DFB-LD, LED), Optical AMP NF Evaluation,...
- Page 287 75 VA max. Temperature/ Operating temperature: 5 to 45°C Humidity Storage Temperature: –20 to 60°C Humidity: 0 to 90% (no condensation) Laser safety* IEC 60825-1/JISC6802 Class 1 FDA 21 CFR 1040.10 Class I When MS9740B-002 Light Source for Wavelength Calibration is installed.
- Page 288 Z0541A USB mouse B0640C* Carrying Case B0641A Rack Mount Kit B0671A Front Cover for 1MW4U W3998AE MS9740B Optical Spectrum Analyzer Operation Printed version Manual (English) W3999AE MS9740B Optical Spectrum Analyzer Remote Printed version Control Operation Manual (English) Front panel protective cover attached...
-
Page 289: Appendix B Initial Values
Appendix B Initial Values Table B-1 Wavelength Item Initial value Center 1350.00 nm Span 500.0 nm Start 1100.00 nm Stop 1600.00 nm Mkr Value Wl/Freq Value in Air/Vacuum Vacuum Table B-2 Level Scale Item Initial value Scale Select Log (/div.) 10.0 dB/div. - Page 290 Appendix B Initial Values Table B-5 Analysis Item Initial value Status Threshold Cut Lvl: 3.0 dB ndB Loss ndB: 3.0 dB SMSR Side mode: 2nd Peak Envelope Cut Lvl: 3.0 dB Kσ: 2.35 σ S-Level: 20.0 dB Table B-6 Trace Item Initial value Active Trace...
- Page 291 Appendix B Initial Values Table B-7 Application - DFB-LD Test Item Initial value Slice Level 20.0 dB Side Mode 2nd Peak Search Resolution 2.0 dB Kσ 6.07 σ ndB Width 20.0 dB Table B-8 Application - FP-LD Test Item Initial value Slice Level 3.0 dB Table B-9 Application - LED Test...
- Page 292 Appendix B Initial Values Table B-11 Application - WDM Test – Multi Peak Item Initial value Display Mode Signal Parameter S.Level 30.0 dB Search Threshold 0.10 dB Wavelength Peak Detection Type Threshold Cut Level 3.0 dB Level Detection Type Point Signal Span 0.40 nm Noise Parameter...
- Page 293 Appendix B Initial Values Table B-12 Application - LD Module Test Item Initial value Slice Level 20.0 dB SMSR Parameter 2nd Peak Kσ 6.07 σ Search Resolution 2.0 dB ndB Width 20.0 dB Signal Parameter Wavelength Peak Detection Type Threshold Cut Level 3.0 dB Level Detection Type Point...
- Page 294 Appendix B Initial Values Table B-13 Application - Opt .AMP Test Item Initial value Method Spect Div On Write to Pin/Pout Pout Pase NF Select S-ASE ASE Fitting Gauss Fit Fitting Span 5.00 nm Masked Span 2.00 nm Pin Loss 0.00 dB Test Pout Loss 0.00 dB...
- Page 295 Appendix B Initial Values Table B-14 Application - Opt .AMP Multi Test Item Initial value ISS Method Channel Parameter S.Level 30.0 dB Search Threshold 0.10 dB Wavelength Peak Detection Type Threshold Cut Level 3.0 dB Opt .Amp Test Parameter Detection Type Point Fitting Curve Display Area...
- Page 296 Appendix B Initial Values Table B-15 Application – WDM Filter Item Initial value S.Level 30.0 dB Search Threshold 0.10 dB Channel Detection Type Peak Cut Level 3.0 dB Threshold Wavelength Cut Level A 3.0 dB Cut Level B 20.0 dB BW/Pass Band Analysis Type Cut Level A...
- Page 297 Appendix B Initial Values Table B-16 Measure Mode Item Initial value Dynamic Range Norm/Hi Norm Ext Trigger Delay Interval Time Power Monitor MM Mode Table B-17 Others Item Initial value Optical Output On/Off Title Optical Spectrum Analyzer Table B-18 Cal Item Initial value Wl Offset...
- Page 298 Appendix B Initial Values Table B-20 Marker Item Initial value λMkr_A Off, 1100.0000 nm λMkr_B Off, 1600.0000 nm LMkr_C Off, 20.000 dBm LMkr_D Off, –30.000 dBm TMkr Off, 1100.0000 nm ΔMkr Off, 1100.0000 nm Table B-21 Zone Marker Item Initial value Zone Center Off, 1350.000 nm Zone Width...
-
Page 299: Appendix C Message List
Appendix C Message Lists Table C-1 Error Message List Message Phenomenon Auto CAL failed Automatic wavelength calibration failed due to changes in temperature and pressure. Auto Cal in progress Automatic wavelength calibration is executing. Auto Measure finished unsuccessfully Automatic wavelength calibration was not completed successfully. - Page 300 Appendix C Message Lists Table C-1 Error Message List (Cont'd) Message Phenomenon Input title There is no file name. Input the file name. Input value out of range The input value is outside the setting range. Invalid In Sweep-Average Execution is not supported while the Sweep Average function is selected.
- Page 301 Appendix C Message Lists Table C-1 Error Message List (Cont'd) Message Phenomenon Operation prohibited when Area specified as The operation cannot be executed while Noise Detection Type. Detection Type for Noise Parameter is Area Operation prohibited when Auto Cal is On. Zero The operation cannot be executed while Auto Cal cannot be executed.
- Page 302 An abnormality occurred at optical axis auto adjustment at start-up. Optical Unit failed calibration data test There was a fault in the calibration data at Contact Anritsu or representative. start-up. Optical Unit failed FPGA data test There was a fault in the FPGA data at start-up.
- Page 303 Appendix C Message Lists Table C-1 Error Message List (Cont'd) Message Phenomenon Save file name not specified The file name to be saved is not specified. Selected item is empty. There is no file on the specified device. Selected TCP Port Number busy The selected TCP port number is in use.
- Page 304 Appendix C Message Lists C-6.
-
Page 305: Appendix D Keyboard And Mouse Operations
Appendix D Keyboard and Mouse Operations A keyboard and mouse can be connected to this equipment. Table D-1 shows the responses of the panel keys and keyboard. Table D-2 shows the response of the panel keys and mouse. Table D-3 shows the response of the rotary knob and mouse. Shift + F1 in the table means that the Shift key and F1 key are pressed simultaneously. - Page 306 Appendix D Keyboard and Mouse Operations Table D-1 Responses of the Panel Keys and Keyboard(Cont'd) Panel key Keyboard Remarks Shift + F1 Shift + F2 Shift + F3 Shift + F4 Shift + F5 Shift + F6 Shift + F7 Shift + F8 Local Ctrl + Alt + Q...
- Page 307 Appendix D Keyboard and Mouse Operations Table D-2 Response of the Panel Keys and Mouse Panel key Mouse Remarks Right-click Select from menu Auto Measure Right-click Select from menu Local Right-click Select from menu Preset Right-click Select from menu Recall Right-click Select from menu Repeat...
- Page 308 Appendix D Keyboard and Mouse Operations D-4.
-
Page 309: Appendix E Video Band Width And Sweep Time
Appendix E Video Band Width and Sweep Time Table E-1 shows the relationship between VBW, sweep time and minimum optical reception sensitivity. Table E-1 shows the reference value. These values are not guaranteed in the specification values. Table E-1 Relationship between VBW, Sweep Time and Minimum Optical Reception Min. - Page 310 Appendix E Video Band Width and Sweep Time Note: Even if VBW is set at 1 kHz Fast or 200 Hz Fast, when one of the following conditions is met, the sweep speed is the same as when VBW is set at 1 kHz or 200 Hz: ●...
-
Page 311: Appendix F Performance Test Result Form
Appendix F Performance Test Result Form Document number: Test Location: Date: Test person in charge: Product name: MS9740B Optical Spectrum Analyzer Serial number: Software version: Option: Power voltage: Power frequency: Ambient temperature °C Relative humidity Instruments used: Model name Serial number... - Page 312 Appendix F Performance Test Result Form F.1 Wavelength Accuracy Table F.1-1 Wavelength Accuracy (When installing MS9740B-002) Setting Resolution: Light Source Wavelength Measurement Minimum Maximum Settings meter Result value value value Wavelength Display value 1520.00 nm –20 pm +20 pm 1530.00 nm –20 pm...
- Page 313 Wavelength Accuracy Table F.1-2 Wavelength Accuracy (When not installing MS9740B-002) Setting Resolution: Light Source Wavelength Measurement Minimum Maximum Result Settings meter value value value Wavelength Display value 1520.00 nm –200 pm +200 pm 1530.00 nm –200 pm +200 pm 1540.00 nm –200 pm...
- Page 314 Appendix F Performance Test Result Form F.2 Level Accuracy Table F.2-1 Level Accuracy Setting Resolution: Light Source Power Meter Measurement Minimum Maximum Result Wavelength Display Value Value value value –0.4 dB +0.4 dB –0.4 dB +0.4 dB...
- Page 315 Dynamic Range F.3 Dynamic Range Table F.3-1 Normal Dynamic Range Mode ∆ Marker Measurement Measurement Minimum Value Result Setting Value Uncertainty Wavelength +0.2 nm 42 dB 1 dB +0.4 nm 58 dB 1 dB +1.0 nm 62 dB 1 dB –0.2 nm 42 dB 1 dB...
- Page 316 Appendix F Performance Test Result Form F-6.
-
Page 317: Appendix G Excel Macro
Appendix G Excel Macro from files saved in csv format. This macro has been confirmed to work with Microsoft Excel 2010. Reading csv file (a) Click File – Open… at the Excel menu. (b) Change the file type at the Open File window to a text file. (c) Choose the saved csv file and click Open. - Page 318 Appendix G Excel Macro Input the macro. (a) Click Developer – Visual Basic at the Excel menu. (b) Click Insert – Module from the Visual Basic for Application menu. Module1 is added. (c) Copy the macro from the following pages and paste it into the Module1 (code) window.
- Page 319 Appendix G Excel Macro Sub Macro1() 'Define variables Dim Start_Wl, Stop_Wl, Smple_Cnt, VB_Val As Single Dim Data_Area, File_name, Date_time, Row_shift As String Dim Value_Sw, RBW, Act_RBW, VBW, Smpl_Num As String Dim Avr_Sw, Smooth_Sw, OptATT_Sw, D_Range_SW As String Dim Trc_Type, Trc_Mode, Ext_trg, Interval_t As String Dim Trc_Cal, Trc_num, MM_mod As String ' Storing value to variables File_name = Sheets("Sheet1").Range("B1")
- Page 320 Appendix G Excel Macro Interval_t = Sheets("Sheet1").Range("A24") & " " & _ Sheets("Sheet1").Range("B24") MM_mod = Sheets("Sheet1").Range("A25") & " " & Sheets("Sheet1").Range("B25") Trc_num = Sheets("Sheet1").Range("A4") & " " & Sheets("Sheet1").Range("B4") Set FoundCell = Cells.Find(What:="Level(?)") Row_shift = FoundCell.Row 'MsgBox "Level(?) is row " & FoundCell.Row & ".", vbInformation Data_Area = "A"...
- Page 321 Appendix G Excel Macro Data_Area = "A29:B" & LTrim(Str(28 + Smple_Cnt)) End If ' Creating Graph Charts.Add ActiveChart.ChartType = xlXYScatterLinesNoMarkers ActiveChart.SetSourceData Source:=Sheets("Sheet1").Range(Data_Area), PlotBy _ :=xlColumns ActiveChart.Location Where:=xlLocationAsNewSheet ActiveChart.SeriesCollection(1).Name = Trc_num ActiveChart.PlotArea.Select Selection.Width = 600 Selection.Height = 370 Selection.Left = 50 Selection.Top = 55 With ActiveChart .HasTitle = True...
- Page 322 Appendix G Excel Macro .MajorUnit = .MaximumScale / 2 .Crosses = xlCustom .CrossesAt = 0 .ReversePlotOrder = False .ScaleType = xlLinear .DisplayUnit = xlNone End With ActiveChart.Axes(xlCategory).Select ActiveChart.PlotArea.Select With Selection.Border .ColorIndex = 16 .Weight = xlThin .LineStyle = xlContinuous End With Selection.Interior.ColorIndex = xlNone Application.CalculateFull ActiveChart.Axes(xlValue).MinorGridlines.Select...
- Page 323 Appendix G Excel Macro With ActiveChart.TextBoxes.Add(10, 420, 56, 15) .Select .AutoSize = True .Text = RBW End With "Text 3" With ActiveChart.TextBoxes.Add(140, 420, 56, 15) .Select .AutoSize = True .Text = Act_RBW End With "Text 4" With ActiveChart.TextBoxes.Add(480, 420, 55, 15) .Select .AutoSize = True .Text = Value_Sw...
- Page 324 Appendix G Excel Macro "Text 9" With ActiveChart.TextBoxes.Add(290, 24, 54, 15) .Select .AutoSize = True .Text = OptATT_Sw End With "Text 10" With ActiveChart.TextBoxes.Add(410, 24, 54, 15) .Select .AutoSize = True .Text = D_Range_SW End With "Text 11" With ActiveChart.TextBoxes.Add(530, 24, 56, 15) .Select .AutoSize = True .Text = Ext_trg...
- Page 325 Appendix G Excel Macro With ActiveChart.TextBoxes.Add(635, 295, 54, 15) .Select .AutoSize = True .Text = Trc_Cal End With End If "Text 16" With ActiveChart.TextBoxes.Add(635, 320, 80, 30) .Select .AutoSize = False .Text = MM_mod End With End Sub...
- Page 326 Appendix G Excel Macro Figure G-3 Macro Performance Result G-10.
-
Page 327: Appendix H Bibliography
Appendix H Bibliography Information technology - Generic cabling for customer (1) IEC11801 premises Discrete semiconductor devices and integrated circuits (2) IEC60747-5-3 - Part 5-3: Optoelectronic devices - Measuring methods Optical fibres - Part 1-44: Measurement methods and (3) IEC60793-1-44 test procedures - Cut-off wavelength Optical fibres - Part 1-48: Measurement methods and (4) IEC60793-1-48 test procedures - Polarization mode dispersion... - Page 328 Spectral grids for WDM applications: DWDM (21) ITU-T G.694.1 frequency grid Spectral grids for WDM applications: CWDM (22) ITU-T G.694.2 wavelength grid Optical monitoring for dense wavelength division (23) ITU-T G.697 multiplex systems Amplifier (EDFA) Characteristics (24) Anritsu Corporation Optical Evaluation https://www.anritsu.com/en-us/test-measurement/support/downloads /application-notes/dwl009208 H-2.
- Page 329 Index References are to page numbers. Calibration ..........1-7, 7-2 Symbol and Numbers Cautions on Handling Optical Fiber Cables 2-12 Cautions on Storage ........7-15 ∑ Center ............4-2 ΣPower ..........5-23, 5-37 Center Offset ..........5-43 μ CH Lvl ............5-86 CH Wl ............
- Page 330 Index Display ............4-25 Inputting Title to Waveform Data ....4-31 Display Mode ..........5-68 Installation ............ 2-3 Displaying Level Peaks and Dips ....4-11 Intended Use ..........1-6 Displaying Windows Desktop .......2-21 Interface Setting ..........6-2 Disposal ............7-16 Interval Time ..........4-29 Dynamic Range ......
- Page 331 Index Measuring FP-LD .......... 5-7 Noise BW..........5-25 Measuring Laser Diode Modules ....5-33 Noise Span ..........5-39 Measuring LED ..........5-10 Normalization .......... 5-25 Measuring Optical Amplifier ......5-47 Point ..........5-26, 5-41 (Wavelength Division Multiplex) ....5-67 User Specify ........5-27, 5-42 Calculation Method ........5-64 Noise Position ........5-25, 5-40 Polarization Nulling Method ....5-56 Normal ............
- Page 332 Index Peak Count .......... 5-14, 5-86 Responses of the Panel Keys and Keyboard .. D-1 Peak Search ......... 3-20, 4-11 Ripple............5-86 RMS ............. 4-18 Peak/Dip Search ........4-11, B-1 Peak->Ref Lvl ..........3-15 Rotary knob ..........3-12 Peaks Targeted for Analysis ......5-72 Performance Test ..........
- Page 333 Index Spect Div Off .........5-4, 5-47 Spect Div On ..........5-48 Unpacking ............. 2-2 Spectrum Division Calculation Method ..5-66 Updating Software ........6-11 Spectrum Power ...........4-20 Using external display......... 2-25 Start............... 4-3 Using Light Source Option ......4-32 Stop ............3-13, 4-3 Using Wavelength and Level Markers ..
-
Page 334: Index
Index Index-6.
Need help?
Do you have a question about the MS9740B and is the answer not in the manual?
Questions and answers