Table of Contents
Advertisement
Quick Links
Advertisement
Chapters
Table of Contents
Troubleshooting

Related Manuals for Anritsu ms9710b


Summary of Contents for Anritsu ms9710b
- Page 1 MS9710B Optical Spectrum Analyzer Operation Manual 14th Edition For safety and warning information, please read this manual before attempting to use the equipment. Keep this manual with the equipment. ANRITSU CORPORATION Document No.: M-W1283AE-14.0...
-
Page 2: Safety Symbols
Safety Symbols To prevent the risk of personal injury or loss related to equipment malfunction, Anritsu Corporation uses the following safety symbols to indicate safety-related information. Ensure that you clearly understand the meanings of the symbols BEFORE using the equipment. -
Page 3: For Safety
For Safety WARNING 1. ALWAYS refer to the operation manual when working near locations at which the alert mark shown on the left is attached. If the advice in the operation manual is not followed there is a risk of personal injury or reduced equipment performance. - Page 4 Calibration 6. The performance-guarantee seal verifies the integrity of the equipment. To ensure the continued integrity of the equipment, only Anritsu service personnel, or service personnel of an Anritsu sales representative, should break this seal to repair or calibrate the equipment. If the performance-guarantee seal is broken by you or a third party, the performance of the equipment cannot be guaranteed.
- Page 5 For Safety CAUTION Fuse Replacement 1. Always remove the mains power cable from the power outlet before replacing blown fuses. There is a risk of electric shock if fuses are replaced with the power cable connected. Always use new fuses of the type and rating specified on the rear panel of the instrument.
- Page 6 60825-1:2001 specifications, or as Class I according to the 21 CFR 1040.10:1995 specifications. These classes of lasers are safe under reasonably foreseeable operating conditions. Table 1 Standard name Model number IEC 60825-1 21 CFR 1040.10 MS9710B-03 Class 1 Class I MS9710B-04 Class 1 Class I MS9710B-05 Class 1...
- Page 7 For Safety Laser Radiation Markings...
- Page 8 Back-up Battery the memory. This battery must be replaced by service personnel when it has reached the end of its useful life; contact the Anritsu sales section or your nearest representative. Note: The battery used in this equipment has a maximum useful life of 7 years.
- Page 9 In addition, this warranty is valid only for the original equipment purchaser. It is not transferable if the equipment is resold. Anritsu Corporation will not accept liability for equipment faults due to unforeseen and unusual circumstances, nor for faults due to mishandling by the customer.
- Page 10 Reuse parts Anritsu group promotes recycling activities in order to reuse available resources and save energy. This product may use recycled parts (mechanical components) that conform to Anritsu’s quality standards.
- Page 11 2002/96/EC (the “WEEE Directive”) in European Union. For Products placed on the EU market after August 13, 2005, please contact your local Anritsu representative at the end of the product's useful life to arrange disposal in accordance with your initial contract and the local law.
- Page 12 CE Conformity Marking Anritsu affixes the CE Conformity marking on the following product(s) in accordance with the Council Directive 93/68/EEC to indicate that they conform to the EMC and LVD directive of the European Union (EU). CE marking 1. Product Model...
- Page 13 C-tick Conformity Marking Anritsu affixes the C-tick marking on the following product(s) in accordance with the regulation to indicate that they conform to the EMC framework of Australia/New Zealand. C-tick marking 1. Product Model Model: MS9710B Optical Spectrum Analyzer 2. Applied Standards...
- Page 14 Power Line Fuse Protection For safety, Anritsu products have either one or two fuses in the AC power lines as requested by the customer when ordering. A fuse is inserted in one of the AC power lines. Single fuse: Double fuse: A fuse is inserted in each of the AC power lines.
-
Page 15: About This Manual
About This Manual This manual explains the operation, calibration and maintenance of the MS9710B Optical Spectrum Analyzer. The basic functions and operations of this analyzer are outlined in Section 4 “Operation.” For an in-depth explanation of each menu screen refer to Section 5 “Explanation of Screens.”... -
Page 16: Table Of Contents
Contents For Safety ..............About This Manual ........... Section 1 Introduction ........... MS9710B Optical Spectrum Analyzer ......Main Functions ............Features ..............Standard Configuration ..........Options ................ Related Parts .............. Main Specifications ............. User Interface ............. 1-12 Section 2 Front and Back Panel Description .. - Page 17 Contents Section 4 Operation ..........Connecting Optical Fiber ..........Switching Power On ........... Basic Function and Example of the Operation ... Analyzing Measured Waveforms ........ 4-12 Saving and Recalling Measured Waveforms ..... 4-15 Printing Waveforms ............ 4-18 Measuring Modulated Light Using External Trigger Signal ..........
- Page 18 Contents Section 7 Maintenance and Troubleshooting ..Periodic Maintenance ..........Storage Precautions ........... Transporting ..............Troubleshooting ............Appendix ............. Appn-1 Appendix A Specifications ..........Appendix B Initial Settings ..........Appendix C Error Codes ............ Appendix D Relationship Between the Resolution, VBW, and Sensitivity ..........
-
Page 19: Section 1 Introduction
Section 1 Introduction This section is an outline of the MS9710B Optical Spectrum Analyzer and re- lated equipments. MS9710B Optical Spectrum Analyzer ..... Main Functions ..........Features ............Standard Configuration ........Options ............Related Parts ........... Main Specifications ......... User Interface ..........1-12... -
Page 20: Ms9710B Optical Spectrum Analyzer
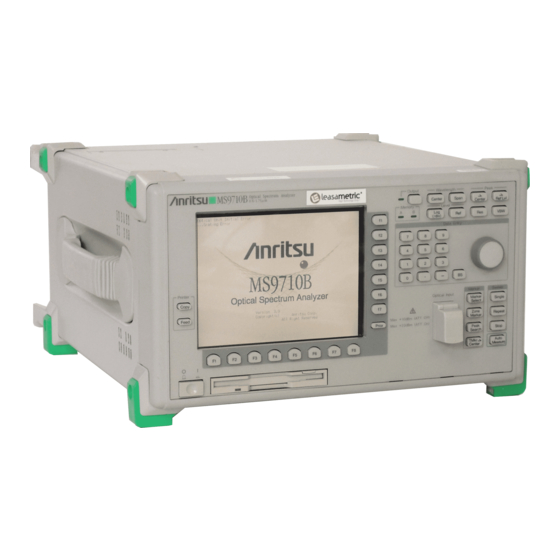
Section 1 Introduction MS9710B Optical Spectrum Analyzer The MS9710B Optical Spectrum Analyzer is a diffraction grating spectrum ana- lyzer. This rugged, compact unit is ideal for field as well as laboratory applica- tions, including: • characterization of LED’s, Fabry-Perot LDs, and DFB LDs •... -
Page 21: Main Functions
The measured data and waveform can be saved to floppy disk (hereinafter re- ferred as FD) in the MS9710B data format, MS-DOS text format, or MS-Win- dows bitmapped format. The text and bitmapped files can be easily incorpo-... -
Page 22: Features
(4) Spectrum peak detection and analysis with full lineup of built-in calcula- tion functions for evaluating many different device (5) Data saved to FD both in MS9710B format and MS-DOS text and MS- Windows bitmapped formats (6) External control via both GP-IB and RS-232C interfaces... -
Page 23: Standard Configuration
1.4 Standard Configuration Standard Configuration Standard Accessories of the MS9710B Optical Spectrum Analyzer • AC Power Cord • T3.15 Fuses Power Supply • Operation Manual (this manual) • Front Cover • Printer Paper • Remote Control Operation Manual • Labview Measuring Instruments Driver for RS-232C... -
Page 24: Options
Section 1 Introduction Options Two or more than two of those MS9710B-02, -05, -13, -14 optional equipments cannot be installed simultaneity. (1) MS9710B-02 White Light Source A low-cost white light source can be installed in the main unit for mea- surements not requiring wide dynamic range. -
Page 25: Related Parts
1.6 Related Parts Related Parts RS-232C Cable (9 P to 9 P) ........J0654A RS-232C Cable (9 P to 25 P) ........J0655A GPIB Cable ............... J0007 Replaceable Optical Connector • FC Connector ..........J0617B • ST Connector ..........J0618D •... -
Page 26: Main Specifications
Section 1 Introduction Main Specifications To obtain stable operation, allow at least 5 minutes to elapse after power-on. The following specifications are guaranteed 2 hours after power-on. If the in- strument is out-of-specification, perform automatic optical-axis alignment (Auto Align) and then keep the instrument at a constant temperature. Wl Cal (Ref) indicates calibration with the reference wavelength light source. -
Page 27: 1.7 Main Specifications
1.7 Main Specifications Level No Ref. Light Source With Ref. Light Source Measurement level Range 0 to 30°C 0 to 30°C (600 to 1000 nm) –65 to +10 dBm (1100 to 1600 nm) –70 to +20 dBm (1000 to 1250 nm) –85 to +10 dBm (1250 to 1600 nm) –90 to +10 dBm (1600 to 1700 nm) –75 to +10 dBm (1700 to 1750 nm) –55 to +10 dBm... - Page 28 Operation temperature 18 to 28°C SLD Light Source (Option 13 and 14) >–40 dBm (MS9710B Resolution: 1 nm, 1550 nm ±10 nm) Optical Output ±0.04 dB (for 20 min, 1550 nm of wavelength, with no Polarization drift, no Optical Output...
- Page 29 1.7 Main Specifications Dimensions and Mass Dimensions 177 (H) x 320 (W) x 350 (D) mm ≤16.5 kg Mass 1-11...
-
Page 30: User Interface
Section 1 Introduction User Interface The measurement settings of the MS9710B are screens from the displays called “cards” which can be flipped back and force like a stuck of cards. The cards are selected by pressing the card selection keys along the bottom of the screen. - Page 31 Section 5 “Explanation of Screens.” To improve the functionality, the MS9710B also has a number of keys corre- sponding to major functions called shortcut keys. These can select functions without using the cards.
- Page 32 Section 1 Introduction Prior Marker Select screen Prior Zone Marker screen 1-14...
-
Page 33: Section 2 Front And Back Panel Description
Section 2 Front and Back Panel Description This section describes each part of the front and back panels of the MS9710B Optical Spectrum Analyzer. Section 4 “Operation” gives examples of the main measurement functions. Section 5 “Explanation of Screens” gives a detailed explanation of how to use each card screen. -
Page 34: Unpacking
Remove the main unit and accessories from the packing case and check that all the parts described on the enclosed packing list are present. If anything is miss- ing or damaged, please contact Anritsu Corporation or your sales representative immediately. -
Page 35: Instrument Overview
2.2 Instrument Overview Instrument Overview This section describes the names and functions of each parts of the MS9710B. (6) Back panel (5) Printer (4) Handle (7) Optical input connector (8) Front panel (3) Copy key (2) Feed key (9) Floppy disk drive(FDD) - Page 36 Section 2 Front and Back Panel Description Power switch (2) Feed key Feed Feeds printer paper while pressed (3) Copy key Prints hard copy of screen to internal or external printer when pressed Copy Section 5.14 (4) Handles Handles are on each side of this analyzer for carriage Always carry this analyzer using both handles and keep this analyzer horizontal as much as possible.
-
Page 37: Front Panel
2.3 Front Panel Front Panel This section describes the names and functions of each parts on the front panel of the MS9710B. (2) Memory display (3) Optional light source On/Off keys (1) Screen Function keys (4) Shortcut keys MS9710B O p t i c a l S p e c t r u m A n a l y z e r... - Page 38 Section 2 Front and Back Panel Description (1) Screen In addition to displaying the measured spectrum, the screen displays the cards for selecting this analyzer’s functions. Eight cards of which names are aligned along the bottom of the screen can be displayed using the card selection keys .
-
Page 39: Back Panel
Back Panel This section describes the names and functions of each parts on the back panel of the MS9710B. The diagram below shows the back panel with all the options installed. When a light source is installed, a number of labels providing information about handling are attached to the back panel. - Page 40 Section 2 Front and Back Panel Description (1) GPIB interface connector This connector connects the external computer or printer. (2) RS-232C interface connector This connector connects the external computer, also used as dedicated interface for the MG9637/MG9638 in the tracking measurement. (3) External trigger input connector This connector inputs trigger signal for synchronizing modulation signals, etc.
-
Page 41: Screen Displays
2.5 Screen Displays Screen Displays The screen displays the following information. The Settings display field at the top right of the screen displays the current settings and is displayed when a numeric value is input. When the Settings display field is not displayed, the graph and trace status are displayed. -
Page 42: Shortcut Keys
Section 2 Front and Back Panel Description Shortcut Keys Center Sets Center wavelength Section 5.1 Span Sets Wavelength sweep width Section 5.1 Sets spectrum Peak point to Center wavelength Center Section 5.1 Sets level of spectrum Peak point to reference level Ref Lvl Section 5.2 Sets logarithmic unit... -
Page 43: Sweep Keys
2.8 Marker Keys Sweep Keys Single Executes one sweep measurement from Start wavelength to Stop wavelength Repeat Executes repeated sweep measurement from Start wavelength to Stop wave- length Stop Stops measurement Marker Keys Marker Displays Marker Selection screen Select Section 5.15 Zone Displays Zone Marker screen Marker... -
Page 44: Data Entry Keys And Knob
Section 2 Front and Back Panel Description Data Entry Keys and Knob Data entry keys Data Entry – Knob 2.9.1 Data Entry Keys The Data entry keys include the numerics 0 to 9 keys, the period (.) key, the minus (–) symbol key, and the backspace key (BS). They are used for inputting the wavelength and level as numeric values. -
Page 45: Knob
2.9 Data Entry Keys and Knob (3) The input value is confirmed when the units are selected and the new Cen- ter wavelength is displayed on the screen. (4) The set value can be changed until either another shortcut key is pressed or until a different function card is selected. - Page 46 Section 2 Front and Back Panel Description 2-14...
-
Page 47: Section 3 Preparations Before Use
Section 3 Preparations Before Use This section describes the preparations that must be made before using MS9710B Optical Spectrum Analyzer. These steps are important to ensure to keep this analyzer functions properly and safely. Installation Conditions ........Power Connection ........... -
Page 48: Installation Conditions
Section 3 Preparations Before Use Installation Conditions Orientation Use this analyzer in a horizontal position. MS9710C O p t i c a l S p e c t r u m A n a l y z e r O u t p u t W a v e l e n g t h P e a k 0 . -
Page 49: Power Connection
3.2 Power Connection Power Connection This section describes the procedures for supplying power. 3.2.1 Power Requirements For normal operation of the instrument, observe the power voltage range de- scribed below. Power source Voltage range Frequency 100 Vac system 100 to 120 V 47.5 to 63 Hz 200 Vac system 200 to 225 V... - Page 50 Section 3 Preparations Before Use CAUTION If an emergency arises causing the instrument to fail or malfunction, disconnect the instrument from the power supply by either turning off the power switch on the front panel (switch to the (O) side), or by pulling out the power cord or the power inlet.
-
Page 51: Vibration Precautions
3.4 Memory Vibration Precautions The heart of this analyzer is a diffraction grating with a precision on the order of several microns. When using, maintaining and transporting this analyzer, it is important to take precautions against excessive vibration and mechanical shock. Always carry this analyzer using both handles and keep the analyzer horizontal as much as possible. -
Page 52: Floppy Disk (Fd)
Section 3 Preparations Before Use Floppy Disk (FD) The MS9710B uses 3.5-inch FD to save data. When attempting to save data to a new FD, the FD must be formatted first. This analyzer formats FDs in the MS- DOS format. -
Page 53: Optical Attenuator
3.6 Optical Attenuator Optical Attenuator The optical attenuator can be switched between Insert (On) and Not insert (Off) by opening the Level Scale card and pressing the card selection key. When the attenuator is Off, the maximum input power is +10 dBm; when it is On, the maximum input power is +20 dBm. -
Page 54: Printer
Check that the printer paper roll is installed in the printer at the top left of the back panel. If the paper has run out, load more paper as described below. (1) On the upper side of the MS9710B, rotate the printer cover button clock- wise or counterclockwise to unlock the printer cover. - Page 55 3.7 Printer (4) Lift the paper roll lever. (5) Set the paper roll as shown below. Note the paper feed direction. Next, return the paper roll lever to its original position so that the paper roll is set straight against the printer head. Paper roll Paper roll lever Printer head...
- Page 56 Section 3 Preparations Before Use (8) Feed the end of the paper roll through the slit of the printer cover. (9) Return the printer cover back to its original position, and then lock it by rotating the printer cover button clockwise or counterclockwise. Slit CAUTION Only use the specified printer paper.
-
Page 57: Optional Light Sources
3.8 Optional Light Sources Optional Light Sources Wavelength Reference Light Source and SLD Light Source The level reference light (SLD light source) for measuring transmission charac- teristics is output from Port 1, and the reference light for wavelength calibration is output from Port 2. White Light Source The white light source has the following characteristics for applications not re- quiring high dynamic range. -
Page 58: Changing Optical Connector
Section 3 Preparations Before Use Changing Optical Connector 3.9.1 Replaceable Optical Connectors Unless otherwise specified, the FC connector (MS9710B-37) is supplied as the standard connector with the main unit. The following connectors are also avail- able and can be changed by the operator. Name... -
Page 59: Connectors Not Replaceable At User Site
3.9 Changing Optical Connector 3.9.2 Connectors not Replaceable at User Site Please contact your service representative for replacing the following connec- tors. Name Model E2000 (DIAMOND) Connector MS9710B-27 3-13... -
Page 60: Changing Fuses
Section 3 Preparations Before Use 3.10 Changing Fuses If a fuse blows, first find the reason why and perform the repair. Then change the fuse following the steps in the caution below. CAUTION 1. BEFORE changing a fuse, ALWAYS disconnect the power cord from the power outlet. -
Page 61: Section 4 Operation
Section 4 Operation This section describes the basic functions and how to operate the MS9710B Optical Spectrum Analyzer. It explains some measurement procedures as well as the composition of the operation panels and screens. Refer to Section 5 “Ex- planation of Screen” for more details on each screen. -
Page 62: Connecting Optical Fiber
Section 4 Operation Connecting Optical Fiber Open the cover of the optical input connector and connect the optical fiber to the connector. Optical Input Connector Optical Fiber CAUTION 1. Before connecting the optical fiber, always clean the end face of the fiber. In addition, periodically clean the end face of the socket in the optical input connector. -
Page 63: Switching Power On
ALWAYS either connect the green wire from the conver- sion adapter to ground, or ground the Frame Ground terminal on the back panel, BEFORE supplying power to the MS9710B. (2) Check that the power switch on the front panel is Off and plug the power cord into the power inlet on the back panel. -
Page 64: Basic Function And Example Of The Operation
Section 4 Operation Basic Function and Example of the Operation As an example of a basic operation, measurement of an LD light source is de- scribed. An FP-LD with a peak level of about –20 to –10 dBm in the 1.55 µm wavelength band is used. - Page 65 4.3 Basic Function and Example of the Operation Prior (5) Set the Span (sweep width) to 50 nm. Section 5.1 Either press the key to select the Wavelength card and press the Span function key , or press the Span key of shortcut keys.
- Page 66 Section 4 Operation (6) Set the Resolution to 0.1 nm. Section 5.3 Either press the key to select the Res/VBW/Avg card and press the Res function key , or press the Res key of shortcut keys. The current Resolution is displayed in the Settings display field. The value of Resolution can be selected from the Functions display field at right-hand side of the screen using function keys.
- Page 67 4.3 Basic Function and Example of the Operation (7) Set the Video Bandwidth (VBW) to 1 kHz. Section 5.3 Either press the key to select the Res/VBW/Avg card and press the VBW function key , or press the VBW key of shortcut keys.
- Page 68 Section 4 Operation (8) Execute the measurement. Section 2.7 Press the Single key of Sweep keys to execute one measurement sweep Single and display the measured waveform on the screen. Prior (9) Set the peak level wavelength as the Center wavelength. Section 2.6 Press the Peak→Center of shortcut key to set the wavelength at the peak...
- Page 69 4.3 Basic Function and Example of the Operation (10) Set the peak level as the reference level. Section 2.6 Press the Peak→Ref Level of shortcut keys to set the peak level to the Ref Lvl reference level. Prior...
- Page 70 Section 4 Operation (11) Set the Span (sweep width) to 20 nm. Section 5.1 Either press the key to select the Wavelength card and press the Span function key , or press the Span key of shortcut keys. Actual Span value of Span is displayed in the Settings display field.
- Page 71 4.3 Basic Function and Example of the Operation (13) Use the Repeat Sweep function. Section 2.7 Press the Repeat key of the Sweep keys to take measurements continu- Repeat ously using the Repeat Sweep function, and change measurement conditions during a Repeat Sweep to optimize the displayed trace. Alternatery, the Auto Measurement function can be used to quickly obtain the waveform.
-
Page 72: Analyzing Measured Waveforms
This section explains how to analyze the waveform obtained in the previous section. (1) Execute RMS analysis. The basic operation of RMS analysis, which is one of the Analysis function of the MS9710B, is as follows. Section 5.5 Press the key to select the Analysis card then press the RMS function . - Page 73 4.4 Analyzing Measured Waveforms (2) Execute Peak Search. Section 5.4 Find the Peak point of the waveform using Peak Search. Either press key to select the Peak/Dip Search card and press the Peak Search func- Peak tion key , or press the Peak Search key of shortcut keys.
- Page 74 Section 4 Operation (3) Use the Zone Marker. Section 2.8 and 5.16 Zone Press the Zone Marker key of shortcut keys to display the zone marker is Marker displayed on the screen. Press Zone Width function key to set the zone marker to a width of about 1 grid division on the screen, and use Zone Center function pressing the Zone Center function key to move the zone area on...
-
Page 75: Saving And Recalling Measured Waveforms
4.5 Saving and Recalling Measured Waveforms Saving and Recalling Measured Waveforms This section explains how to save and recall measured waveforms. (1) Format the Floppy Disk. This analyzer can save measured data to FD. In addition, previously saved data can be read and analyzed. Section 5.7 Before saving the waveform to FD, the FD must be formatted. - Page 76 Section 4 Operation (2) Save Measured Data. To save measured data, press key to select the Save/Recall card, and press the Save function key to input the file name or number. Section 5.7 Prior This example explains how to save the data to file number 1. When 1 is input as the file number, a file called “data001.dat”...
- Page 77 4.5 Saving and Recalling Measured Waveforms (3) Recall Saved Data. For an example of recalling data, recall the data saved in the example of (2) “Save Measured Data.” To recall saved data, press the to select the Save/ Recall card, and press the Recall function key .
-
Page 78: Printing Waveforms
Section 4 Operation Printing Waveforms When the Copy key is pressed, the screen displayed at that instant is Copy hard copied by either the internal printer or an external printer. A sample of printout is shown below. To set the print output destination, press the key to display Other card and press the Printer Prmtr function key to display the setting screen. -
Page 79: Measuring Modulated Light Using External Trigger Signal
(1) Use a signal generator (hereinafter referred as SG) that can output a TTL level modulation signal and connect the SG output to the external trigger input connectors of the light source (MG9001A) and the MS9710B. Con- nect the output of the light source to the optical input connector on the front panel of the MS9710B. -
Page 80: Peak Hold Measurement
Peak Hold measurement. (1) Connect the output of the light source to the optical input connector on the front panel of the MS9710B. (2) Press the to select the Measure Mode card and press Peak Hold func-... -
Page 81: Use Of The Optional Light Sources
4.9 Use of the Optional Light Sources Use of the Optional Light Sources There are four optional light sources, white light source, and wavelength refer- ence and SLD light sources. White Light Source (Option 02) This light source is light from a small halogen lamp coupled to the optical fiber and output. -
Page 82: Transmission Characteristics
(SLD output or wavelength reference output), and turn on the optical light source On/Off switch on the front panel. An external light source can be used for measurement. Optical Input Terminal Light MS9710B Source Fig. 4-1 Measuring Measurement System Optical Input Terminal Light... -
Page 83: Tracking Measurement
The MG9637/MG9638 tunable light source can be used for tracking measure- ment in combination with the MS9710B. The tracking measurement and output wavelength of the tunable light source is controlled by the MS9710B; the side sending the set wavelength (MG9637/MG9638) and the receiving side (MS9710B) can perform synchronized measurement. -
Page 84: Execute Tracking Wavelength Calibration (Adjust To Tls)
Calibrate the tracking wavelength of the MS9710B and the MG9637/MG9638. Connect the MS9710B and the MG9637/MG9638 directly with an optical fiber cord. After setting the Center wavelength of the MS9710B to the Center wave- length to be measured, press the... -
Page 85: Tracking Measurement
4.11 Tracking Measurement 4.11.4 Tracking Measurement Now, necessary setup has been completed for the tracking measurement. Refer to Section 4.10. “Transmission Characteristics” for more details on measure- ment of transmission. An example of filter measurement by tracking measurement is as shown below. Prior Note that during tracking measurement, the Auto measurement and the W1 Off- set function key... - Page 86 Section 4 Operation 4-26...
-
Page 87: Section 5 Explanation Of Screens
Section 5 Explanation of Screens This section explains how to select functions of MS9710B Optical Spectrum Analyzer from its screens. The most-commonly-used functions have dedicated keys (shortcut keys) on the front panel. This analyzer has a number of function screens each called a “card”, that are switched using the card selection keys. - Page 88 Section 5 Explanation of Screens <Foreground cards> The tabs of Foreground cards appear at the bottom of the MS9710B screen. The Background cards are displayed by pressing the key to select the change button Prior Setting Wavelength (Wavelength Card ) .......
- Page 89 Peak/Dip Search (Peak/Dip Search Card ) ....5-22 5.4.1 Searching for Peak Points (Peak Search ) ..5-22 5.4.2 Searching for Dip Points (Dip Search ) ..5-22 5.4.3 Searching for Next Largest/Smallest Peak/Dip Point (↓: Next ) ............5-23 5.4.4 Searching for Last Largest/Smallest Peak/Dip Point (↑: Last...
- Page 90 Section 5 Explanation of Screens <Background cards> The tabs of Background cards appear at the bottom of the MS9710B screen. The Foreground cards are displayed by pressing the key to select the change button Prior Setting Graph Type (Graph Card ) ........
- Page 91 5.10.4 Interval Measurement (Interval ) ....5-92 5.10.5 Tracking Measurement (TLS Tracking ) ..5-93 5.10.6 Power Monitor Measurement (Power Monitor ) ..........5-94 5.11 Setting Titles (Title Card ) ..........5-95 5.12 Calibration Function (Cal Card ) ........5-97 5.12.1 Setting Wavelength Offset (Wl Offset ) ..
- Page 92 Section 5 Explanation of Screens <Marker Select Screen> Marker The screen shown below is displayed when the Marker Select key of the Select Marker keys is pressed. To select a Foreground card, press any of the card selection keys. To go back to the Graph card (the key) press key.
- Page 93 <Zone Marker Screen> Zone The screen shown below is displayed when the Zone Marker key of the Marker Marker keys is pressed. To select a Foreground card, press any of card selection keys. To go back to the Graph card (the key) press key.
- Page 94 Section 5 Explanation of Screens Setting Wavelength (Wavelength Card The Wavelength card displayed by pressing the key is used to set the mea- surement conditions related to wavelength. (horizontal axis of the screen) Prior NOTE: The Mkr Value Wl/Freq function key is only displayed when Option 10 is installed.
- Page 95 5.1 Setting Wavelength (Wavelength Card 5.1.2 Setting Sweep Width (Span Function Key This key sets the wavelength range to be displayed on the horizontal axis of the screen. This wavelength range is called the sweep width or Span. When the Span is changed, the Center wavelength is centered and the Start and Stop wave- lengths are automatically adjusted.
- Page 96 Section 5 Explanation of Screens 5.1.3 Setting Start Wavelength (Start Function Key This key sets the wavelength displayed at the left side of the screen. This wave- length is called the Start wavelength. When the Start wavelength is changed, the Stop wavelength remains unchanged but the Span is adjusted automatically. This function cannot be used in the Trace A&B, Trace A–B, and Trace B–A.
- Page 97 Trace B-A displays cannot be switched to the frequency display. Appendix I Switching Marker Frequency Display NOTE: This function is an option. It can only be used when Option 10 is installed in the MS9710B. 5.1.6 Switching Wavelength Display (Value in Air/Vac Function Key This key switches the wavelength display between the value in air and the value in a vacuum.
-
Page 98: Setting Level
Section 5 Explanation of Screens Setting Level (Level Scale Card The Level Scale card displayed by pressing the key used to set measure- ment conditions related to the power level. (vertical axis of the screen) Prior 5.2.1 Setting Log Scale (Log (/div) Function Key This key sets the vertical axis to a user specified log scale (dB/div). - Page 99 5.2 Setting Level (Level Scale Card 5.2.2 Setting Reference Level (Ref Level Function Key This key sets the reference display level (REF value displayed on vertical axis) when the vertical axis is set to Log Scale. However, when Linear Scale is se- lected, the origin of the vertical axis becomes 0 and it is not possible to change the zero-level position.
- Page 100 Section 5 Explanation of Screens 5.2.3 Setting Linear Scale (Linear Level Function Key This key sets the vertical axis to a liner unit, and sets the value [W] of top end of the scale. (1) Setting Linear Scale Press the key to select the Level Scale card, then press the Linear Level function key to display the current setting at the top right of the...
- Page 101 5.2 Setting Level (Level Scale Card 5.2.4 Optical Attenuator On/Off (Opt. Att Off/On Function Key This key sets whether or not to insert the optical attenuator, permitting measure- ment of high-level optical inputs. The optical attenuator is inserted each time the function key is pressed.
-
Page 102: Setting Resolution And Averaging
Section 5 Explanation of Screens Setting Resolution and Averaging (Res/VBW/Avg Card The Res/VBW/Avg card displayed by pressing the key is used to set mea- surement conditions related to Resolution, Averaging, Smoothing, and Number of Sample Points. Prior 5-16... - Page 103 5.3 Setting Resolution and Averaging (Res/VBW/Avg Card 5.3.1 Setting Resolution (Res Function Key This key sets the wavelength resolution. When measuring the optical input of narrow spectra such as LDs, etc., it is necessary to set a small resolution value. Moreover, when a large resolution is set for input of wide spectra such as LEDs, etc., measurement can be performed with a good S/N ratio.
- Page 104 Section 5 Explanation of Screens 5.3.2 Setting Video Band Width (VBW Function Key This key sets the Video Bandwidth. When a wide-band VBW is set, measure- ment can be performed at high speed. Conversely, when a narrow VBW is set, sweep speeds are slower but sensitivity is improved due to additional noise sup- pression.
- Page 105 5.3 Setting Resolution and Averaging (Res/VBW/Avg Card 5.3.4 Setting Sweep Average (Sweep Average Function Key This key is used to activate the Sweep Avg function. A user-specified number of traces are average together and the results are displayed. This is commonly known as a “Sweep-to Sweep”...
- Page 106 Section 5 Explanation of Screens 5.3.5 Setting Smoothing (Smooth Function Key This key smooths the level of a data point based on the levels on both sides of the point. It is possible to set correction based on only the preceding and suc- ceeding points, or based on a number of data points (point number).
- Page 107 5.3 Setting Resolution and Averaging (Res/VBW/Avg Card 5.3.6 Setting Sampling Points (Sampling Points Function Key This key sets the number of measured data points (Sampling point number) within the Span. When the Sampling point number is small, measurement can be performed at high speed, but to measure with good Resolution over a wide range, the Sampling point number must be large.
-
Page 108: Peak/Dip Search
Section 5 Explanation of Screens Peak/Dip Search (Peak/Dip Search Card The Peak/Dip Search card displayed by pressing the key is used to search for Peak (maximum) points and Dip (minimum) point in the measured spec- trum. Prior 5.4.1 Searching for Peak Points (Peak Search Function Key Press the key to select the Peak/Dip Search card, then press the Peak Search function key... -
Page 109: Searching For Next Largest/Smallest Peak/Dip Point
5.4 Peak/Dip Search (Peak/Dip Search Card 5.4.3 Searching for Next Largest/Smallest Peak/Dip Point (↓ ↓ ↓ ↓ ↓ : Next function key key to select the Peak/Dip Search card, then press the ↓, or Next Press the function key, to move the Trace marker to the next highest Peak point or next smallest Dip point. -
Page 110: Searching For Next Right Peak/Dip Point (→: Right )
Section 5 Explanation of Screens 5.4.6 Searching for Next Right Peak/Dip Point (→ → → → → : Right Function Key key to select the Peak/Dip Search card, then press the →, or Right Press the function key, to move the Trace Marker to the Peak or Dip point to the right of the current Peak or Dip. -
Page 111: Analyzing Waveforms
5.5 Analyzing Waveforms (Analysis Card Analyzing Waveforms (Analysis Card The Analysis card displayed by pressing key is used for analyzing mea- sured spectra. Prior 5-25... -
Page 112: Threshold Analysis
Section 5 Explanation of Screens 5.5.1 Threshold Analysis (Threshold Function Key Press the key to select the Analysis card, then press the Threshold function to perform Threshold analysis on measured spectrum. This analysis is useful for finding the spectrum half width, etc. The target data of this analysis is the data within the zone when the zone marker is On and the data displayed on the screen when the zone marker is Off. - Page 113 5.5 Analyzing Waveforms (Analysis Card The Cut Level can be set with the Data entry keys, the Knob, or function keys. The following values are displayed in the Functions display field at the right side of the screen and can be input using the function keys. 3 dB 6 dB 10 dB...
-
Page 114: Ndb-Loss Analysis
Section 5 Explanation of Screens 5.5.2 ndB-Loss Analysis (ndB-Loss Function Key Press the key to select the Analysis card, then press the ndB-Loss function to perform ndB-Loss analysis on the measured spectrum. The ndB- Loss analysis is for analysis of multimode spectra. If the target spectrum is single mode, the same analysis as Threshold analysis is performed. - Page 115 5.5 Analyzing Waveforms (Analysis Card The Cut Level can be set with the Data entry keys, the Knob, or function keys. The following values are displayed in the Functions display field at the right side of the screen and can be input using the function keys. 3 dB 6 dB 10 dB...
-
Page 116: Side Mode Suppression Ratio Analysis
Section 5 Explanation of Screens 5.5.3 Side Mode Suppression Ratio Analysis (SMSR Function Key Press the key to select the Analysis card, then press the SMSR function to perform a side mode suppression ratio analysis of the measured spectrum. SMSR specifies the level ratio between the Peak and Side mode. Either the next largest peak after the Peak point, or the peak immediately to the left or right of the Peak point can be selected as the Side mode. - Page 117 5.5 Analyzing Waveforms (Analysis Card Three Side modes can be selected with the function keys as follows: Function Key Side Mode : 2nd Next largest level from Peak point Side mode : Left Peak immediately to left of Peak point Side mode : Right Peak immediately to right of Peak point Side mode...
-
Page 118: Envelope Analysis
Section 5 Explanation of Screens 5.5.4 Envelope Analysis (Envelope Function Key Press the key to select the Analysis card, then press the Envelope function to perform an Envelope analysis of the measured spectrum. This analysis finds the envelope from the Peak points of several spectra and displays the measurement results. - Page 119 5.5 Analyzing Waveforms (Analysis Card The Cut Level can be set with the Data entry keys, the Knob, or the function keys. The following values are displayed in the Functions display field at the right side of the screen and can be input using the function keys. 3 dB 6 dB 10 dB...
-
Page 120: Rms Analysis
Section 5 Explanation of Screens 5.5.5 RMS Analysis (RMS Function Key Press the key to select the Analysis card, then press the RMS function to perform a Root mean square analysis (hereinafter referred as RMS analysis) of the measured spectrum. RMS analysis is for analyzing multimode spectra. - Page 121 5.5 Analyzing Waveforms (Analysis Card (1) Calculation and Processing of RMS Analysis When setting the wavelength and level of the peaks of spectrum exceeding the level which lowers from the maximum peak by the preset level to “An” and “λ ”...
-
Page 122: Spectrum Power Analysis (Spectrum Power F 6 )
Section 5 Explanation of Screens 5.5.6 Spectrum Power Analysis (Spectrum Power Function Key Press the key to select the Analysis card, then press the Spectrum Power function key to perform a Spectrum Power analysis. Spectrum analysis finds the power distribution of the measured spectrum and calculates the total power. -
Page 123: Deleting Analysis Results (Off F 7 )
5.5 Analyzing Waveforms (Analysis Card The total power Pow is found from the following equation. α∆λ Where, α is the correction factor depending on the slit, Res is the actual Resolution and ∆λ is the sampling wavelength interval. 5.5.7 Deleting Analysis Results (Off Function Key Press the key to select the Analysis card, then press the Off function to delete the results when the screen is displaying the analysis results... -
Page 124: Trace Memory
Section 5 Explanation of Screens Trace Memory (Trace Card The trace card is used to switch the memory in which the measured data is stored or change the display (trace) method. The unit has two memories: Memory A and Memory B. You can use each of them individually or combine the two. -
Page 125: Trace Memory (Trace Card F6 )
5.6 Trace Memory (Trace Card 5.6.1 Selecting Memory A (Memory A Function Key To store the spectrum measurement data in Memory A, select Memory A func- tion key from Trace card . The screen which displays the data stored in Memory A is called Trace A. -
Page 126: Comparing Trace B-A (Trace B-A F 7 )
Section 5 Explanation of Screens 5.6.7 Comparing Trace B–A (Trace B–A Function Key Press the key to select the Trace card, then press the Trace B–A function to subtract the Trace-A data from the Trace-B data and display the result when a Log Scale is displayed. The subtraction is performed with a dB display and the displayed waveform displays the ratio of the waveforms saved in memories B and A. -
Page 127: Saving And Recalling Measured Data
5.7 Saving and Recalling Measured Data (Save/Recall Card Saving and Recalling Measured Data (Save/Recall Card The Save/Recall card displayed by pressing key is used to save/recall mea- sured data to/from a FD. In addition to using its own file format, this analyzer ... -
Page 128: Saving Measured Data (Save F 1 )
Section 5 Explanation of Screens 5.7.1 Saving Measured Data (Save Function Key Press the key to select the Save/Recall card, then press the Save function to save the measured data to FD. The data is saved to the standard analyzer proprietary format (.dat). To save the data in additional formats (.bmp and/or .txt) the user must select these formats in the File Option screen dis- played by pressing the before saving the data. - Page 129 5.7 Saving and Recalling Measured Data (Save/Recall Card (1) Saving as File Name Press the key to select the Save/Recall card, then press the Save func- tion key to display the following screen. Enter a file name of up to 8 alphanumeric characters using the Data entry key and function keys and press the Save function key to complete the saving.
- Page 130 Section 5 Explanation of Screens (2) Saving as File Number Press the key to select the Save/Recall card, then press the Save func- tion key to display the following screen. Enter a file number using the Data entry key and press the Save function key to complete the saving.
-
Page 131: Recalling Saved Data (Recall F 2 )
5.7 Saving and Recalling Measured Data (Save/Recall Card 5.7.2 Recalling Saved Data (Recall Function Key Press the key to select the Save/Recall card, then press the Recall function to recall a file saved in the analyzer format from the FD. However, the files saved in bitmap format of MS-Windows™... -
Page 132: Setting Options
Section 5 Explanation of Screens 5.7.3 Setting Options (File Option Function Key The following options related to saving data can be set. Saved File Format The file can be saved in the analyzer format, bitmapped format or text format. File Name Input The file can be saved as a file name or a file number. - Page 133 5.7 Saving and Recalling Measured Data (Save/Recall Card (1) Selecting Data Addition (Additional Save File) When saving a file, in addition to the standard format, the file format can be selected from the following four items. The additional file name(s) has the same name as the standard format file but the extension is different.
-
Page 134: Deleting Files
Section 5 Explanation of Screens 5.7.4 Deleting Files (File Delete Function Key Press the key to select the Save/Recall card, then press the File Delete func- tion key to delete a standard format file saved on the FD. Files deleted with this function cannot be recovered. -
Page 135: Formatting Floppy Disk (File Format F 6 )
5.7 Saving and Recalling Measured Data (Save/Recall Card 5.7.5 Formatting Floppy Disk (File Format Function Key Press the key to select the Save/Recall card, then press the File Format function key to format the FD. When attempting to save data to a new FD, the FD must be formatted first. Note that formatting a FD erases all current data on the disk. -
Page 136: Setting Graph Type
Section 5 Explanation of Screens Setting Graph Type (Graph Card The Graph card displayed by pressing key is used to select the graph display format. The user can choose from five display formats: Normal, Overlap, Max Hold, Normalize, and 3D. Prior 5.8.1 Normal Display (Normal Function Key... -
Page 137: Max Hold Display (Max Hold F 3 )
5.8 Setting Graph Type (Graph Card 5.8.3 Max Hold Display (Max Hold Function Key Press the key to select the Graph card, then press the Max Hold function to display the peak level at each measurement point for multiple sweeps. This is useful for monitoring the peak values of a changing spectrum. -
Page 138: Display (3D F 5 )
Section 5 Explanation of Screens 5.8.5 3D Display (3D Function Key Press the key to select the Graph card, then press the 3D function to display repeatedly measured spectra as a 3D graph. The display format can be selected from Type 1, Type 2, or Type 3. Prior (1) Type 1 graph display format In the Type 1 graph display format, wavelength is displayed on the x-axis,... - Page 139 5.8 Setting Graph Type (Graph Card (2) Type 2 graph display Format In the Type 2 graph display format, wavelength is displayed on the x-axis, level on the y-axis, and time (number of times) on the z-axis. The z-axis display angle can be selected from 30°, 45°, 60° and 90° using function keys, respectively.
-
Page 140: Clearing Graphs (Clear F 6 )
Section 5 Explanation of Screens 5.8.6 Clearing Graphs (Clear Function Key Press the key to select the Graph card, then press the Clear function to clear the displayed graphs. When the graphs are cleared, both Memories A and B are cleared as well. 5-54... -
Page 141: Application Measurement Functions
5.9 Application Measurement Functions (Application Card Application Measurement Functions (Application Card The Application card displayed by pressing the key has a variety of conve- nient functions for use in device and WDM system evaluations. • DFB-LD Test ..evaluates DFB-LDs •... -
Page 142: Evaluating Dfb-Lds
Section 5 Explanation of Screens 5.9.1 Evaluating DFB-LDs (DFB-LD Test Function Key This function determines the SMSR, spectrum width (ndB width), stop band, mode offset, and center offset, etc., from the DFB-LD spectrum. This function cannot be used with Trace A&B, Trace A–B, or Trace B–A. Press the key to select the Application card, then press the DFB-LD func- tion key... - Page 143 5.9 Application Measurement Functions (Application Card The names and descriptions of the data collected by this function is explained below. Data Name Description Peak Displays wavelength and level of Peak point 2nd Peak Left Peak Displays wavelength and level for each side mode Right Peak ndB Width Width of spectrum at level ndB lower than Peak...
-
Page 144: Evaluating Fp-Lds
Section 5 Explanation of Screens 5.9.2 Evaluating FP-LDs (FP-LD Test Function Key FP-LD Test Function is used to find the peak, RMS analysis results, oscillation vertical mode Number, vertical mode interval, total power, etc., from the FP-LD spectrum. This function cannot be used in the Trace A&B, Trace A–B, and Trace B–A. - Page 145 5.9 Application Measurement Functions (Application Card The names and descriptions of the data collected by this function is explained below. Data Name Description Peak Displays wavelength and level of Peak point Mean W1 Center wavelength calculated by RMS analysis FWHM (2.35 σ) Half width calculated by RMS analysis Total Power Total power...
-
Page 146: Evaluating Leds
Section 5 Explanation of Screens 5.9.3 Evaluating LEDs (LED Test Function Key This function finds the peak, Center wavelength, spectrum width (ndB width), total power and power per nm, etc. This function cannot be used in the Trace A&B, Trace A–B, and Trace B–A. Press the key to select the Application card, then press the LED test func- tion key... - Page 147 5.9 Application Measurement Functions (Application Card The names and descriptions of the data collected by this function are explained below. Data Name Description Peak Displays wavelength and level of Peak point Mean W1 (ndB) Center wavelength calculated by Threshold analysis Mean W1 (FWHM) Center wavelength calculated by Averaging pro- cessing...
- Page 148 Section 5 Explanation of Screens (2) Calculation and Processing Mean Wl (ndB) and ndB width use the same calculation method used in Threshold Analysis. Section 5.5 Mean Wl (FWHM), FWHM, Total Power, and Pk Dens (/1nm) are calcu- lated from all the measured points in the displayed spectrum. •...
-
Page 149: Evaluating Pmd (Pmd Test F 4 )
5.9 Application Measurement Functions (Application Card 5.9.4 Evaluating PMD (PMD Test Function Key This function evaluates PMD (Polarization Mode Dispersion). This function cannot be used in the Trace A&B. Press the key to select the Application card, then press the PDM Test func- tion key to perform PMD evaluation. - Page 150 Section 5 Explanation of Screens The names and descriptions of the data collected by this function are explained below. Data Name Description Diff. Group Delay Differential Group Delay Time 1st Peak Wavelength of first peak in analysis range Last Peak Wavelength of last peak in analysis range Peak Count Number of inclusive peaks in analysis range.
- Page 151 Convert the light from a wideband light source to a polarized wave using a polarization controller; pass this polarized light through the device under test, and input it to the MS9710B through an analyzer. The MS9710B measures the optical power polarization wavelength changes and calcu- lates the PMD.
- Page 152 Section 5 Explanation of Screens (5) Manual Calculation Measurement Procedure (a) Set PMD Test to Manual. Press the key to select the Application card and press the PMD function key . Select Manual by pressing the Auto/Manual func- tion key (b) Measure the spectrum.
-
Page 153: Evaluating Optical Amplifiers (Opt. Amp Test )
5.9 Application Measurement Functions (Application Card 5.9.5 Evaluating Optical Amplifiers (Opt. Amp Test Function Key This function evaluates optical amplifiers. This function cannot be used in the Trace A–B, Trace B–A. Press the key to select the Application card, then press the Opt. Amp Test function key to display the following screen and perform an evaluation of an optical amplifier. - Page 154 Section 5 Explanation of Screens The following function keys are displayed in the Functions display field at right-hand side of the screen. Key Name Description : Prmtr Opens window for setting various test parameters. : Method Sets evaluation method. The following five meth- ods can be used.: •...
- Page 155 5.9 Application Measurement Functions (Application Card Press the key to select the Application card and press the Opt. Amp Test function key to display the Prmtr function. When the Prmtr function is pressed, the following screen is displayed. Prior The following function keys are displayed in the Functions display field at right-hand side of the screen.
- Page 156 Section 5 Explanation of Screens The descriptions of each parameters are as follows. Parameter Description NF Select Selects the types of noise included in the Noise Figure calculation. In the S-ASE setting, only the beat noise between the optical signal (Signal) and the Amplified Spontaneous Emission (ASE) is in- cluded in the NF calculation.
- Page 157 5.9 Application Measurement Functions (Application Card Parameter Description O. BPF BW Sets optical passband filter bandwidth. The band- width is centered around the wavelength of the Signal. O. BPF BW can only be used when calcu- lating the Total NF; it is not displayed for S-ASE. Set 999 nm when the filter is not inserted.
- Page 158 Section 5 Explanation of Screens (1) Settable Range The Ext. Trig Delay can be set in the range of 0 to 5 s. The setting ranges of other parameters are as follows. Parameter Setting Range Fitting Span 0.10 to 100.00 [nm] Masked Span 0.10 to 100.00 [nm] (Masked Span <...
- Page 159 5.9 Application Measurement Functions (Application Card The descriptions of the symbols used in the formulas above are as fol- lows. λ Wavelength of output optical signal in vacuum [nm] Signal frequency [Hz] Actual Resolution (calibrated by Res Cal) [nm] real ∆vs: Frequency band of analyzer at Pase measurement [Hz] –34...
- Page 160 Section 5 Explanation of Screens (c) ASE (P ) [dBm] is approximated by Mean Fitting. Set wavelength of the data point, which is one of two points innermost in the approximated data of amplified optical spectra (data obtained by removing the range set in Masked Span from the range set in Fitting Span) and closer to a shorter wavelength within reference to the signal optical wavelength, to “λ...
- Page 161 5.9 Application Measurement Functions (Application Card (d) ASE (P ) [dBm] approximated by Gauss Fitting Points (λ ) and (λ ) are used to calculate P (λ ) using a least square fit. The points (λ ) and (λ ) correspond to the end points of the Masked Span region λ...
- Page 162 Section 5 Explanation of Screens (3) Measurement Procedure and Example Press the key to select the Application card Start and press the Opt. Amp Test function key Press the Method function key and select Determine method the evaluation method. Refer to the following pages for more details.
- Page 163 5.9 Application Measurement Functions (Application Card NOTE *1 : When calibrating Resolution, always use a single-mode light source such as a DFB-LD, and match the Center wavelength to the Peak wavelength of the DFB-LD spectrum. When the Resolution setting is changed during measurement, the Resolu- tion data becomes void;...
- Page 164 (strongly modulated) light is input to the optical ampli- fier. To synchronize the sampling timing with this modulated optical pulse, the modulation signal of the light source is input to the Ext. Trig terminal of the MS9710B. 5-78...
- Page 165 5.9 Application Measurement Functions (Application Card Strongly modulated Output light light MS9710B Optical Signal Spectrum generator Analyzer Ext-Trig Modulation Modulation signal signal input terminal input terminal Modulation signal A measurement is taken τ msec after the Ext. Trig signal rising edge.
- Page 166 Section 5 Explanation of Screens (e) WDM Method This method is a variation on the Pulse Method which is useful for WDM systems. One channel in the WDM system is pulsed. The Amplified optical level and the ASE output level for this channel are measured using the same technique described previously for the Pulse Method.
-
Page 167: Wdm Evaluation (Wdm )
5.9 Application Measurement Functions (Application Card 5.9.6 WDM Evaluation (WDM This function is used to find the SNR of signal peaks as well as the wavelength and level differences between peaks, which are important parameters in WDM analysis. A maximum of 300 peaks from the short wavelength side can be de- tected. - Page 168 Section 5 Explanation of Screens There are three display modes for WDM signal analysis: Multipeak, SNR, and Relative. (When Option 10 is installed, the Table display mode is added to these three modes.) The items displayed for each mode are different. To change the display mode, press the Display Mode function key select the mode to be displayed.
- Page 169 5.9 Application Measurement Functions (Application Card <SNR> In the SNR mode, the wavelength, level, and SNR of up to 8 peaks can be dis- played simultaneously. <Relative> In the Relative mode, the wavelength, level, and wavelength spacing, or the wavelength and level relative to a reference peak, can be displayed for up to 5 peaks simultaneously.
- Page 170 The frequency f is found from the wavelength λ in a vacuum using the following equation: ƒ λ Where, c = 2.99792458 × 10 (m/s). NOTE: This function is an option. It can only be used when Option 10 is installed in the MS9710B. 5-84...
- Page 171 5.9 Application Measurement Functions (Application Card The following table lists the names of the data found by this function and the meaning. Item (Key Name) Operation and Setting Next Page Scrolls detected-peak data display range to next page Last Page Scrolls detected-peak data display range to previ- ous page Display Mode...
- Page 172 Section 5 Explanation of Screens <Peak Prmtr Setting Window> === Peak Prmtr ========= S.Level ..30 dB Peak Type ..Threshold Threshold Cut Level ..3.0 dB Set the target for peaks to be analyzed up to X dB below the maximum peak at S.Level in the Peak Prmtr window.
- Page 173 5.9 Application Measurement Functions (Application Card The following table lists the names of the data found by this function and the meaning. Data Name Meaning Peak No. Appends sequential number from short wavelength side to detected peak. Wl (nm) or Signal (nm) Peak wavelength.
- Page 174 Section 5 Explanation of Screens (1) Setting Ranges S. Level can be set in the range from 1 to 50. ∆λ can be set in the range 0.01 to 20 nm and the Peak Prmtr Threshold Cut Level can be set in the range 0.1 to 50.0 dB.
- Page 175 5.9 Application Measurement Functions (Application Card When ∆λ is Off, if Dip Type of Dip Prmtr is set to Left, the noise level LNLin is the level of dip point b at the short wavelength side of the peak; if Dip Type of Dip Prmtr is set to Right, it is the level of dip point c at the long wavelength side of the peak.
-
Page 176: Special Measurement Modes (Measure Mode Card )
Section 5 Explanation of Screens 5.10 Special Measurement Modes (Measure Mode Card The Measure Mode card selected by pressing key is used to set the measure- ment environment. Prior 5.10.1 Wide Dynamic Range Measurement (D. range Norm/Hi Function Key This function switches the dynamic range between Normal (hereinafter referred as Norm) and Hi. -
Page 177: Peak Hold Measurement
5.10 Special Measurement Modes (Measure Mode Card 5.10.2 Peak Hold Measurement (Peak Hold Function Key The measurement method for measuring the peak level at each measurement point during the set gate time is called Peak Hold measurement. Peak Hold measurement can be used at the same time as measurement of external modula- tion light. -
Page 178: Modulated Light Measurement
By using the Ext. Trigger function, it is possible for the analyzer to monitor modulated light. The signal used to modulate the light is input to the Ext. Trig- ger terminal on the back panel of the MS9710B. The analyzer’s measurements are then synchronized to Ext. Trigger rising edges. -
Page 179: Tracking Measurement
Tracking Measurement (TLS Tracking Function Tracking measurement can be performed with the MG9637/MG9638A. The output wavelength of the tunable light source is controlled from the MS9710B and tracking measurement is performed. In the tracking measurement mode, the wavelength offset cannot be set using Wl Offset and neither can Auto Mea- surement nor Power Monitor measurement be used. -
Page 180: Power Monitor Measurement
Section 5 Explanation of Screens 5.10.6 Power Monitor Measurement (Power Monitor Function Key This function sets this analyzer to the Power Monitor mode. (1) Measuring Total Power of Optical Input Press the key to select the Measure Mode card, then press the Power Monitor function key to display the measured power at the top right of the Graph field as shown below and display the function keys on the... -
Page 181: Setting Titles
5.11 Setting Titles (Title Card 5.11 Setting Titles (Title Card This function inputs titles of up to 30 characters at the top of the screen. Prior When the Title card is selected by pressing the key, the character selection window shown above is displayed. Use the Knob to move the cursor to the position of the desired character, or use the function keys to move the cursor and insert a blank space. - Page 182 Section 5 Explanation of Screens For example, set the title “YOU” as follows: (1) Select the Title card by pressing key. The character selection window is displayed in the middle of the screen. (2) Use the Knob to move the cursor in the character selection window to the Y. (3) Move the cursor to the right of Y using the →...
-
Page 183: Calibration Function
5.12 Calibration Function (Cal Card 5.12 Calibration Function (Cal Card The Cal card displayed by pressing key is used to calibrate the MS9710B. Calibration makes it possible to obtain higher-accuracy measurement results. Prior CAUTION If this function is used when no external reference op-... -
Page 184: Setting Wavelength Offset
Section 5 Explanation of Screens 5.12.1 Setting Wavelength Offset (Wl Offset Function Key When the wavelength offset component is input, the spectrum is displaced hori- zontally left/right. When a positive value is input to the wavelength offset data, the displayed spectrum of the subsequent measurements is shifted to longer wavelengths. -
Page 185: Calibrating Wavelength Using External
5.12 Calibration Function (Cal Card 5.12.3 Calibrating Wavelength using External Wavelength Reference (Wl Cal (Ext) Function Key This function uses an external wavelength reference to calibrate wavelength. Press the key to select the Cal card and press the Wl Cal (Ext) function to display Execute and Cancel in the Functions display field on the right side of the screen. -
Page 186: Initializing Wavelength Calibration Data
A reference signal with a wavelength in the band of interest is input into the MS9710B. The analyzer uses this reference to optimize the posi- tion of the internal optical axis. The Auto Align calibration should be per- formed whenever extremely high accuracy is required. -
Page 187: Saving And Recalling Measurement Conditions
5.13 Saving and Recalling Measurement Conditions (Condition Card 5.13 Saving and Recalling Measurement Conditions (Condition Card Up to five different measurement conditions can be saved to internal memory. The measurement conditions can also be returned to the factory default settings. Prior The measurement conditions are as follow: Wavelength... -
Page 188: Saving Measurement Conditions
Section 5 Explanation of Screens Optical Att On/Off Interval Time Dynamic Range Graph Mod. Mode Analysis/Application 5.13.1 Saving Measurement Conditions (Condition Save Function Key The current measurement conditions can be saved to memory number 1 to 5. Press the key to select the Condition card, then press the Condition Save function key to display the Condition Save screen as shown below. -
Page 189: Recalling And Initializing Measurement Conditions
5.13 Saving and Recalling Measurement Conditions (Condition Card 5.13.2 Recalling and Initializing Measurement Conditions (Recall Function Key This function recalls saved measurement conditions. Press the key to select the Condition card, then press the Recall function to display the Recall screen as shown below. Prior Select the desired Memory Number at the top left of the screen, then press the Execute function key... -
Page 190: Listing Current Measurement Conditions
Section 5 Explanation of Screens 5.13.3 Listing Current Measurement Conditions (View Function Key This function displays the currently-set measurement conditions. Press the key to select the Condition card, then press the View function to display condition View screen as shown below. Refer to Appendix B “Factory Default Settings”... -
Page 191: Other Functions
5.14 Other Functions (Others Card 5.14 Other Functions (Others Card The following items can be set in this card: • Printer Parameters • Display Colors • GPIB Address • Backlight On/Off • System Date-Time • Buzzer On/Off Prior 5-105... -
Page 192: Setting Printer
Section 5 Explanation of Screens 5.14.1 Setting Printer (Printer Prmtr Function Key This function switches between the internal and external printer, and selects the type of external printer. Press the key to select the Others card, then press the Printer Prmtr function to display the following screen. -
Page 193: Setting Gpib Address
5.14 Other Functions (Others Card 5.14.2 Setting GPIB Address (GPIB Address Function Key This function sets the GPIB address of the MS9710B. Press the key to select the Others card and press the GPIB Address function to input the address using the Data entry keys or Knob. When the Data entry keys are used, press the Enter function key to complete the setting. -
Page 194: Setting Date And Time
Section 5 Explanation of Screens 5.14.3 Setting Date and Time (Date/Time Function Key This function sets the date and time of the internal timer. Press the key to select the Others, then and press the Date/Time function to display the following screen. Prior The following function keys are displayed in the Functions display field at right-hand side of the screen. - Page 195 5.14 Other Functions (Others Card The descriptions of each settings are as follows. Setting Item Descriptions Display Sets whether or not to display the date and time on the screen On .... Date/Time Displayed Off .... Date/Time Not Displayed Date Sets date Time Sets time...
-
Page 196: Setting Screen Display Color
Section 5 Explanation of Screens 5.14.4 Setting Screen Display Color (Display Color Function Key This function sets the display color. Press the key to select the Others card, then press the Display Color func- tion key to display the following screen. The following function keys are displayed in the Functions display field at right-hand side of the screen. -
Page 197: Setting Backlight Off Time
5.14 Other Functions (Others Card (1) Settable Range The range can be set from 0 to 7. 5.14.5 Setting Backlight Off Time (Backlight Function Key This function sets the Keypad idling time before the LCD screen is turned Off. When the backlighting is Off, it is switched on as soon as any key is pressed. Press the key to select the Others card, then press the Backlight function , then input the time increment until the backlighting is switched off. -
Page 198: Setting Rs-232C
Section 5 Explanation of Screens 5.14.7 Setting RS-232C (RS-232C Prmtr Function Key This function switches the remote-control interface to either RS-232C or GPIB and sets the RS-232C communication conditions. Press the key to select the Other card, then press the RS-232C Prmtr func- tion key to display the following screen. - Page 199 5.14 Other Functions (Others Card The descriptions of each settings are as follows. Setting Item Description Interface Selects remote control interface from GPIB and RS-232C. RS-232C cannot be used for remote control interface in tracking measurement with TLS. Speed Selects communication speed from 9600, 4800, 2400, 1200, and 600 bps Parity Selects parity bit...
-
Page 200: Marker Select Screen
Marker Select Screen (Marker Select Key Marker Select To make waveform analysis easier, the MS9710B has wavelength markers A and B, level markers C and D, trace marker TMkr, and delta marker ∆ Mkr. Marker When the Marker Select key... - Page 201 5.15 Marker Select Screen (Marker Select Key Marker Select 5.15.1 Setting Wavelength Markers (λ λ λ λ λ Mkr_A Function Key , λ λ λ λ λ Mkr_B Function Key Wavelength markers A and B (λ Mkr_A, λ Mkr_B) are displayed as vertical lines in the Wavelength display field.
- Page 202 Section 5 Explanation of Screens 5.15.2 Setting Level Markers (LMkr_C Function Key , LMkr_D Function Key Level markers C and D (LMkr_C, LMkr_D) are displayed as horizontal lines in the Wavelength display field. The difference between the two markers (C–D) (relative scale) or (C/D) (linear scale) is displayed in the Marker display field at the top of the screen.
- Page 203 5.15 Marker Select Screen (Marker Select Key Marker Select ∆ 5.15.4 Setting Delta Marker ( Mkr Function Key The Delta Marker (∆ Mkr) is a marker for tracing the spectrum in the same way as the Trace Marker, but it displays wavelength difference and level difference from the Trace Marker in the Marker display field.
-
Page 204: Zone Marker Screen
Section 5 Explanation of Screens 5.16 Zone Marker Screen (Zone Marker Key Zone Marker Zone Press the Zone Marker key of the Marker keys to display the Zone Marker Marker card as shown below and activate the zone marker. The zone marker specifies a subset of the wavelength range for measurement and analysis. - Page 205 5.16 Zone Marker Screen (Zone Marker Key Zone Marker 5.16.2 Setting Zone Width (Zone Width Function Key This function sets the interval between the two lines of the zone marker. It cannot be used at 3D displays. Zone Press the Zone Marker key of the Marker keys to display the Zone Marker Marker card and press the Zone Width function key...
- Page 206 Section 5 Explanation of Screens 5-120...
-
Page 207: Section 6 Calibration And Testing Performance
Section 6 Calibration and Testing Performance This section describes how to calibrate the level and wavelength measurement accuracy, and execute the performance test of the MS9710B Optical Spectrum Analyzer. Calibrating Level ..........Calibrating Wavelength ........6.2.1 Calibration using Internal Wavelength Reference .. -
Page 208: Calibrating Level
Connect the output of a single-mode oscillation light source (calibrated with an optical power meter to a level of –30 dBm minimum) to the input of the MS9710B. A suitable light source would be a 1.3 µm or 1.55 µm DFB-LD. Calibration cannot be performed accurately with a multimode light source such as an FP-LD. - Page 209 (e) Press the key to select the Cal card, then press the Level Offset key and adjust the Peak Level value to -23 dBm using the Knob. This adjustment value (offset) is saved even when the power of MS9710B is switched off.
-
Page 210: Calibrating Wavelength
To adjust the optical axis, connect the output of a single-mode oscillation light source with a level of –30 dBm minimum to the optical input connec- tor of the MS9710B. A suitable light source would be a 1.3 µm or 1.55 µm DFB-LD. Calibration cannot be performed accurately with a multimode light source such as an FP-LD. -
Page 211: Calibration Using External Wavelength Reference
(1) Inputting Reference Wavelength Light Connect the output of a single-mode light source calibrated with an optical wavelength meter to the input of the MS9710B. A suitable light source would be a 1.3 µm or 1.55 µm DFB-LD with output power of –30 dBm minimum Calibration cannot be performed accurately with a multimode light source such as an FP-LD. -
Page 212: Testing Performance
Section 6 Calibration and Testing Performance Testing Performance The following items are tested to confirm the performance of the tester. (1) Wavelength accuracy (2) Level accuracy Clean all connectors before testing performance. In addition, allow the tester to warm up sufficiently and always make sure to execute the calibration described in Section 6.1 “Calibrating Level.”... -
Page 213: Checking Wavelength
CW mode and set the MG9637A so that the wavelength mea- sured by the MF9630A Optical Wavelength Meter is 1550 nm. (b) Connect the output of the MG9637A to the MS9710B and measure the spectrum. At this time, it is important that the wavelength value dis- play is for a vacuum. -
Page 214: Checking Level
Source to the CW mode and set the MN9610B Tunable Optical At- tenuator so that the level measured by the ML9001A Optical Power Meter is –23 dBm. (b) Connect the output of the MN9610B to the MS9710B and measure the spectrum. (c) Press the... -
Page 215: Section 7 Maintenance And Troubleshooting
Section 7 Maintenance and Troubleshooting This section describes the periodic maintenance procedures, storage precau- tions, transporting and troubleshooting of the MS9710B Optical Spectrum Ana- lyzer. Periodic Maintenance ........7.1.1 Cleaning Exterior ....... 7.1.2 Cleaning Screen ........ 7.1.3 Cleaning Ferrule ........ -
Page 216: Periodic Maintenance
If the LCD becomes soiled, wipe it gently with a clean cloth. If it is very dirty, clean it by wiping gently with a soft cloth lightly moistened with soapy water. CAUTION The MS9710B uses micron-precision components; do not disassemble or lubricate it. 7.1.3... - Page 217 7.1 Periodic Maintenance (3) Carefully wipe any dirt from the end face of the ferrule. End face of the ferrule (4) Carefully refit the optical input connector taking care not to scratch or otherwise damage the end face of the ferrule. 7.1.4 Cleaning the Cable Ferrule To clean the end of ferrule at the end of cable, use Ferrule Cleaner (Z0282)
-
Page 218: Storage Precautions
• There are active gases. Transporting Note the following precautions when repacking the MS9710B for transport. • Repack this analyzer in the original packing that the analyzer was delivered • Instruct the shipper to keep this analyzer horizontal as much as possible dur- ing shipping. -
Page 219: Troubleshooting
7.4 Troubleshooting Troubleshooting Problem Probable case Solution Power switch not on Switch on. AC power cord not properly connected to AC inlet or AC Connect AC power cord. No power socket Find reason why fuse blew and change fuse. Fuse blown Section 3.10 Initialization screen not Turn OFF the power supply. - Page 220 Section 7 Maintenance and Troubleshooting Problem Probable case Solution Measurement (sweep) is slow. Gate Time at Peak Hold is set Set Peak Hold to Off, or set appropriate Gate Time. Section 5.10 (Continue) too long. Resolution is set incorrect- ly. Set wide Resolution for Set appropriate Resolution.
- Page 221 7.4 Troubleshooting Problem Probable case Solution Measurement is impossible Resolution is set incorrectly. due to the noise when Set narrow Resolution for Set appropriate Resolution. Section 5.3 measuring low-level light. measuring wide-spectrum (Continue) light sources such as LEDs. Method does not change Erase markers at Marker Select screen.
- Page 222 Section 7 Maintenance and Troubleshooting Problem Probable case Solution Screen color setting is Set correct screen color. Screen color is unusual. Section 5.14 changed. GPIB/RS-232C cable is not Connect GPIB/RS-232C cable correctly. connected correctly. GPIB/RS-232C is not operating. RS-232C cable type is incor- Use RS-232C crossover cable.
- Page 223 Appendix Appendix A Specifications ........Appendix B Initial Settings ........Appendix C Error Codes ........Appendix D Relationship Between the Resolution, VBW, and Sensitivity ......Appendix E Checking Actual Display Resolution .. Appendix F Optical Fiber Cord ......Appendix G Example of Performance Test Result Record Sheet ........
- Page 224 Appendix Appn...
- Page 225 Appendix A Specifications This section describes the specification of the MS9710B Optical Spectrum Ana- lyzer. A.1 Wavelength ............A.2 Resolution ............A.3 Level ..............A.4 Others .............. A.5 White Light Source (Option 02) ....... A.6 SLD Light Source (Option 13 and 14) .....
- Page 226 Appendix A Specifications To obtain stable operation, allow at least 5 minutes to elapse after power-on. The following specifications are guaranteed 2 hours after power-on. If the in- strument is out-of-specification, perform automatic optical-axis alignment (Auto Align) and then keep the instrument at a constant temperature. Wl Cal (Ref) indicates calibration with the reference wavelength light source.
- Page 227 A.3 Level Level Level No Ref. Light Source With Ref. Light Source Measurement level Range 0 to 30°C 0 to 30°C (600 to 1000 nm) –65 to +10 dBm (1100 to 1600 nm) –70 to +20 dBm (1000 to 1250 nm) –85 to +10 dBm (1250 to 1600 nm) –90 to +10 dBm (1600 to 1700 nm) –75 to +10 dBm (1700 to 1750 nm) –55 to +10 dBm...
- Page 228 SLD Light Source (Option 13 and 14) SLD Light Source (Option 13 and 14) >–40 dBm (MS9710B Resolution: 1 nm, 1550 nm ±10 nm) Optical Output ±0.04 dB (for 20 min, 1550 nm of wavelength, with no Polarization drift, no...
- Page 229 A.9 Dimensions and Mass Functions Functions Measurement Functions Auto Measure, Pulse Light Measurement (External Trigger, Peak Hold), Power Monitor, Traking Measurement with TLS Display Functions Zoom, Overlap, Normalize, Max. Hold, 3D, Wavelength in Vacuum/Air, Actual Resolution, Display Clear, Title, Date/Time, Trace Memory A/B Resolution Functions Marker functions (2 wavelength markers, 2 level markers, Trace Marker, D Marker, Zone Marker), Peak/Dip Search, Waveform analysis (Threshold, n dB Loss,...
-
Page 230: Appendix A Specifications
Appendix A Specifications... - Page 231 Appendix B Initial Settings This section lists the factory default settings of the MS9710B Optical Spectrum Analyzer. The factory defaults can be returned at any time by pressing the key in Con- dition card, pressing the Recall function key , and selecting Memory Num- ber 0.
- Page 232 Appendix B Initial Settings Wavelength Card Setting Item Factory Default Setting Center 1350 nm Span 500 nm Start 1100 nm Stop 1600 nm Mkr Value Wl/Freq Value in Air/Vac Level Scale Card Setting Item Factory Default Setting Scale Select Log (/div) 10 dB/div Reference Level 20 dBm...
- Page 233 B.7 Graph Card Analysis Card Setting Item Factory Default Setting Status Threshold Cut Lvl: 3 dB ndB Loss ndB: 3 dB SMSR Side mode: 2nd Peak Envelope Cut Lvl: 3 dB 2.35 S-Level: 20 dB Save/Recall Card Setting Item Factory Default Setting File Option File Option: None...
- Page 234 Appendix B Initial Settings Application Card Setting Item Factory Default Setting Status DFB-ID ndB Width: 20 dB Side Mode: 2nd Peak FP-LD Mode Cut Lvl: 3 dB ndB Width: 3 dB Power Cal Factor: 1 Auto/Manual: Auto Mode Cal Factor: 1 O.
- Page 235 B.12 Others Card Measure Mode Card Setting Item Factory Default Setting Dynamic range Normal Peak Hold Gate Time: 1 ms Ext. Trigger 0 µs Delay Time: Interval Time 0 s (off) Power Monitor Wavelength: 1550 nm B.10 Title Card (Blank) B.11 Cal Card Setting Item...
-
Page 236: Appendix B Initial Settings
Appendix B Initial Settings... - Page 237 Appendix C Error Codes This section describes the Error Cards. C.1 System Error Codes (000 to 009) ....C.2 Measurement-related Errors (100 to 199) ..C.3 Key Operation Errors (200 to 299) ....Device-related Errors (300 to 499) ....
- Page 238 Appendix C Error Codes System Error Codes (000 to 009) Error Message Status Output Condition No error Optical Error (RAM) RAM error Optical Error (Slit-1) Slit-1 error Optical Error (Slit-2) Slit-2 error Optical Error (Wl Align) Wavelength alignment error Optical Error (Opt Att) Optical attenuator error Not used Optical Error (Light Source)
- Page 239 C.3 Key Operation Errors (200 to 299) Key Operation Errors (200 to 299) Error Message Status Output Condition Not used Input Value Error ESE-EXE Input value exceeds permitted range Not used Invalid In Smooth EXE-DDE Cannot be executed during Smooth processing Cannot be executed during Peak Hold measurement Invalid In Peak Hold EXE-DDE...
- Page 240 Appendix C Error Codes Error Message Status Output Condition Invalid In Analysis ESE-DDE Cannot be executed while Analysis mode selected Invalid In Swp-Avg ESE-DDE Cannot be executed while Sweep Analysis selected Set A Trace or B Trace ESE-DDE Not Trace A or Trace B Invalid In A–B, B–A Trace ESE-DDE Cannot be executed when trace is A–B or B–A...
-
Page 241: Index
Device-related Errors (300 to 499) Device-related Errors (300 to 499) Error Message Status Output Condition ¥ Errors relating to FD FD Does Not Exist ESE-DDE FD not inserted in FDD FD Format Error ESE-DDE FD format incorrect Can t Find File ESE-DDE Specified file not found FD Memory Full... -
Page 242: Appendix C Error Codes
Appendix C Error Codes... - Page 243 Appendix D Relationship Between the Resolution, VBW, and Sensitivity The relationship between the VBW, sweep speed and minimum received light sensitivity is shown in the following table. 10 Hz 100 Hz 1 kHz 10 kHz 100 kHz 1 MHz Sweep Speed (typ) 30 s 0.5 s 0.5 s...
-
Page 244: Appendix D Relationship Between The Resolution, Vbw, And Sensitivity
Appendix D Relationship Between the Resolution, VBW, and Sensitivity... -
Page 245: Appendix E Checking Actual Display Resolution
Appendix E Checking Actual Display Resolution This section explains improvement of display Resolution accuracy. Upgrading from the MS9710A to the MS9710B improves the accuracy of the actual display resolution in the 1530 to 1570 nm band. In addition, the defini- tion of Resolution has been changed from the half width value to the ratio be- tween the peak level and integrated power. - Page 246 Resolutions. Half width of the spectrum New method In the MS9710B, MS9710B, the actual Resolution is found from the following equation: where ∫ P (λ) dλ is the integrated spectrum of a single-mode oscillation light source, and P is peak level.
- Page 247 Appendix F Optical Fiber Cord The MS9710B uses a 10/125 µm optical fiber cord at the optical input. At mea- surement, if the core eccentricity of the optical fiber cord connector is large, there is a possibility that the specified level accuracy may not be met. Anritsu uses a specified master cord with an external diameter accuracy of better than 0.5 µm, a core eccentricity of less than 0.2 µm and a connection loss of less than...
-
Page 248: Appendix F Optical Fiber Cord
Appendix F Optical Fiber Cord... - Page 249 Appendix G Example of Performance Test Result Record Sheet Record No. : Test Location: Test Date: Tester: Tested Model: MS9710B Optical Spectrum Analyzer Serial No.: Power Supply Frequency: °C Ambient Temperature: Relative Humidity: Remarks MS9710B Optical Spectrum Analyzer No.: Date Wavelength Accuracy (0.1, 0.2 nm resolution)
-
Page 250: Appendix G Example Of Performance Test Result Record Sheet
Appendix G Example of Performance Test Result Record Sheet... - Page 251 Appendix H Automatic Measurement Processing The automatic measurement processing function of this equipment has been optimized for measurement of input light in the range of 1300 to 1550 nm. However, measurement is possible in the range of 900 to 1650 nm. The auto- matic measurement function procedure is outlined below.
-
Page 252: Appendix H Automatic Measurement Processing
Appendix H Automatic Measurement Processing... -
Page 253: Appendix I Switching Marker Frequency Display
Appendix I Switching Marker Frequency Display The marker frequency display switching function of this instrument switches the display of the trace marker, ∆ marker and analysis part between a wave- length value and frequency value. The items that can be switched between the wavelength and frequency displays are: the trace marker and ∆... - Page 254 Appendix I Switching Marker Frequency Display...
- Page 255 Appendix J Option 10 Installing Option 10 adds a marker frequency display function and a Table dis- play mode function for WDM applications. Note that these functions cannot be used when Option 10 is not installed. The following functions are added by installing Option 10: Marker frequency display switching function Pressing the function key at the Wavelength card toggles the marker...
-
Page 256: Appendix J Option 10
Appendix J Option 10... -
Page 257: Appendix K Limited Life Span Parts
Appendix K Limited Life Span Parts The MS9710B uses consumable parts for which the life span is determined ac- cording to the usage frequency (times). A fee will be charged for replacement of such parts due to end of life even if it is within the warranty period of the MT9080 Series. - Page 258 Appendix K Limited Life Span Parts...
- Page 259 Index Index 3D Display 5-52 Condition Save Function Key 5-102 3D Function Key 5-52 Connecting Optical Fiber 4-2 ↓: Next function key 5-23 ∆ Mkr Function Key 5-117 ←: Left Function Key 5-23 D. range Norm/Hi Function Key 5-90 ↑: Last function key 5-23 Date/Time Function Key 5-108 →: Right Function Key 5-24 Deleting Analysis Results 5-37...
- Page 260 Index Initializing Wavelength Calibration Data 5-100 Off Function Key 5-37 Interval Function Key 5-92 Opt. Amp Test Function Key 5-67 Interval Measurement 5-92 Opt. Att Off/On Function Key 5-15 Optical Attenuator 3-7 Optical Attenuator On/Off 5-15 l Mkr_A Function Key 5-115 Optical Connector 3-12 l Mkr_B Function Key 5-115 Optional Light Sources 3-11, 4-21...
- Page 261 Index Setting Screen Display Color 5-110 Setting Smoothing 5-20 Sampling Points Function Key 5-21 Setting Start Wavelength 5-10 Save Function Key 5-42 Setting Stop Wavelength 5-10 Save/Recall Card 5-41 Setting Sweep Average 5-19 Saving and Recalling Measured Data 5-41 Setting Sweep Width 5-9 Saving and Recalling Measured Waveforms 4-15 Setting Titles 5-95 Saving and Recalling Measurement Conditions 5-101...
- Page 262 Index Testing Performance 6-1, 6-5 Zone Center Function Key 5-118 Threshold Analysis 5-26 Zone Marker Key 5-118 Threshold Function Key 5-26 Zone Marker Screen 5-118 Title Card 5-95 Zone Mkr Erase Function Key 5-119 TLS Tracking Function 5-93 Zone Width Function Key 5-119 TMkr Function Key 5-116 ZoneÆSpan Function key 5-119 TMkrÆCenter Key 5-117...
Need help?
Do you have a question about the ms9710b and is the answer not in the manual?
Questions and answers