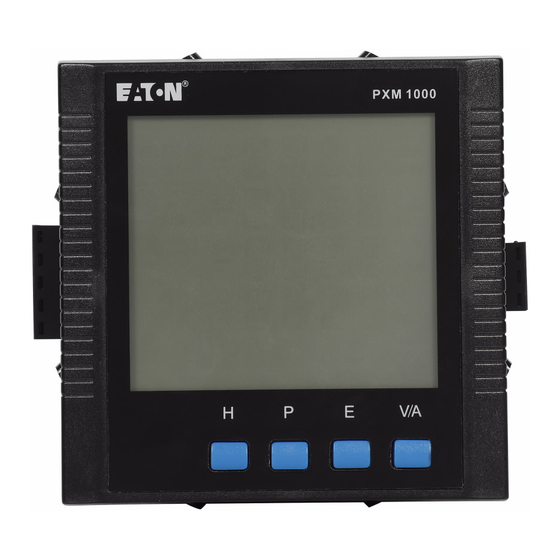
Eaton Power Xpert 1000 User Manual
Hide thumbs Also See for Power Xpert 1000:

Advertisement

PXM1000 User's Guide
December 30, 2017
Eaton Corporation

Advertisement

Table of Contents
loading
Need help?

Need help?

Do you have a question about the Power Xpert 1000 and is the answer not in the manual?

Questions and answers

Summary of Contents for Eaton Power Xpert 1000

  • Page 1 PXM1000 User’s Guide December 30, 2017 Eaton Corporation...
  • Page 2: Table Of Contents

    Contents Welcome to PXM1000 ..................2 Getting Started ....................3 2.1. New Connection ..................3 2.2. Connection Settings ................3 2.3. Add New Device ..................4 2.4. Connection ..................... 5 2.5. Getting Help ................... 5 User Interface ....................6 3.1. Main Window ..................
  • Page 3: Welcome To Pxm1000

    1. Welcome to PXM1000 Developed by Eaton Corporation, PXM1000 software is designed for the PXM 1000 series power meters. PXM1000 software provides user-friendly real-time monitoring and data logging features for energy saving and power quality analysis. The purpose of this software is to provide a tool for users to monitor multiple parameters continuously and it allows users to monitor and maintain the meter on a real-time basis.
  • Page 4: Getting Started

    2. Getting Started 2.1. New Connection A connection is required before communicating with the meter. To add a new connection, do one of the following: 1) Click Settings > Connection Manager. 2) Click the icon The Connection Manager is shown as Figure 2.1. Figure 2.1.
  • Page 5: Add New Device

    Figure 2.2. New Connection Name: Give connection a name.  Type: Select Serial Port for RS485; Select Network for Modbus TCP gateway (for  example, PXM1000 + PXM1000-MTCP). Com Port: Select the serial port that the RS485 connection is using. ...
  • Page 6: Connection

    2.4. Connection You can read all the measurement data after you successfully complete Step 3. To connect, do one of the following: 1) Click Operation > Connect. 2) Click the icon 3) Press F9 on keyboard. Notice: If you cannot start communication normally, please make sure the physical connection of the device is correct and the communication setting parameters are properly configured.
  • Page 7: User Interface

    3. User Interface 3.1. Main Window Figure 3.1. Main Window The main window includes a menu bar, a toolbar, a workspace and a status bar. The workspace displays meter windows. The status bar displays messages. As shown in Figure 3.1, the following includes a description of all items: A -- Menu bar B -- Toolbar C -- Window title: Displays connection, device address, device description, connection...
  • Page 8 3.2.1. Operation Connect: Connect to the device, read data and allow write command. Disconnect: Disconnect the device, stop data reading and disallow write command. Start Data Logging: Record data at the set logging interval. Stop Data Logging: Stop recording. Add Device: Add a new device that is going to be connected. Delete Current Device: Delete current active device.
  • Page 9: Toolbar

    3.3. Toolbar Connect: Connect device, read data and allow write command. Disconnect: Disconnect device, stop data reading and disallow write command. Start Data Logging: Record data at the set logging interval. Stop Data Logging: Stop recording. Add Device: Add a new device that is going to be connected. Delete Current Device: Delete current active device.
  • Page 10: Functions

    4. Functions 4.1. Basic Monitoring 4.1.1. Add new connection. Refer to the New Connection section. 4.1.2. Set connection parameters. Refer to the Connection Settings section. 4.1.3. Add device window. Refer to the Add New Device section. 4.1.4. Connect. Refer to the Connection section.
  • Page 11: Data Logging

    Figure 4.3. Device Manager Device List: Displays all available devices. Every listed item displays its detailed  communication status. Device Total: The total number of devices.  Com Normal Total: The total number of devices which communicate normally.  Com Failure Total: The total number of devices which fail the communication. ...
  • Page 12 The Data Log Settings box is shown as Figure 4.4. Figure 4.4. Data Log Settings Device List: Displays all available devices which are working in data logging mode.  It also can enable or disable data logging of any device. Every listed item displays the monitoring parameters of corresponding device.
  • Page 13 Input and the Analog Input items in the data log file. It can be name or name(unit). Log file name: For users to set name of a log file. If the name of Log file is blank,  the default file name will be used. Click [Default] button to use the default file name.
  • Page 14 Open and choose the desired files in the dialog box. Copy the desired files to another computer and open them on that computer. 4.3.5. Data Log file After you open a data log file of excel format, you can see the following items: Real-Time: Real-Time Metering Demand: Demand Energy: Real-Time Energy...
  • Page 15 Pwr Factor C Pwr Factor Total Demand  Watt Total VAR Total VA Total Energy  EP_IMP Ep_imp EP_IMP_A Ep_imp_a EQ_IMP_A EQ_imp_a EP_EXP Ep_exp EP_IMP_B Ep_imp_b EQ_IMP_B EQ_imp_b EQ_IMP Eq_imp EP_IMP_C Ep_imp_c EQ_IMP_C EQ_imp_c EQ_EXP Eq_exp EP_EXP_A Ep_exp_a EQ_EXP_A EQ_exp_a EP_EXP_B Ep_exp_b EQ_EXP_B...
  • Page 16 Counter  DI_1101 PXM-110 DI1 DI_2101 PXM-210 DI1 DI_3101 PXM-310 DI1 DI_1102 PXM-110 DI2 DI_2102 PXM-210 DI2 DI_3102 PXM-310 DI2 DI_1103 PXM-110 DI3 DI_2103 PXM-210 DI3 DI_3103 PXM-310 DI3 DI_1104 PXM-110 DI4 DI_2104 PXM-210 DI4 DI_3104 PXM-310 DI4 DI_1105 PXM-110 DI5 DI_1106 PXM-110 DI6 DI_1201...
  • Page 17: Import/Export Device Profile

    UA_H31 UB_H31 UC_H31  IA_H2 IB_H2 IC_H2 IA_H3 IB_H3 IC_H3 IA_H4 Harmonic I A IB_H4 Harmonic I B IC_H4 Harmonic I C IA_H31 IB_H31 IC_H31 PhageAngle  Ph Angle VAN/VAB IA_UA Ph Angle IA(VAN/VAB) Ph Angle VBN/VBC IB_UA Ph Angle IB(VAN/VAB) Ph Angle VCN/VCA IC_UA Ph Angle IC(VAN/VAB)
  • Page 18: Pxm1000 Series

    4.5. PXM1000 Series This chapter introduces some of the functions of PXM 1000/1100/1200/1300. In order to understand the software abilities, please thoroughly read PXM1000 User’s Manual. 4.5.1. Readings 4.5.1.1. Energy (PXM1000) You can modify the value of energy by clicking underlined characters. Figure 4.5.1.
  • Page 19 4.5.1.3. Sequence Component (PXM1000) Φuaia is the angle between I A and V A. The broken-line circle on the outside indicates 100% of full range. Figure 4.5.3. Positive Sequence As shown in Figure 4.5.3, the following includes a description of all items: A -- Full range indicator B -- Vector expression C -- Angle between I A and V A...
  • Page 20 Figure 4.5.4. I/O Modules 4.5.1.5. Data Log (PXM1100) There are three ways of retrieving the logs: "read newest 50 records", "read one window" and "read 1000 records". Figure 4.5.5. Data Log As shown in Figure 4.5.5, the following includes a description of all items: A -- Data Log 1 status B -- Data Log 2 status...
  • Page 21 C -- Data Log 3 status D -- Select types before read logs E -- Data area 4.5.1.6. Waveform Log (PXM1300) There are two functions in waveform log: Click Retrieve Waveform button to read the data corresponding to the selected item, and the Data column will remain after reading. It will then draw a waveform graph automatically.
  • Page 22 Figure 4.5.7. Waveform Log (2) Click the Save button, then you can save the data of selected items as a txt/csv/xls file for future analysis. In typical waveform as is shown in Figure 4.5.8, the following includes a description of all items: A -- Capture time and reason B -- Capture time when capturing condition is satisfied...
  • Page 23: Settings

    4.5.2. Settings 4.5.2.1. General (PXM1000) Figure 4.5.10. General Settings (serial connection) Figure 4.5.11. General Settings (network connection)
  • Page 24 Figure 4.5.12. Change Password A -- As shown in Figure 4.5.10, in the serial connection, Password is visible and displays with decimal number. B -- As shown in Figure 4.5.11, in the network connection, Password is not visible. Instead of decimal numbers, it is displayed as ‘*’. Click Change Password button and the Change Password window which is shown in Figure 4.5.12 will appear.
  • Page 25 A -- Channel and Unit of AO Input B -- Range and Unit of AO Output C -- Value without unit 4.5.2.3. Alarm (PXM1000) Notice: When you set the Set Point of the alarm limit, there is no unit for it. All units are displayed in the Alarm Channel.
  • Page 26 Figure 4.5.15. Data Log 1 Settings 4.5.2.5. TOU (PXM1200) As shown in Figure 4.5.16, there are three respective formats. A: MM-DD ID. MM is Months, DD is Days, ID is the Number of a Schedule. B: The same as A. C: HH-MM ID.
  • Page 27 Figure 4.5.17. TOU Holiday 4.5.2.7. Pulse Input (PXM1000) As shown in Figure 4.5.18, When DI Type is state, the options are disabled. When DI Type is counter, they are enabled. Advanced Option button is used to define the Category and the Unit. The Advanced Option window is shown in Figure 4.5.19.
  • Page 28 Figure 4.5.19. Advanced Options 4.5.2.8. Analog Input (PXM1000) As shown in Figure 4.5.20, Advanced Option button is used to define the Category and the Unit. Figure 4.5.20. Analog Input...
  • Page 29: Troubleshooting

    5. Troubleshooting Why is the drop-down list of the Com Port in Connection Settings dialog empty? Answer: the program has not detected any available serial port, please check if it is any idle. Why is there no new waveform in the list after I clicked Capture Waveform button? Answer: the waveform buffer is full.
  • Page 30: Installation

    6. Installation 6.1. Installing Double click setup file, follow the guide step by step. Notice: Software can be installed to a different directory (up to 8). 6.2. Uninstalling To remove this program from your system: Open the Windows Control Panel, double-click Add/Remove Programs. Find the application name in the list and select it.

This manual is also suitable for:

Pxm1000

Table of Contents

Save PDF