
Subscribe to Our Youtube Channel
Related Manuals for FLIR SV87-KIT


Summary of Contents for FLIR SV87-KIT
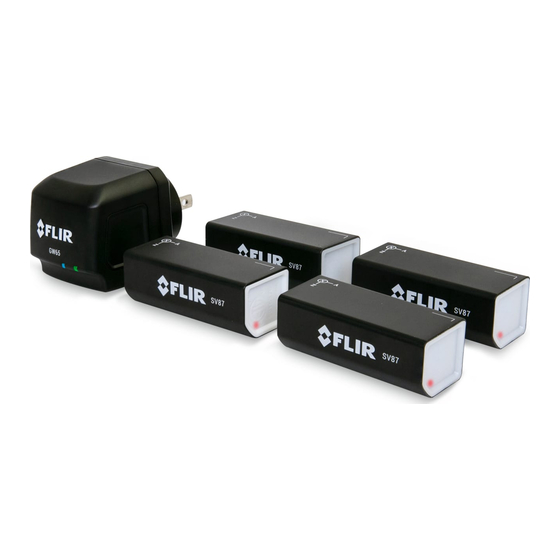
- Page 1 User Manual Vibration Monitoring Solution SV87–KIT (GW65 Remote Monitoring Gateway and SV87 Vibration / Temperature Remote Sensors)
- Page 3 User Manual Vibration Monitoring Solution #NAS100051; r. AB/72169/72169; en-US...
-
Page 5: Table Of Contents
Table of contents Advisories ................1 Copyright ..............1 Quality Assurance ............1 Documentation ............1 Disposal of Electronic Waste ......... 1 Introduction................2 Safety ................5 Product Descriptions............7 Product Call-Out Description ......... 7 Remote Monitoring Gateway GW65 Overview....7 SV87 Remote Sensor Overview........7 Mobile App Overview .......... - Page 6 Preparing the Windows PC App ........28 ‘Historical Sensors’ Option.......... 29 Preparation for Sensor Placement ........ 29 Mobile App ............... 30 FLIR Mobile App Screens........... 30 Trend Charts............34 Windows PC App............... 37 10.1 Windows App Opening Screen ........37 10.2...
-
Page 7: Advisories
The documentation must not, in whole or part, be copied, photocopied, repro- duced, translated or transmitted to any electronic medium or machine-read- able form without prior consent, in writing, from FLIR Systems. Names and marks appearing on the products herein are either registered trademarks or trademarks of FLIR Systems and/or its subsidiaries. -
Page 8: Introduction
Introduction The FLIR Vibration Monitoring Solution allows you to monitor machinery for excessive vibration and over-temperature conditions using a mobile device exclusively (stand-alone) or a combination of Windows PC and mobile device. Accelerometers in the Remote Sensors measure changes in vibration. Ther- mometers in the Remote Sensors measure surface Temperature. - Page 9 Introduction Figure 2.4 Monitoring vibration and temperature in chillers. Vibration measurements look at the frequency (velocity), amplitude (strength), and acceleration (intensity) of the vibration. Figure 2.5 Vibration frequency (left), amplitude (centre), and acceleration (right) Vibration measurements provide insight into potential mechanical issues. This device is well suited for identifying imbalances, eccentricity, loose parts, and misalignment.
- Page 10 Introduction • GW65 Remote Monitoring Gateway. Communicates with Remote Sen- sors over Bluetooth and transmits measurement data over Wi-Fi. Multiple Gateways can be used for optimum coverage of large test sites. • SV87 Remote Sensors. Attach to machinery and transmit measurement data and battery status via Bluetooth to the Remote Monitoring Gateway.
-
Page 11: Safety
• Please read all safety information and user manual instructions before us- ing these devices. • No user serviceable equipment. Please contact FLIR for all service and re- pair inquiries. • Use these devices only as described in the provided documentation. Fail- ure to do so can impair the devices’... - Page 12 Safety WARNING Applicability: Class B digital devices. This equipment has been tested and found to comply with the limits for a Class B digital device, pursuant to Part 15 of the FCC Rules. These limits are designed to provide reason- able protection against harmful interference in a residential installation.
-
Page 13: Product Descriptions
Product Descriptions 4.1 Product Call-Out Description Figure 4.1 Remote Monitoring Gateway GW65 (left) and SV87 Remote Sensor (right). 1. GW65 AC plug side 2. GW65 Power LED (blue light when powered) 3. GW65 Communications LED (green for active communications; amber for inactive communications) 4. -
Page 14: Mobile App Overview
Product Descriptions 4.4 Mobile App Overview The mobile app is available from the FLIR website (link below), the App Store (iOS devices), or Google Play (Android devices). With the mobile app you can communicate with Gateways over a Wi-Fi network. -
Page 15: Quick Steps
1. Plug the Gateway into an AC outlet. The blue power LED and amber com- munication LED will light. The communication LED turns green when com- munication is established with the Wi-Fi network. 2. Download the FLIR Remote Monitoring app for Android (Google Play) or iOS device (App Store). #NAS100051; r. AB/72169/72169; en-US... - Page 16 Quick Steps 3. Open the app on your mobile device and tap ‘STAND-ALONE’ on the opening app screen. 4. Tap the + Add Gateway command. #NAS100051; r. AB/72169/72169; en-US...
- Page 17 Quick Steps 5. A three-step information screen will appear. Tap START. 6. The STEP 1 screen will appear. Tap CONNECT. 7. The Gateway name should appear on the Gateway List. #NAS100051; r. AB/72169/72169; en-US...
- Page 18 10. Tap the name of your network in the Wi-Fi Router List. 11. Type the network password when prompted. 12. Tap NEXT when communication is successful. If not successful, repeat the above steps; contact FLIR if issues persist. #NAS100051; r. AB/72169/72169; en-US...
-
Page 19: Quick Steps For Windows Pc Operation
Section 9, Mobile App. 5.2 Quick Steps for Windows PC Operation 1. Connect the Windows PC to the local Wi-Fi server network. 2. Download, install and open the FLIR Gateway Windows app. Link to app: https://support.flir.com/remote monitoring. - Page 20 Quick Steps 8. Tap +Add Server to begin the process of connecting to the Wi-Fi network, unless you see the PC machine name already on the Server List (as shown in the image below). If so, tap the machine name and continue with step 14.
- Page 21 Quick Steps 13. Tap Continue in the mobile app. After several seconds your PC machine name should appear on the mobile app. 14. Tap the PC name on the mobile app and tap the +Add Gateway com- mand when prompted. A three-step information screen will appear. #NAS100051;...
- Page 22 Quick Steps 15. Tap Start. The STEP 1 screen will appear. Tap Connect. 16. The STEP 2 screen will appear, tap Continue. Note that STEP 3 is the Sensors activation step, not covered in these quick steps. See Section 9, Mobile App, for instructions.
- Page 23 Gateway list. Click the Refresh button and repeat these steps if you do not see the Gateway on the list. Contact FLIR if issues persist. 21. When the Gateway appears on the list you are ready to add sensors as ex- plained in Section 9, Mobile App.
-
Page 24: Sensor Installation
Sensor Installation NOTE Do not permanently affix sensors to assets until you’ve allowed sufficient time to ensure sta- ble communication between sensors and Gateways in their temporary positions. 6.1 Sensor Placement Considerations When considering test point sensor locations, the individual parts of the equipment and its operation should be well understood. - Page 25 Sensor Installation Figure 6.1 Examples of areas to place sensors. #NAS100051; r. AB/72169/72169; en-US...
- Page 26 Sensor Installation Figure 6.2 SV87 Sensors shown mounted on machinery. #NAS100051; r. AB/72169/72169; en-US...
-
Page 27: Where Sensors Should Not Be Placed
Sensor Installation 6.3 Where Sensors should not be placed CAUTION Do not mount sensors on the following locations: • Motor winding areas • Middle of motor • Pump casing • Cooling fan fins/covers • Coupling belt guards, gearboxes • Seal locations Figure 6.3 Examples of places you should not mount sensors. -
Page 28: Documenting Sensor Locations
Sensor Installation Ensure that coverage of equipment is sufficient regarding the number of sen- sors. Ten (10) sensor will work in most circumstances, given no obstruction between Gateway and sensor. The key factor is obstruction since, with no ob- struction, it is possible to have more than ten sensors operating normally. Use multiple Gateways to accommodate more sensors and to ensure proper cov- erage of a test site. -
Page 29: Mapping A Test Site
Mapping a Test Site To best maintain a test site, it is important to keep a list of asset (equipment) names and their types, classifications, and locations. Depending on the size of the operation, a site map may also be needed to show machine locations and the test points where sensors are attached to assets. -
Page 30: Communication Preparation
If you’ll be communicating using a Win- dows PC, you’ll need the Windows PC app and the mobile app. The mobile app is available from the App Store, Google Play, or FLIR website (link below). The Windows app is available from the FLIR website. -
Page 31: Windows Pc Operation Block Diagram
Communication Preparation This diagram shows how a test system is configured using a smart device. The sensor, on a monitored asset, automatically sends vibration and tempera- ture data to the gateway every 90 seconds (via Bluetooth). The Gateway transmits sensor data to the smart phone using Wi-Fi. The smart device alerts the user to abnormal vibration or temperature readings. -
Page 32: Preparing A Communications System
Communication Preparation Figure 8.2 Block diagram of a system controlled by a Windows PC. The GW65 Gateway communicates with the SV87 Sensor using Bluetooth and with the smart phone through a Wi- Fi router. The PC is shown communicating with the network using a direct Ethernet connection. -
Page 33: Preparing The Mobile App
See Section 7, Mapping a Test Site, for more information. 8.4 Preparing the Mobile App Figure 8.3 FLIR mobile app installed on mobile device (above, left) and opening screen (above, right). Figure 8.4 Adding a new network or selecting an existing one. -
Page 34: Preparing The Windows Pc App
5. Communication to the network should now be established. 6. If you are unable to connect to the Wi-Fi network, please verify that the credentials are correct. Contact FLIR support if connection issues persist. 7. Once the setup and preparation are complete, follow the detailed instruc- tions in Section 9, Mobile App. -
Page 35: Historical Sensors' Option
To maintain a test site using a Windows PC, download the Windows app and mobile app (for iOS or Android) from the FLIR support site shown below. Fol- low the preparation steps below and then continue with the instructions in Section 10, Windows App. -
Page 36: Mobile App
Mobile App 9.1 FLIR Mobile App Screens Once communication between all devices in the test system is verified, follow the instructions below. The numbered steps below correspond to the numbered screen shots. 1. Tap an existing Gateway from the list or tap + Add Gateway to add a new Gateway. - Page 37 Mobile App 8. Naming Assets and Setting Test Points (informational page). Tap Continue. 9. Sensor Settings. The top blue box shows the selected sensor and its cur- rent reading, tap the X to remove it. Tap the lower blue box to continue with the sensor group, asset, and test point setup.
- Page 38 Mobile App 16. Name the test point, take a photo, and tap Continue when done. 17. View the test point name and photo. When satisfied, tap Save. 18. Configuration screen. View the sensor ID, Gateway name, asset/group names, test point name, and vibration/temperature units of measure. Tap a pencil icon to edit a field.
- Page 39 Mobile App 24. Tap a pencil icon to edit a field. Tap Install Sensors to complete the setup. 25. For a successful installation, tap Finish Setup. If there is an error, retry the setup steps. 26. List of installed sensors. Tap Finish Setup. 27.
-
Page 40: Trend Charts
Mobile App 9.2 Trend Charts As shown in screens 28 and 29 above. The mobile app shows a representa- tion of logged data on a trend chart and in a MAX/MIN data table (below the graph). Additional trend chart details are provided below. The numbered steps below correspond to the accompanying numbered screen shots. - Page 41 Mobile App 6. FFT data screen. See FFT Section 11 for technical FFT information. 7. Select Velocity measurement data by tapping the Vel. tab as shown. 8. Velocity data is shown on the trend chart. Tap a region of the chart to open its measurement and time stamp information.
- Page 42 Mobile App 11. FFT data screen. See FFT Section 11 for technical FFT information. #NAS100051; r. AB/72169/72169; en-US...
-
Page 43: Windows Pc App
Windows PC App To monitor a test site using a Windows PC, download the Windows applica- tion from the FLIR support site (link below). Open the application and follow the instructions below. Ensure that all devices (mobile device, Gateway, and sensors) reside on the same IP sub-network, assigned from the shared router or AP (access point). -
Page 44: Exporting Measurement Data As .Csv Formatted File
Windows PC App Figure 10.1 Windows App opening screen with Information tab selected. 10.2 Exporting Measurement Data as .csv Formatted File Export data as .csv file for use in a spreadsheet. Figure 10.2 Exporting measurement data as .csv file. #NAS100051; r. AB/72169/72169; en-US... -
Page 45: Sensors Tab
Windows PC App Figure 10.3 Example .csv data file. 10.3 Sensors Tab Click the Sensors tab to view sensor information and battery status. Refer to Figure 10.4, below, for this numbered list. 1. List of alarm types. 2. Click to open the alarm threshold editing utility. 3. - Page 46 Windows PC App Figure 10.5 Using the edit tool to configure sensor alarms. Figure 10.6 Opening a Trend Chart. Click on a point on a graph line to see instantaneous date/time and measurement values. Figure 10.7 To open an FFT graph, as shown in this figure, double-click on any measure- ment point from a Trend Chart (shown in Figure 10.5).
-
Page 47: Alarm Status Tab
Windows PC App Figure 10.8 Configuring the system to send automatic alarm email alerts. 10.4 Alarm Status Tab Click the Alarm tab to view alarm activity. Refer to Figure 10.9, below, for this numbered list. 1. Refresh the screen. 2. Mark the selected alarm as ‘read’. 3. -
Page 48: Archived Sensors
Windows PC App Figure 10.9 Alarm Status tab screen. 10.5 Archived Sensors Configurations can be archived for future reference by clicking on ARCHIVE in the Information tab as shown at the start of this section in Figure 10.1. In Figure 10.10, below, the archive screen is shown when an archived configura- tion is selected. -
Page 49: Fast Fourier Transform (Fft)
This is useful in the representation of vibration measurements. For example, Velocity graphs, in the FLIR mobile and Windows apps, are derived from FFT analysis of Acceleration measurements. 11.2 Time-Domain and Frequency-Domain Methods Time and frequency domain vibration measurement methods can both be em- ployed to study vibration measurements. - Page 50 Fast Fourier Transform (FFT) • Looseness is evidenced by a marked increase in the number of harmonics. If there is looseness in the main support of the asset, an increase in the fundamental frequency amplitude will also be noticed. Figure 11.1 Graph on left shows a normal system; Centre graph shows a balance issue; Graph on right shows a misalignment issue.
-
Page 51: Toggling Stand-Alone And Local Server Modes
Toggling Stand-Alone and Local Server Modes Once you set up your test system as either a ‘Stand-Alone’ or ‘Local Server’ configuration, switching to the opposite mode requires a few steps prepara- tion. If you attempt to setup in Local Server mode, after you’ve setup in Stand- Alone mode, for example, you’ll receive an error message on the mobile app. - Page 52 Toggling Stand-Alone and Local Server Modes To switch from the Stand-Alone mode to the Local Server mode, follow these steps. 1. Navigate to the opening mobile app screen and select Stand-Alone mode. 2. Step to the + Add Gateway screen, where the currently connected Gate- way name will be shown.
-
Page 53: Gw65 Field Firmware Updates
4. The app will show the ‘Update Complete’ message when done. 5. The GW65 will reboot and operation will continue normally. If you have questions or update issues, please contact FLIR. Figure 13.1 GW65 Gateway Firmware Update Using Mobile App. -
Page 54: Three-Year Limited Warranty
Three-Year Limited Warranty This product is protected by FLIR’s 3-Year Limited Warranty. Visit www.flir.com/testwarranty to read the 3-Year Limited Warranty document. #NAS100051; r. AB/72169/72169; en-US... -
Page 55: Customer Support
CUSTOMER SUPPORT Customer Support Telephone List: https://support.flir.com/contact Repair, Calibration, and Technical Support https://support.flir.com #NAS100051; r. AB/72169/72169; en-US... -
Page 56: Specifications
Specifications 16.1 GW65 Remote Monitoring Gateway Specifications -13 ℉ ~ +149 ℉ (-25 ℃ ~ +65 ℃) Operating and Storage Temperature Operating Relative 10 ~ 95% non-condensing Humidity Altitude 6562 ft. (2000 m) Data back-up 32 MB flash memory available for power outages. 5 days of data for 4 sensors or 20 days of data for one sensor can be stored maximum. -
Page 57: Sv87 Remote Sensor Specifications
Specifications 16.2 SV87 Remote Sensor Specifications Measurements Acceleration: ± 32 g (gravitational constant) Velocity data (mm/s or in/s) displayed in the mobile and Windows apps, derived from FFT. Contact temperature trend range: –22℉ ~ +176℉ (–30℃ ~ +80℃) Frequency Range 10 Hz ~ 1 kHz Sampling rate One data point captured / 90 seconds... - Page 58 #NAS100051; r. AB/72169/72169; en-US...
- Page 60 Customer support http://support.flir.com Copyright © 2020, FLIR Systems, Inc. All rights reserved worldwide. Disclaimer Specifications subject to change without further notice. Models and accessories subject to regional market considerations. License procedures may apply. Products described herein may be subject to US Export Regulations.
Need help?
Do you have a question about the SV87-KIT and is the answer not in the manual?
Questions and answers