Table of Contents
Advertisement
Quick Links
Advertisement
Table of Contents

Related Manuals for PCE Health and Fitness PCE-TT 100


Summary of Contents for PCE Health and Fitness PCE-TT 100
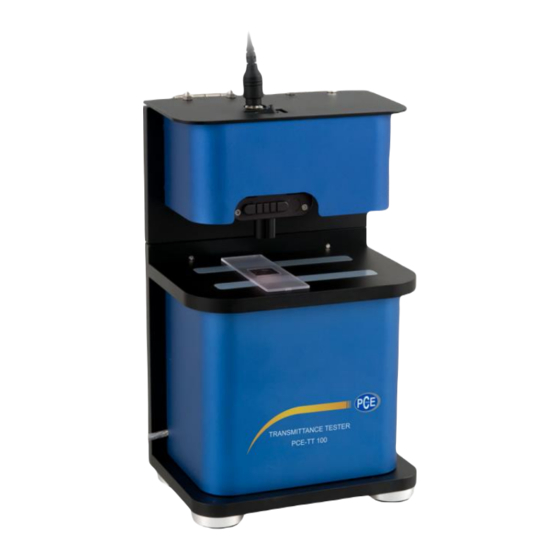
- Page 1 User Manual PCE-TT 100 Light Transmission Meter User manuals in various languages (français, italiano, español, português, nederlands, türk, polski, русский, 中文) can be found by using our product search on: www.pce-instruments.com Last change: 17 August 2020 v1.0 © PCE Instruments...
-
Page 2: Table Of Contents
Contents Safety notes ................... 1 Technical specifications ..............2 General technical specifications ..................2 Technical specifications transmission measurement ............2 System requirements ................3 Hardware requirements ....................3 Software requirements ..................... 3 Installation of DotNet ......................4 Installation of IO-Module ....................4 Installation of the spectrometer driver ................ -
Page 3: Safety Notes
Safety notes Please read this manual carefully and completely before you use the device for the first time. The device may only be used by qualified personnel and repaired by PCE Instruments personnel. Damage or injuries caused by non-observance of the manual are excluded from our liability and not covered by our warranty. -
Page 4: Technical Specifications
Technical specifications General technical specifications Resolution 0.8 ... 1.5 nm Measurement range wavelength 300 ... 1100 nm 380 ... 780 nm Signal-to-noise ratio <0.1 % A/D resolution 16 bits Integration time 1 ms ... 24 s Interface USB, GPIO Power supply External mains adaptor Dimensions (H x W x D) 23.4 x 14 x 10.3 cm... -
Page 5: System Requirements
System requirements Hardware requirements Minimum CPU: 2.4 GHz Minimum RAM: 1 GB Minimum screen resolution: 1024 x 768 pixels Minimum available capacity on the hard disk: 500 MB Software requirements Only Windows based operating systems are supported: Windows XP SP3 Windows Vista Windows 7 Windows 8... -
Page 6: Installation Of Dotnet
Installation of DotNet If the message "Require Microsoft .NET 4.0" appears, the DotNet package must be installed first. This is located in the DotNet folder. To do this, run the following files: DotNet\DotNetFX35\dotNetFx35setup.exe DotNet\DotNetFX40\dotNetFx40_Full_x86_x64.exe Installation of IO-Module Execute the following files: USB IO Module \ CP210x_VCP_Windows \CP210xVCPInstaller_x64.exe USB IO Module \ CP210x_VCP_Windows \CP210xVCPInstaller_x86.exe Use the USB cable and connect the IO Module to a computer. -
Page 7: Installation Of The Spectrometer Driver
Installation of the spectrometer driver All the preparation steps described above must be completed beforehand. Afterwards please proceed as follows: The installation file can be found on the CD-ROM. Please execute it to start the installation. (If the installation is to be performed on a computer running Windows 8, please check how to perform this installation. -
Page 8: Uninstalling Software
Uninstalling software Open the Control Panel and select the sub-item "Programs" and then "Uninstall a program". Click on the program to be removed and follow the instructions. © PCE Instruments... -
Page 9: Getting Started
Getting started Check that the transmission meter is correctly connected to a computer via the USB cable. Make sure that the measuring instrument is connected to the mains power supply and switch it on. Start the software on the PC. When all the above measures have been taken, the following graph is displayed: If the error message shown below appears, the software must be terminated. -
Page 10: Description Of The Software Interface
Description of the software interface Main screen The main screen is used to collect measurement data in real time to find the appropriate reference source after setting the parameters. Toolbar: Selection of the preferred functions for the measuring process Intensity display: Here you can see the intensity. - Page 11 4.1.1 Function bar File: Load or save the absorbance value. Language: Language selection (English, Chinese, Japanese) © PCE Instruments...
- Page 12 Setting: Shows the information about the spectrometer and you can set the wavelength range or a specific wavelength. Help: Shows the user manual and information about PCE Instruments. You can see the company profile including contact details. Light: Here the light settings can be made. To do this, set the module to ON / OFF (only with IO Module).
- Page 13 Avg. Time: The total measuring time is increased/decreased if a higher/lower average measuring time is selected. Smoothness: If the value is increased, the curve of the band width becomes smoother. Data record: When "Data Record" is called up, a drop-down menu appears, allowing a specific data record to be called up that has been previously saved.
- Page 14 CIE 1931 / CIE 1976 Chromaticity diagram Open file: Open previously saved measurement data. Save to: Save measurement data. © PCE Instruments...
- Page 15 Export to Excel: Save measurement results to an Excel file. © PCE Instruments...
- Page 16 Report output: The input of measurement data into a report can be used to store and read the measurement data. The software can be used for this. © PCE Instruments...
- Page 17 Wavelength Reports: All measurement data of the wavelength (above) are displayed directly in the software. Single data display: In this menu item, the determined measurement data can be displayed individually, taking reference points into account. © PCE Instruments...
- Page 18 4.1.2 Static / dynamic data Static data: Measurement information obtained after the measurement Dynamic data: Measurement information obtained directly during the measurement © PCE Instruments...
- Page 19 4.1.3 Penetration index data Transmittance of Specific Wavelength1: The transmission value is displayed in such a way that the user-defined bandwidth is taken into account. Avg. Transmittance of Visible Light: Display of the average value of the visible light transmission Uniformity of Visible Light Preference: The higher the visible light transmission, the higher the average value of flatness.
- Page 20 4.1.4 Display of the percentage transmission of the measurement range Right-click on the transmission spectrum to display the transmission measurement range. In the following figure, the measurement range is at a penetration of 50 %. © PCE Instruments...
-
Page 21: Operation
Operation Creation of a reference curve Connect the light source to the mains power supply and use the switch to switch it on. Click on "Reset". If you have selected "Dynamic Data", the measured values are displayed in real time. "Static data"... -
Page 22: Start Measurement
Start measurement After zeroing has been performed and before the test object has been placed on the measuring table, the "Start Measurement" button can be clicked on. No measurement data should then be displayed. Now the red spectrum will form the baseline. The red and green lines will coincide when there is no test object on the test table. -
Page 23: Haze Measurement With Photometer Sphere
Haze measurement with photometer sphere If you have a photometer sphere, you can use it to measure turbidity. Please note the following steps: Connect the light source to the mains power supply and switch it on. Click on "Haze measurement". This will open several windows that will help you to perform the measurement. -
Page 24: Warranty
Warranty You can read our warranty terms in our General Business Terms which you can find here: https://www.pce-instruments.com/english/terms. Disposal For the disposal of batteries in the EU, the 2006/66/EC directive of the European Parliament applies. Due to the contained pollutants, batteries must not be disposed of as household waste. They must be given to collection points designed for that purpose. - Page 25 PCE Instruments contact information Germany France Spain PCE Deutschland GmbH PCE Instruments France EURL PCE Ibérica S.L. Im Langel 4 23, rue de Strasbourg Calle Mayor, 53 D-59872 Meschede 67250 Soultz-Sous-Forets 02500 Tobarra (Albacete) Deutschland France España Tel.: +49 (0) 2903 976 99 0 Téléphone: +33 (0) 972 3537 17 Tel.
Need help?
Do you have a question about the PCE-TT 100 and is the answer not in the manual?
Questions and answers