Anritsu Network Master Pro MT1000A Operation Manual
Hide thumbs
Also See for Network Master Pro MT1000A:
- Remote scripting operation manual (996 pages) ,
- Operation manual (605 pages) ,
- Quick reference manual (36 pages)
Table of Contents
Advertisement
Quick Links
Advertisement
Table of Contents

Related Manuals for Anritsu Network Master Pro MT1000A


Summary of Contents for Anritsu Network Master Pro MT1000A
- Page 1 MT1000A MU100010A Network Master Pro Operation Manual Eighth Edition For safety and warning information, please read this manual before attempting to use the equipment. Keep this manual with the equipment. ANRITSU CORPORATION Document No. M-W3682AE-8.0...
- Page 2 Operation Manual 25 June 2014 (First Edition) 18 September 2015 (Eighth Edition) © Copyright 2014-2015, ANRITSU CORPORATION. All rights reserved. No part of this manual may be reproduced without the prior written permission of the publisher. The contents of this manual may be changed without prior notice.
- Page 3 About This Manual The documentation for MT1000A Network Master Pro applies to the instrument with the MU100010A 10Gig Multirate Module installed. This operation manual describes both the basic operation of the instrument as well as the operations available via interface options and predefined applications/tests.
-
Page 4: Table Of Contents
Table of Contents Table of Contents 0 Table of Contents 1 Introduction 1.1 Mainframe 1.2 10G Multirate Module (MU100010A) 1.3 Symbols and Conventions 1.3.1 Symbols Used in Manual 1.3.2 Safety Symbols Used on Equipment 1.3.3 Notes 1.3.4 Hints 1.3.5 Option 1.4 Warnings 1.5 Cautions 1.5.1 Cautions against Computer Virus Infection... - Page 5 Table of Contents 3.7 File Access via USB Interface 3.8 File Access via Ethernet Interface 3.8.1 Accessing files in Network Master from the PC 3.8.2 Mounting the Shared Folder of Networked PC to the Network Master 3.9 External GPS Receiver 3.10 Remote Control via GPIB 4 Graphical User Interface 4.1 General Handling of the GUI...
- Page 6 Table of Contents 5.2.3.1 Status Summary 5.2.3.2 Physical Details 5.2.3.3 Alarms and Errors 5.2.3.4 OH Capture 5.2.3.5 Tributary Scan 5.2.3.6 Transceiver 5.2.4 Errors/Alarms Insertion 5.3 E1 Setup and Status 5.3.1 Transmitter Setup 5.3.1.1 Physical Setup 5.3.1.2 E1 Signal Setup 5.3.2 Receiver Setup 5.3.2.1 Physical Setup 5.3.2.2 E1 Signal Setup 5.3.3 Status Information...
- Page 7 Table of Contents 5.6.2.1 Physical Setup 5.6.2.2 DS3 Signal Setup 5.6.3 Status Information 5.6.3.1 Status Summary 5.6.3.2 Physical Details 5.6.3.3 Alarms and Errors 5.6.3.4 Alignment 5.6.4 Errors/Alarms Insertion 5.7 E4 Setup and Status 5.7.1 Transmitter Setup 5.7.1.1 Physical Setup 5.7.1.2 E4 Signal Setup 5.7.2 Receiver Setup 5.7.2.1 Physical Setup 5.7.2.2 E4 Signal Setup...
- Page 8 Table of Contents 6.1.2.2 Stream 6.1.2.3 Swap 6.1.2.4 Settings 6.1.2.5 SyncE 6.1.2.6 IEEE 1588v2 6.1.2.7 OAM 6.1.2.8 Filter 6.1.3 Status Information 6.1.3.1 Status Summary 6.1.3.2 Physical Details 6.1.3.3 Interface 6.1.3.4 OH Capture 6.1.3.5 SyncE 6.1.3.6 IEEE 1588v2 6.1.3.7 OAM 6.1.3.8 Frame Capture 6.1.3.9 Transceiver 6.1.4 Errors/Alarms Insertion 6.1.4.1 Ethernet LAN...
- Page 9 Table of Contents 6.5.3.2 IEEE1588v2 Log 6.5.3.3 OAM Log 6.5.3.4 Event Log 6.5.3.5 Statistics 6.6 Pass Through 6.6.1 Ports Setup and Status 6.6.2 Test Setup 6.6.2.1 Control 6.6.2.2 Thresholds 6.6.3 Test Results 6.6.3.1 Summary 6.6.3.2 Event Log 6.6.3.3 Statistics 6.7 Ping 6.7.1 Ports Setup and Status 6.7.2 Test Setup 6.7.3 Test Results...
- Page 10 Table of Contents 6.10.3 Test Results 6.10.3.1 Summary 6.10.3.2 RFC 6349 Metrics 6.10.3.3 Window Scan 6.10.3.4 Throughput 6.10.3.5 Multi-Service 6.10.3.6 Event Log 6.10.3.7 Statistics 6.11 SAT 1564 6.11.1 Ports Setup and Status 6.11.2 Test Setup 6.11.2.1 Control 6.11.2.2 Services 6.11.2.3 Advanced 6.11.3 Test Results 6.11.3.1 Summary 6.11.3.2 Configuration Test...
- Page 11 Table of Contents 7.2.2 Test Setup 7.2.2.1 Thresholds 7.2.3 Test Results 7.2.3.1 Summary 7.2.3.2 Detailed 7.2.3.3 Event Log 7.2.3.4 Statistics 7.3 BERT 7.3.1 Ports Setup and Status 7.3.2 Test Setup 7.3.2.1 Control 7.3.2.2 Thresholds 7.3.3 Test Results 7.3.3.1 Summary 7.3.3.2 Event Log 7.3.3.3 Statistics 7.4 RTD 7.4.1 Ports Setup and Status...
- Page 12 Table of Contents 8.3.3.3 Statistics 9 Fibre Channel (FC) Applications 9.1 Fibre Channel Setup and Status 9.1.1 Physical Port Setup 9.1.2 Fibre Channel Frame Setup 9.1.2.1 Interface 9.1.2.2 Frame (only used in FC BERT) 9.1.3 Status Information 9.1.3.1 Status Summary 9.1.3.2 Physical Details 9.1.3.3 Alarms and Errors 9.1.3.4 Transceiver...
- Page 13 12.5.1 Repackaging 12.5.2 Transporting 12.5.3 Disposal 12.6 Special Information 12.6.1 Equipment Certificate 12.6.2 Anritsu Warranty 12.6.3 Anritsu Corporation Contact 12.6.4 Licensing Information 12.6.5 Availability of Source Code 12.7 Software License Document 12.8 EULA License Document 12.9 CE Conformity Marking 12.9.1 Product Model 12.9.2 Applied Directive...
- Page 14 Table of Contents 12.12.9 Philippines NTC 12.12.10 Russia CU Scheme and Minsvyaz 12.12.11 Singapore iDA 12.12.12 Thailand NTC 12.13 Declarations 12.13.1 Notes on Export Management 12.13.2 Information for EU and EFTA Customers Only 12.13.3 Information for U.S. Customers Only 12.13.4 Information for the Chinese Market Only MT1000A Network Master Pro Page 14...
-
Page 15: Introduction
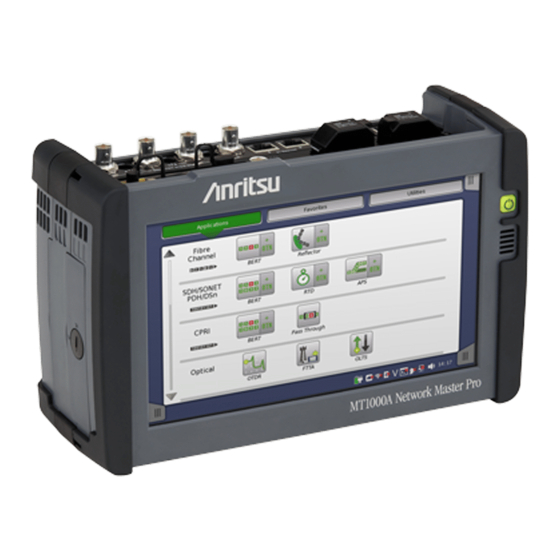
Introduction 1 Introduction This chapter provides a general introduction to the instrument, and explains the symbols and conventions used in this manual. 1.1 Mainframe MT1000A Network Master Pro Page 15... -
Page 16: Mainframe
Altogether, these features guarantee the supreme functionality of the Network Master, allowing both convenience and optimal user-friendly operation. For latest information, refer to the homepage below. http://www.anritsu.com/en-US/Products-Solutions/Products/MT1000A.aspx 1.2 10G Multirate Module (MU100010A) MT1000A Network Master Pro Page 16... -
Page 17: Multirate Module (Mu100010A)
Introduction 10G Multirate Module (MU100010A) 1.2 10G Multirate Module (MU100010A) The 10G Multirate module (MU100010A) allows the Network Master to test a large variety of interfaces and systems up to 10 Gbps, like OTN interfaces, Ethernet interfaces, SDH/SONET interfaces, Fibre Channel interfaces and PDH/DSn interfaces. -
Page 18: Symbols And Conventions
Ensure that you clearly understand the meanings of the symbols BEFORE using the equipment. Some or all of the following symbols may be used on all Anritsu equipment. In addition, there may be other labels attached to products that are not shown in the diagrams in this manual. - Page 19 Introduction Symbols and Conventions The Option symbol indicates that the information described covers an option (hardware and software) and that this option must be installed before use. Text is written in italics to separate the information from the other text elements on a page.
-
Page 20: Warnings
Calibration The performance-guarantee seal verifies the integrity of the equipment. To ensure the continued integrity of the equipment, only Anritsu service personnel, or service personnel of an Anritsu sales representative, should break this seal to repair or calibrate the equipment. Be careful not to break the seal by opening the equipment or unit covers. - Page 21 Introduction Warnings WARNING Replacing Battery When replacing the battery, use the specified battery and insert it with the correct polarity. If the wrong battery is used, or if the battery is inserted with reversed polarity, there is a risk of explosion causing severe injury or death.
-
Page 22: Cautions
Back-up Battery memory. This battery must be replaced by service personnel when it has reached the end of its useful life; contact the Anritsu sales section or your nearest representative. Note: The battery used in this equipment has a maximum useful life of 8 years. -
Page 23: Cautions Against Computer Virus Infection
1.5.1 Cautions against Computer Virus Infection Copying files and data Only files that have been provided directly from Anritsu or generated using Anritsu equipment should be copied to the instrument. All other required files should be transferred by means of USB media after undergoing a thorough virus check. -
Page 24: Precautions
Correct functioning of the instrument can only be ensured if optical modules, supplied by Anritsu for the Network Master, are used. 1.6.3 Cautions on Handling Optical Fiber Cables MT1000A Network Master Pro... - Page 25 Introduction Precautions Optical fiber cables may degrade in performance or be damaged if handled improperly. Note the following points when handling them. CAUTION Do not pull the cable when removing the connector. Doing so may break the optical fiber inside the cable, or remove the cable sheath from the optical connector.
-
Page 26: Ventilation
To avoid violating WLAN regulations, visit the Anritsu website to check where use is allowed. http://www.anritsu.com/images/JP/products- solutions/products/MT1000A/SupportWLANBluetooth3.jpg Note that Anritsu cannot be held liable for any problem arising from WLAN use in other countries and regions. MT1000A Network Master Pro Page 26... -
Page 27: Configuration
Configuration Precautions 2 Configuration This chapter contains information about the included accessories as well as guidelines for connecting the mains adapter, for charging the battery, and for attaching the carrying strap. 2.1 Delivered Accessories MT1000A Network Master Pro Page 27... -
Page 28: Delivered Accessories
Configuration Delivered Accessories 2.1 Delivered Accessories The instrument is delivered in a shipment container together with various accessories depending on the order. When unpacking the first time, it is recommended to check these accessories against the list(s) below. 2.1.1 Standard Accessories The following standard accessories are delivered with the instrument: J1565A Line Cord USA... -
Page 29: Mains Power Adapter
2.2 Mains Power Adapter The Network Master can be powered from the supplied AC mains adapter. CAUTION Always use AC mains adapter delivered from Anritsu. Anritsu Part No. G0309A. 2.2.1 Connecting Mains Power Adapter To connect the mains power adapter to the Network Master, follow the procedure below: 1. -
Page 30: Rechargeable Battery
The typical operation capacity (with a fully charged battery) will be approximately 4 hours. CAUTION Use only original batteries delivered from Anritsu, to prevent the risk of instrument damage or personal injury. Battery should only be charged at room temperature. -
Page 31: Charging Battery In Fast Mode
Configuration Rechargeable Battery 6. When installing the battery, note the direction of the battery terminals. With the instrument placed on its back - and the battery compartment in front of you - the terminals should be in the upper left corner. 7. -
Page 32: Measurement Cables
For connection of the Network Master to different types of equipment, different cables are available. Please contact your Anritsu representative for information. 2.4.1 Connecting Measurement Cables Measurement cables are connected to the input and output connectors located on the connector panel of the instrument. -
Page 33: Support Stand And Carrying Strap
Configuration Support Stand and Carrying Strap 2.5 Support Stand and Carrying Strap 2.5.1 Support Stand The Network Master is equipped with a support stand keeping the instrument at a convenient angle during the operation. To extract the stand: pull out the metal bar on rear of the instrument - it automatically stays in the correct position. - Page 34 Configuration Support Stand and Carrying Strap How to attach carrying strap and handle To attach carrying strap (Z1747A) and handle (Z1748A) to MT1000A Network Master Pro, follow instructions below. 1. Use screw driver and remove the battery lid from MT1000A. 2.
- Page 35 Configuration Support Stand and Carrying Strap 6. Detailed photos for upper and lower corner. 7. Remove the buckle cap from the handle and the carrying strap. 8. Mount the carrying strap on both upper corners. MT1000A Network Master Pro Page 35...
- Page 36 Configuration Support Stand and Carrying Strap 9. Attach MT1000A and MU100010A , insert the battery pack and mount the battery lid with the reverse sequence at the beginning. MT1000A Network Master Pro Page 36...
-
Page 37: Man-Machine-Interface
Man-Machine-Interface Support Stand and Carrying Strap 3 Man-Machine-Interface Man-Machine-Interface (MMI) covers the relation between the user and the instrument - in other words: the information you get from the instrument combined with the action you add to the instrument. The informative part is the TFT display, and the part susceptible to influence is the touch-active layer of the screen. -
Page 38: Touch Screen Display
The touch screen display is constructed to be operated by the tip of your finger or by the included Stylus (Anritsu part No. Z1746A). The touch screen surface is made of delicate material and is easily scratched or damaged if handled incorrectly. -
Page 39: Key Operation
Man-Machine-Interface Key Operation 3.2 Key Operation The only physical operator key (the Power button) is described in this section. 3.2.1 Power Button The Power button on the front panel of the instrument is used to switch power ON and OFF. In addition, the menu used for power-off also contains a few extra options (e.g. - Page 40 Man-Machine-Interface Key Operation Battery Operation After you shut the Network Master down, the power goes off. Forcing power OFF If it is not possible to power down the Network Master using the power button menu, the following procedure can be used to make an emergency power down.
-
Page 41: Head Set
3.3 Head Set You can use the optional head set available from Anritsu. With the optional head set available from Anritsu (P/N J1570A), it is possible to listen speech in the audio channels available in E1 and T1 systems. CAUTION Do not operate for a long period of time at high volume level or at a level that is uncomfortable. -
Page 42: Connector Panel
Man-Machine-Interface Connector Panel 3.4 Connector Panel All connections (both for test interfaces and for service interfaces) are placed on the connector panel of the Network Master. The figure below shows the connector panel of the mainframe and MU100010A. 3.4.1 Test Interfaces The connector panel contains the following port connectors to be used for the tests: 3.4.2 Service Interfaces... -
Page 43: Service Interfaces
Man-Machine-Interface Connector Panel 3.4.2 Service Interfaces All connections concerning the service interfaces are also located on the connector panel: The audio connector is used for connecting to an optional Audio head set. The AUX connector is used for G0325A GPS Receiver. The Ext Clock Input connector is used for reference clock Ext Clock Input input. -
Page 44: Remote Operation
3. If User Acount Control dialog box appears, click Yes. 4. After the installation finishes, click Close. Click Start > All Programs > Anritsu > MX100001A folder. Confirm that following programs appear. "V*.**" is replaced to the version name. MX100001A-V*.**-Editor MX100001A-V*.**-Remote... -
Page 45: Communication Ports
HTTP tunnel clients. Refer to section for details how to setup VNC communication ports. 135, 137, 138, 139, File Sharing, fixed ports. 3.5.4 Starting Control Software 1. Open Anritsu-MX100001A folder from Start menu. 2. Click MX100001A-V*.**-Remote. MT1000A Network Master Pro Page 45... -
Page 46: Remote Upgrade
Man-Machine-Interface Remote Operation Executing Remote Operation on control PC: 1. If Control Software launched, the initial screen for remote operation appears as below. 2. Enter the IP address of the Network Master to Remote Unit IP Address. 3. Click Validate Connection. 4. -
Page 47: Remote Wake Up
If Network Master is in Stand-by mode, it is possible to remotely get the unit into the Operation state. 1. Click Start > All Programs > Anritsu > MX100001A folder. 2. Click MX100001A-V*.**-Remote. 3. On the Control Software startup screen, enter the IP address of the Network Master in the Remote Unit IP Address field. -
Page 48: Stand-Alone Editor
MX100001A Editor allows users to load, edit, and save Setup files of any possible Network Master configuration, without connecting to an actual instrument. 1. Click Start > All Programs > Anritsu > MX100001A folder. 2. Click MX100001A-V*.**-Editor. 3. Set configuration of Network Master by clicking options in Select Controller, Select First Module, and Select Second Module. -
Page 49: Command-Based Remote Control
Man-Machine-Interface Command-Based Remote Control 3.6 Command-Based Remote Control Using command-based scripts makes the Network Master a fully automated measurement instrument. The Network Master remote control communication functions support the built-in Ethernet service interface. Software specifications are in conformity with the IEEE488.2 standard and SCPI version 1999 (Standard Commands for Programmable Instruments). -
Page 50: File Access Via Ethernet Interface
Man-Machine-Interface File Access via Ethernet Interface 3.8 File Access via Ethernet Interface 3.8.1 Accessing files in Network Master from the PC The mass storage of the Network Master can be shared with your PC via Ethernet interface. 1. Connect an Ethernet network cable to the LAN connector on your Network Master and link this to a Local Area Network. - Page 51 Man-Machine-Interface File Access via Ethernet Interface 4. Connect an Ethernet network cable to the LAN connector on your Network Master and link this to a Local Area Network. 5. Assign an IP address to the Network Master. This is done in the Ethernet available in the Network screen as described in the Graphical User...
-
Page 52: External Gps Receiver
3.9 External GPS Receiver It is possible to connect an external GPS receiver (part No. G0325A) available from Anritsu. The GPS receiver is used for: Precise time synchronization, when making one way Frame Transfer Delay measurements as part of the Ethernet Service Activation Test. -
Page 53: Remote Control Via Gpib
Man-Machine-Interface Remote Control via GPIB The pop-up dialog box shows the current GPS status, and, for purely informational purposes, the number of satellites used for position fix, and the current geolocation of the GPS receiver, in degrees and decimal minutes format. - Page 54 Man-Machine-Interface Remote Control via GPIB MT1000A Network Master Pro Page 54...
-
Page 55: Graphical User Interface
Graphical User Interface Remote Control via GPIB 4 Graphical User Interface This chapter provides a general introduction to the graphical user interface (GUI). The descriptions of the screens, sub-screens and major dialog boxes related to specific technologies and applications are placed in separate chapters. -
Page 56: General Handling Of The Gui
Graphical User Interface General Handling of the GUI 4.1 General Handling of the GUI The Network Master is equipped with a touch screen display, except for the key to switch the instrument on/off. The operating principle of the graphical user interface (GUI) presented on the touch screen display is that it guides you through all setup steps required for running a specific test and then finally presents you with the test results. - Page 57 Graphical User Interface General Handling of the GUI Horizontal navigation at desktop level You can switch between the application selector and the result file browser by touching the tab displayed in the bottom right-hand corner and the bottom left-hand corner. Horizontal navigation within a workspace In the workspace you can step through the setup by touching the navigation tabs displayed in the bottom corners of the screen.
-
Page 58: Layout Of The Gui Screens
Graphical User Interface General Handling of the GUI 4.1.3 Layout of the GUI Screens Startup Splash The Network Master starts up with a splash screen that shows the GUI Screen concept of desktop/workspace and the various screen types. It indicates both application selector and result file browser as entry points. -
Page 59: Starting The Application
Graphical User Interface General Handling of the GUI 4.1.3.1 Starting the Application Application The Application Selector screen is the main entry point after startup of Selector the Network Master. From here you can choose which application/test to run: either one of the standard applications or a previously saved pre-configured application. - Page 60 Graphical User Interface General Handling of the GUI Creating favorites 1. Go to the workspace of the application you want to save as favorite. Touch the Applications button and touch an icon to be registered. Return to the workspace by touching the button at bottom. 2.
- Page 61 Graphical User Interface General Handling of the GUI Utilities Applications to view test results or a fiber edge surface are provided in Utilities application. Touching Utilities button displays the screen below. PDF Viewer: - allows to view PDF files created by Report. VIP: - allows users to view a fiber edge surface with the Video Inspection Probe.
-
Page 62: Switching The Applications
Graphical User Interface General Handling of the GUI Browses the folder. Sets the filter of files. Loads the result and starts the application with view mode. Loads the result. Creating the report from the result. Selects multiple files or folders. Switches the GUI layout. - Page 63 Graphical User Interface General Handling of the GUI It consists of several "areas": The navigation area at the top of the screen contains a number of buttons representing a structure for the current interface, which allows you to select a specific port, transmitter/receiver and layer. The setup area (the main area of the screen) is where the parameters for setting up the interface are displayed.
-
Page 64: Lamp Indication Of Alarm/Error Status
Graphical User Interface General Handling of the GUI In addition to the various parameters, the Test Setup screen also contains Application toolbar and the navigation tabs for horizontal and vertical navigation. Test Results The Test Results screen is the last screen in the workspace. It generally screen contains several pages, reflecting the progress of the test. -
Page 65: Test Status Summary
Graphical User Interface General Handling of the GUI Note that the same colors are also used for indication of status in other contexts, e.g. in the display of test results. Double-ringed icons with history information The Lamp icons are double-ringed, with the inner ring indicating the current status and the outer ring showing history information (i.e. -
Page 66: Keypads For Entering Text In Fields
Graphical User Interface General Handling of the GUI Test Status for an application is only updated during testing. When testing is stopped it will retain its status until testing is restarted or the application is closed. Touching the summarized Test Status icon will open a dialog showing the individual Test Status for every running applications. -
Page 67: User Pattern Editor
Graphical User Interface General Handling of the GUI the "X" symbol in the upper right-hand corner of the keypad. 4.1.6 User Pattern Editor The 32-bits and 2048-bits user patterns are specified using the Pattern Editor. You can view the pattern in either Hexadecimal, Binary or ASCII format and use either a numpad, an ASCII table or a keyboard to set it up. -
Page 68: Toolbars
Graphical User Interface Toolbars 4.2 Toolbars Two toolbars are available on the right-hand side of the screen: the desktop toolbar (called the Instrument toolbar) and the expandable workspace toolbar (called the Application toolbar). Instrument toolbar contains general system functions and information (e.g. - Page 69 For the icons, refer to "File Manager". When there are "NG"s in the self test results, try to reboot Network Master. If "NG"s remain in the self test results, contact an Anritsu Service and Sales office. MT1000A Network Master Pro Page 69...
- Page 70 Graphical User Interface Toolbars Configuration The Configuration icon launches the Global Configuration screen. From this screen, it is possible to configure both the general instrument settings (such as date/time, password etc.) and various network settings. General The General screen contains the following configuration options: LCD Brightness Allows you to change the screen brightness by using the slide bar.
- Page 71 Graphical User Interface Toolbars This icon indicates that the speaker is On. This icon indicates that the speaker is Off. Auto Save Allows you to specify saving method of the measurement results. Prompt: Confirms saving results or not after a test. On: Saves results to the file automatically without notification every time a test ends.
- Page 72 Graphical User Interface Toolbars Date/Time Allows you to change the system date and time. Select a part in New Time or New Date field and touch the up/down button. Miscellaneous Logging Level allows you to specify the logging level. Select Off always. Other options are used for the service use.
- Page 73 Graphical User Interface Toolbars Ethernet Allows the instrument to be connected to the Ethernet either via dynamic addressing (DHCP) or via manual specification of IP address, subnet mask and default gateway. These settings are applied for the Ethernet service interface. This icon indicates the link status of the Ethernet service interface.
- Page 74 Graphical User Interface Toolbars 1. Touch the WLAN button. WLAN Setup dialog box appears. 2. Touch the Scan button. Scan results are displayed. 3. Select the network from scan results and touch the View button. 4. Touch the Add Network button. Specify relevant items of network, touch the Add button.
- Page 75 Graphical User Interface Toolbars via Bluetooth. Login account and password are not required for the FTP connection. Shared folder in Network Master is "/property/mnt/internal". When the option is installed, this icon indicates whether the Bluetooth is enabled or disabled. Remote Control Allows you to change remote control options.
- Page 76 Graphical User Interface Toolbars IP Address: The IP address of the networked PC Domain: The domain name of the networked PC User: The username (account) of the networked PC Password: The password for account Folder Name: The name of the shared folder on the networked PC After entering parameters, touch Apply.
- Page 77 Graphical User Interface Toolbars Appears on the remote control application screen only. Displays the local folder of the control PC. Appears on the remote control application screen only. Displays the folder of the Network Master. Sets the current folder to the home folder. Moves to the home folder.
-
Page 78: Application Toolbar
Graphical User Interface Toolbars Moves to the Help list topic. Back Forward Shows/hides the search box and buttons at bottom. Searches backward. Searches forward. When Case Sensitive is selected, searches distinguishing the upper case and the lower case. Resource monitoring The Resource monitoring icon launches a screen showing which applications are currently activated and which ports on the connector panel are assigned to each of the applications. - Page 79 Graphical User Interface Toolbars Left-most column The left-most column contains the following functions and status indicators: Start Touch the Start icon to start the currently selected application/test. The icon changes to the Stop icon shown below, which can then be used to stop the test.
- Page 80 Graphical User Interface Toolbars Port Status Shows the current pass/fail status of the test. Green means pass, red means fail. Port Status is the summary of all ports under test. If a failure occurs in any layer, Port Status turns into red. Help Touch this icon to access the online help for the currently displayed screen or dialog box.
- Page 81 Graphical User Interface Toolbars Report Touch this icon to create a report containing the current application results and settings. 1. Touch the Select Format field to select the format of the report file. The application name is shown in Select Report field. 2.
- Page 82 Graphical User Interface Toolbars The Report Generator will remember previous used setup parameters. The first page is common for all applications while setup parameters on subsequent pages are remembered on a per application basis. Alarm/Error Insert Touch this icon to activate the stimulus specified in the stimuli setup available in the expanded Application toolbar.
- Page 83 Graphical User Interface Toolbars Load Save Touch this icon to open Load/Save dialog box. You can load or save Setup file or Result file. Only files matching the current application type are selectable for loading. When loading setup files, the number of port resources enclosed in the file has to match that of the current application.
-
Page 84: Startup And Switch-Off Sequences
Graphical User Interface Startup and Switch-off Sequences 4.3 Startup and Switch-off Sequences This section describes what takes place when you switch the Network Master on and off as well as when you start up and close down an application. 4.3.1 Instrument Startup When you switch on the instrument, the first screen displayed is a splash screen - introducing you to the GUI concept of the desktop/workspace and the various screen types (see the figure in the GUI Concept section). -
Page 85: Closing An Application
Graphical User Interface Startup and Switch-off Sequences Creating a workspace for a previous test allows you to view the test results in the GUI and also to rerun the test if required (either with the same setup or with changed parameter settings). You are brought directly to the Test Results screen when you touch the View/Load File button, but can navigate to the other screens in the workspace from there. - Page 86 Graphical User Interface Startup and Switch-off Sequences MT1000A Network Master Pro Page 86...
-
Page 87: Sdh/Sonet/Pdh/Dsn Applications
SDH/SONET/PDH/DSn Applications Startup and Switch-off Sequences 5 SDH/SONET/PDH/DSn Applications This chapter describes the graphical user interface (i.e. screens, sub- screens and major dialogs) related to SDH/SONET/PDH/DSn applications. Sub-screens and dialogs are described under the main screen from which they are activated/launched. The following settings and applications are available: SDH Setup and Status SONET Setup and Status... -
Page 88: Sdh Setup And Status
SDH/SONET/PDH/DSn Applications SDH Setup and Status 5.1 SDH Setup and Status An STM-xx button in the navigation area of the Ports Setup screen gives you access to the SDH setup for the transmitter and/or receiver of the currently selected port. Refer to SDH/SONET switching for switching to SDH. -
Page 89: Sdh Frame Setup
SDH/SONET/PDH/DSn Applications SDH Setup and Status Only enabled when the OH overwrite has been selected to the behavior of the transmitter. Use the drop-down menu to select the relevant overwrite position. The available values are: A1/A2 byte K1/K2 byte S1 byte DCC1-3 byte DCC4-12 byte J0 byte... - Page 90 SDH/SONET/PDH/DSn Applications SDH Setup and Status The general principle in setting up the SDH frame is to select the relevant values for the various containers in the multiplexing structure. This is done either via a drop-down menu or via a launched dialog box, by touching a drop-down menu or a button in the frame structure diagram.
- Page 91 SDH/SONET/PDH/DSn Applications SDH Setup and Status The setup principle is the same in this editor dialog as in the SDH structure. Touching a button or opening a drop-down menu will open for new editor dialog boxes, new value selections etc. S1: Synchronization status J0: Regenerator section trace Idle Char is an Ascii code used for the padding.
- Page 92 SDH/SONET/PDH/DSn Applications SDH Setup and Status J1: Path Trace Idle Char is an Ascii code used for the padding. B3: Path BIP-8 This byte cannot be set. C2: Signal label G1: (bit 1 to 4) REI (bit 5) RDI (bit 6 and 7) Reserved (bit 8) Spare F2,F3: Path user channels H4: Multiframe indicator K3: (bit 1 to 4) Automatic protection switching (APS) channels (bit 5 and...
-
Page 93: Receiver Setup
SDH/SONET/PDH/DSn Applications SDH Setup and Status For example, bit length of PRBS9 is 2 -1=511. Pattern logic is enabled. All 0's, All 1's: All bits are 0, all bits are 1. Alternating 1:1, Alternating 1:3, Alternating 1:7: Bit pattern such as "010101...", "100010001000...", "1000000010000000...". -
Page 94: Status Information
SDH/SONET/PDH/DSn Applications SDH Setup and Status Touching the navigation area button which represents the receiver's SDH layer will launch the following screen. The manner of setting up the SDH interface of receiver is the same as that of transmitter. Refer to SDH Frame Setup in "Transmitter Setup". -
Page 95: Physical Details
SDH/SONET/PDH/DSn Applications SDH Setup and Status A summary consisting of the most relevant alarm/error indications is displayed constantly. By touching the summary, you can launch a display that contains all alarms/errors. Capture/Monitor At the bottom of the status area are below buttons that give you access to Status various capture/monitor information. -
Page 96: Alarms And Errors
SDH/SONET/PDH/DSn Applications SDH Setup and Status Tx signal level When optical is selected, this field shows the output power of the optical transmitter. When electrical is selected, 'N/A' is displayed. 5.1.3.3 Alarms and Errors Touching the middle summary box in the status area of the Ports Setup screen allows you to launch the display shown below. -
Page 97: Oh Capture
SDH/SONET/PDH/DSn Applications SDH Setup and Status B3: The byte of BIP-8 (Bit Interleaved Parity 8) HP-REI : High order Path Remote Error Indication V5/B3: BIP-2 of VC-12/VC-11 or BIP-8 of Low order VC3 LP-REI: Low order Path Remote Error Indication Pattern errors: Bit error detected in the payload AU-NDF: Administrative Unit New Data Flag TU-NDF: Tributary Unit New Data Flag... -
Page 98: Tributary Scan
SDH/SONET/PDH/DSn Applications SDH Setup and Status 5.1.3.5 Tributary scan Touching the Tributary scan button in the status area of the Ports Setup screen displays the status shown below. This screen allows to measure the alarms and errors of all VC-containers in the High order or the Low order at the same time. -
Page 99: Transceiver
SDH/SONET/PDH/DSn Applications SDH Setup and Status 5.1.3.6 Transceiver Touching the Transceiver button in the status area of the Ports Setup screen launches the dialog shown below. This dialog box presents status information about the optical transceiver. Module Present Green indicates that an optical transceiver is currently mounted. Transceiver Select the information from pull down menu. -
Page 100: Sdh Alarms/Errors
SDH/SONET/PDH/DSn Applications SDH Setup and Status Alarms/Errors/ Select the port to insert errors, and the stimuli type. The settings items vary Others depending on the selected stimulus type. SDH Alarm/Errors: Inserts errors or alarms related the SDH overhead or the pattern error. SDH frequency: Adds the frequency offset to the SDH bit rate. -
Page 101: Sdh Frequency
SDH/SONET/PDH/DSn Applications SDH Setup and Status 5.1.4.2 SDH frequency Touch the field to set Frequency Offset. If setting a positive value, the frequency will shift higher side. Example: If setting -50 ppm to the frequency offset for STM-16 output signal, the bit rate of output signal will be 2 488 320 * (1-50*10 ) = 2 488 195.584 (kbit/s). -
Page 102: Sonet Setup And Status
SDH/SONET/PDH/DSn Applications SONET Setup and Status 5.2 SONET Setup and Status An OC-xx/STS-xx button in the navigation area of the Ports Setup screen gives you access to the SONET setup for the transmitter and/or receiver of the currently selected port. Refer to SDH/SONET switching for switching to SONET. -
Page 103: Sonet Frame Setup
SDH/SONET/PDH/DSn Applications SONET Setup and Status Only enabled when the OH overwrite has been selected to the behavior of the transmitter. Use the drop-down menu to select the relevant overwrite position. The available values are: A1/A2 byte K1/K2 byte S1 byte DCC1-3 byte DCC4-12 byte J0 byte... - Page 104 SDH/SONET/PDH/DSn Applications SONET Setup and Status The general principle in setting up the SONET frame is to select the relevant values for the various containers in the multiplexing structure. This is done either via a drop-down menu or via a launched dialog box, by touching a drop-down menu or a button in the frame structure diagram.
- Page 105 SDH/SONET/PDH/DSn Applications SONET Setup and Status The setup principle is the same in this editor dialog box as in the SONET structure. Touching a button or opening a drop-down menu will open for new editor dialog boxes, new value selections etc. S1: Synchronization status J0: Regenerator section trace Idle Char is an Ascii code used for the padding.
- Page 106 SDH/SONET/PDH/DSn Applications SONET Setup and Status J1: Path Trace Idle Char is an Ascii code used for the padding. B3: Path BIP-8 This byte cannot be set. C2: Signal label G1: (bit 1 to 4) REI (bit 5) RDI (bit 6 and 7) Reserved (bit 8) Spare F2,Z3: Path user channels H4: Multiframe indicator Z4: (bit 1 to 4) Automatic protection switching (APS) channels (bit 5 and...
-
Page 107: Receiver Setup
SDH/SONET/PDH/DSn Applications SONET Setup and Status For example, bit length of PRBS9 is 2 -1=511. Pattern logic is enabled. All 0's, All 1's: All bits are 0, all bits are 1. Alternating 1:1, Alternating 1:3, Alternating 1:7: Bit pattern such as "010101...", "100010001000...", "1000000010000000...". -
Page 108: Status Information
SDH/SONET/PDH/DSn Applications SONET Setup and Status Touching the navigation area button which represents the receiver's SONET layer will launch the following screen. The manner of setting up the SONET interface of receiver is the same as that of transmitter. Refer to SONET Frame Setup. -
Page 109: Physical Details
SDH/SONET/PDH/DSn Applications SONET Setup and Status A summary consisting of the most relevant alarm/error indications is displayed constantly. By touching the summary, you can launch a display that contains all alarms/errors. Capture/Monitor At the bottom of the status area are below buttons that give you access to Status various capture/monitor information. -
Page 110: Oh Capture
SDH/SONET/PDH/DSn Applications SONET Setup and Status TC-TIM: Tandem Connection Trace Identifier Mismatch TC-AIS: Tandem Connection Alarm Indication Signal TC-RDI: Tandem Connection Remote Defect Indication TC-ODI: Tandem Connection Outgoing Defect Indication Errors A1A2: Bytes used for the frame synchronization B1: The byte of BIP-8 (Bit Interleaved Parity-8) B2: The bytes of 24 parity bits REI-L: Line Remote Error Indication B3: The byte of BIP-8 (Bit Interleaved Parity-8) -
Page 111: E1 Setup And Status
SDH/SONET/PDH/DSn Applications E1 Setup and Status 5.3 E1 Setup and Status E1 represents the 2.048 Mbit/s PDH layer. The Ports Setup screen gives you access to the PDH layer setup for the transmitter and/or receiver of the currently selected port. Plesiochronous Digital Hierarchy (PDH) refers to the technology originally used in telecommunications networks to transport data over digital transport equipment such as fiber optic systems. -
Page 112: E1 Signal Setup
SDH/SONET/PDH/DSn Applications E1 Setup and Status 2. Touch STM-xx, STS-xx, or OC-xx button in the navigation area. 3. Use drop down menu at right bottom to switch SDH or SONET. Selecting the SDH displays PDH Tx on Tx screen. Selecting the SONET displays DSn Tx on Tx screen. - Page 113 SDH/SONET/PDH/DSn Applications E1 Setup and Status Line code Use the Line code radio buttons to select transmission line code. HDB3: High-Density Bipolar Order 3 AMI: Alternate Mark Inversion PCM frame Use the PCM frame radio buttons to enable (On) or disable (Off) insertion of PCM frame in the transmitted signal.
- Page 114 SDH/SONET/PDH/DSn Applications E1 Setup and Status If you are uncertain whether the CRC4 should be selected or not, it is recommended to enable the CRC4. If Drop and Insert of the total contents of a receiver is selected and the signal contains CRC4, it is possible to either Bypass or Insert Sa-Bits.
- Page 115 SDH/SONET/PDH/DSn Applications E1 Setup and Status Fox (CMA3000) The 'fox pattern' using for the combined test with CMA3000 (the previous model of Network Master) All 0's, All 1's: All bits are 0, all bits are 1. Alternating 1:1: Bit pattern such as "010101..." Alternating 1:3: Bit pattern such as "100010001000..."...
-
Page 116: Receiver Setup
SDH/SONET/PDH/DSn Applications E1 Setup and Status Tone Touch the Tone Frequency button and use the launched dialog box to key in the frequency, using the numeric softkeys. Touch the Level button and use the launched dialog box to key in the level. CAS tab page The CAS tab page contains the following parameters: Use the CAS radio buttons to enable (On) or disable (Off) the insertion of a... - Page 117 SDH/SONET/PDH/DSn Applications E1 Setup and Status Switching between PDH Rx and DSn Rx is done in the SDH/SONET receiver setup screen. 1. Select SDH Rx or SONET Rx check box. 2. Touch STM-xx, STS-xx, or OC-xx button in the navigation area. 3.
-
Page 118: E1 Signal Setup
SDH/SONET/PDH/DSn Applications E1 Setup and Status using the input mode Monitor, is recommended instead. Monitor Used when connecting to protected monitoring points. The input impedance is nominal. Input sensitivity Set the sensitivity of the input. The available options are: Full sensitivity Signal levels down to the maximum sensitivity on the instrument are accepted. - Page 119 SDH/SONET/PDH/DSn Applications E1 Setup and Status Use the CRC4 and E-bits radio buttons to enable (On) or disable (Off) the corresponding bit in the received signal. Use buttons in left frame for setting CRC4. Use buttons in right frame for setting E-Bit. If it is uncertain whether the CRC4 and E-bits are supported in the monitor signal, it is recommended to select the Off mode.
-
Page 120: Status Information
SDH/SONET/PDH/DSn Applications E1 Setup and Status Use the Audio drop-down menu and select the features for the receiver decoding. Select On to enable the audio decoding or Off to disable. Audio Time Slot Touch the Audio Time Slot graphics and use the launched dialog box to select the timeslot. -
Page 121: Physical Details
SDH/SONET/PDH/DSn Applications E1 Setup and Status A summary consisting of the most relevant alarm/error indications is displayed constantly. By touching the summary, you can launch a display that contains all alarms/errors. Monitor Buttons At the bottom of the status area are below buttons that give you access to various monitor information. -
Page 122: Alignment
SDH/SONET/PDH/DSn Applications E1 Setup and Status Touching the middle summary box in the status area of the Ports Setup screen displays the status shown below. This screen contains detailed alarm and error information related to the E1 interface. Status is indicated by the use of colored Lamp icons. -
Page 123: Cas
SDH/SONET/PDH/DSn Applications E1 Setup and Status This screen provides information on the frame alignment when available. The frame alignment information includes the 16 first FAS/NFAS words of the CRC4 multiframe. If multiframe is not available, the frame information will show 16 FAS/NFAS words in sequence. -
Page 124: Audio
SDH/SONET/PDH/DSn Applications E1 Setup and Status This field shows the MFAS bits. CAS Bits, Port1 and Port2 This table shows the status of the CAS Bits in the two ports. Use of colors For easy recognition of special bit combinations, coloring is available. Use the Set red pattern and Set yellow pattern buttons to launch the respective setup dialog boxes. -
Page 125: Traffic
SDH/SONET/PDH/DSn Applications E1 Setup and Status Tone frequency The frequency of the audio signal is shown here. Coder offset The coder offset is presented if the time slot displayed is a normal 64 kbit/s time slot. Audio level Two dBm meters show the volume of the currently selected audio channel (Port1 - Port2). -
Page 126: Errors/Alarms Insertion
SDH/SONET/PDH/DSn Applications E1 Setup and Status Audio Time Slots for all ports are marked, but it is only possible to change the time slots of the current port. Touching this button will convert the table to display time slot content. Touching this button will convert the graphic to display traffic. -
Page 127: Pdh Frequency
SDH/SONET/PDH/DSn Applications E1 Setup and Status shows only status. ES: Inserts one or more errors in one second (Errored Second). Insert icon shows only status. SES: Inserts 30% or less errors in one second (Severely Errored Second). The Error Insert icon shows only status. 2. -
Page 128: Ds1/J1 Setup And Status
SDH/SONET/PDH/DSn Applications DS1/J1 Setup and Status 5.4 DS1/J1 Setup and Status DS1/J1 represents the 1.544 Mbit/s PDH layer. The Ports Setup screen gives you access to the PDH layer setup for the transmitter and/or receiver of the currently selected port. DS1/J1 allows transmission of data streams that are nominally running at the same rate, however allowing for some variation in the speed around a nominal rate (+/-125 ppm variation around 1.544 Mbit/s). -
Page 129: Ds1/J1 Signal Setup
SDH/SONET/PDH/DSn Applications DS1/J1 Setup and Status This screen allows you to make the physical setup of the PDH transmitter in DS1/J1 mode. It can also be used to inspect the current status of the selected port. The configuration options available in the setup area of the screen are described below. - Page 130 SDH/SONET/PDH/DSn Applications DS1/J1 Setup and Status Line code Use the Line code radio buttons to select transmission line code. AMI: Alternate Mark Inversion B8ZS: Bipolar Eight Zero Substitution PCM frame Use the PCM frame radio buttons to enable (On) or disable (Off) insertion of PCM frame in the transmitted signal.
- Page 131 SDH/SONET/PDH/DSn Applications DS1/J1 Setup and Status User [32] bit, User [2048] bit PRBS 9 to PRBS 31 QRSS 20 Fox Pattern, Fox (CMA3000) All 0's, All 1's Alternating 1:1, Alternating 1:3, Alternating 1:7, Alternating 3:24 Touch 'Normal' or 'Inverse' pattern type. Touching the 'ITU standard' button will apply ITU-T O.150 recommended Pattern type for N x 64 kbps data rates (PRBS 11).
- Page 132 SDH/SONET/PDH/DSn Applications DS1/J1 Setup and Status Tone Touch the Frequency field and use the launched dialog box to key in the frequency, using the numeric softkeys. Touch the Level field and use the launched dialog box to key in the level. CAS tab page The CAS tab page contains the following parameters: Use the CAS radio buttons to enable (On) or disable (Off) the insertion of a...
-
Page 133: Receiver Setup
SDH/SONET/PDH/DSn Applications DS1/J1 Setup and Status 5.4.2 Receiver Setup 5.4.2.1 Physical Setup When the receiver is set up with only a DS1/J1 interface, touching the Rx button in the navigation area will launch the following screen. For the switching method between PDH Rx and DSn Rx, refer to Physical Setup in "E1 Setup and Status". - Page 134 SDH/SONET/PDH/DSn Applications DS1/J1 Setup and Status Line code Use the Line code radio buttons to select transmission line code AMI or B8ZS. For normal 1.544 Mbps systems choose B8ZS. AMI is for special applications only. PCM frame Use the PCM frame radio buttons to enable (On) or disable (Off) the status of the PCM frame.
-
Page 135: Status Information
SDH/SONET/PDH/DSn Applications DS1/J1 Setup and Status Touching the 'ITU standard' button will apply ITU-T O.150 recommended Pattern type for N x 64 kbps data rates (PRBS 11). User pattern User pattern field is enabled if Pattern type is set to User [32] bit or User [2084] bit. -
Page 136: Physical Details
SDH/SONET/PDH/DSn Applications DS1/J1 Setup and Status Physical Status The topmost part of the status area gives you access to information about the current physical status of the selected interface. A summary consisting of the most relevant status indicators is displayed constantly. By touching the summary, you can launch a display that contains the detailed status information. -
Page 137: Alignment
SDH/SONET/PDH/DSn Applications DS1/J1 Setup and Status Pattern: Pattern CRC-6: Cyclic Redundancy Check 6 S-Bit: S-Bit Error BPV: Bipolar Violation Pattern Slip: Pattern slips EXZ : Excessive zeros 5.4.3.4 Alignment Touching the Alignment button in the status area of the Ports Setup screen displays the status shown below. -
Page 138: Audio
SDH/SONET/PDH/DSn Applications DS1/J1 Setup and Status This screen gives information on the CAS (Channel Associated Signaling) signaling when available. It displays the state of the two signaling bits in both directions for all 24 channels. Activity is indicated with bold characters. Use of colors For easy recognition of special bit combinations, coloring is available. -
Page 139: E3 Setup And Status
SDH/SONET/PDH/DSn Applications E3 Setup and Status 5.5 E3 Setup and Status E3 represents the 34.368 Mbit/s PDH layer. The Ports Setup screen gives you access to the PDH layer setup for the transmitter and/or receiver of the currently selected port. E3 allows transmission of data streams that are nominally running at the same rate, however allowing for some variation in the speed around a nominal rate (+/-125 ppm variation around 34.368 Mbit/s). -
Page 140: E3 Signal Setup
SDH/SONET/PDH/DSn Applications E3 Setup and Status This screen allows you to make the physical setup of the PDH transmitter in E3 mode. It can also be used to inspect the current status of the selected port. The configuration options available in the setup area of the screen are described below. -
Page 141: Receiver Setup
SDH/SONET/PDH/DSn Applications E3 Setup and Status Touching the 'ITU standard' button will apply ITU-T O.150 recommended Pattern type for 34 Mbit data rates (PRBS 23 Inverse). User pattern User pattern field is enabled if Pattern type is set to User [32] bit or User [2084] bit. -
Page 142: Status Information
SDH/SONET/PDH/DSn Applications E3 Setup and Status Follows To make the currently selected receiver follow either the transmitter or Port 1 receiver (i.e. copy its settings), touch the drop-down menu in the navigation area and select the relevant value. The receiver settings continue to follow the change of either the transmitter or Port 1 receiver. -
Page 143: Physical Details
SDH/SONET/PDH/DSn Applications E3 Setup and Status Alarm/Error The middle part of the status area gives you access to alarm and error Status information for the selected interface. The current status is indicated by the lamp color. A summary consisting of the most relevant alarm/error indications is displayed constantly. -
Page 144: Ds3 Setup And Status
SDH/SONET/PDH/DSn Applications DS3 Setup and Status 5.6 DS3 Setup and Status DS3 represents the 44.736 Mbit/s PDH layer. The Ports Setup screen gives you access to the PDH layer setup for the transmitter and/or receiver of the currently selected port. DS3 allows transmission of data streams that are nominally running at the same rate, however allowing for some variation in the speed around a nominal rate (+/-125 ppm variation around 44.736 Mbit/s). -
Page 145: Ds3 Signal Setup
SDH/SONET/PDH/DSn Applications DS3 Setup and Status This screen allows you to make the physical setup of the PDH transmitter in DS3 mode. It can also be used to inspect the current status of the selected port. The configuration options available in the setup area of the screen are described below. - Page 146 SDH/SONET/PDH/DSn Applications DS3 Setup and Status M13 Frame Overhead C11 F0 C12 F0 C13 F1 C21 F0 C22 F0 C23 F1 C31 F0 C32 F0 C33 F1 C41 F0 C42 F0 C43 F1 M0 F1 C51 F0 C52 F0 C53 F1 M1 F1 C61 F0 C62 F0...
-
Page 147: Receiver Setup
SDH/SONET/PDH/DSn Applications DS3 Setup and Status Cord Option Meaning Word FEAC Off DS3 EF DS3 Equipment Failure Service Affecting 011001 DS3 LOF DS3 Loss of Signal 001110 DS3 OOF DS3 Out of Frame 000000 DS3 AIS DS3 AIS Received 010110 DS3 Idle DS3 Idle Signal Received 011010... -
Page 148: Ds3 Signal Setup
SDH/SONET/PDH/DSn Applications DS3 Setup and Status The configuration options available in the setup area of the screen are described below. The status information is described in a separate section. Input mode Select the mode of input. Terminate Used when the instrument is used as a tester and the receiver is the only device connected to the line. -
Page 149: Status Information
SDH/SONET/PDH/DSn Applications DS3 Setup and Status The length can be any length from 1 bit to 32 bits or from 1 bit to 2048 bits. 5.6.3 Status Information This section describes the status information available for the DS3 layer in the status area of the Ports Setup screen. -
Page 150: Alignment
SDH/SONET/PDH/DSn Applications DS3 Setup and Status Alarms LOS: Loss of Signal AIS: Alarm Indication Signal LOF: Loss of Frame RAI: Remote Alarm Indication IDLE: Idle Signal LSS: Link Status Signal Errors BPV Error: Bipolar Violation error Pattern error: Pattern error Pattern slips:Pattern slips Parity error: Parity error F-bit error: F-bit error... -
Page 151: Errors/Alarms Insertion
SDH/SONET/PDH/DSn Applications DS3 Setup and Status This screen provides information on the frame alignment when available. The frame alignment information includes the below bits contained in seven subframes. F-Bits: Framing bits Stuffing Bits: Bit stuffing control bits X-Bits: Message bits P-Bits: Parity bits M-Bits: Multiframing bits AIC: Application Identification Channel... -
Page 152: E4 Setup And Status
SDH/SONET/PDH/DSn Applications E4 Setup and Status 5.7 E4 Setup and Status E4 represents the 139.264 Mbit/s PDH layer. The Ports Setup screen gives you access to the PDH layer setup for the transmitter and/or receiver of the currently selected port. E4 allows transmission of data streams that are nominally running at the same rate, however allowing for some variation in the speed around a nominal rate (+/-125 ppm variation around 139.264 Mbit/s). -
Page 153: E4 Signal Setup
SDH/SONET/PDH/DSn Applications E4 Setup and Status This screen allows you to make the physical setup of the PDH transmitter in E4 mode. It can also be used to inspect the current status of the selected port. The configuration options available in the setup area of the screen are described below. -
Page 154: E4 Signal Setup
SDH/SONET/PDH/DSn Applications E4 Setup and Status For the switching method between PDH Rx and DSn Rx, refer to Physical Setup in "E1 Setup and Status". Touch E4 radio button. Touching Off radio button disables the receiver. This screen allows you to make the physical setup of the PDH receiver in E4 mode. -
Page 155: Status Information
SDH/SONET/PDH/DSn Applications E4 Setup and Status User pattern field is enabled if Pattern type is set to User [32] bit or User [2084] bit. Touch the User pattern field and use the launched Pattern Editor dialog box to define the user pattern. Depending on the selected pattern type, different user pattern setup options will be available. -
Page 156: Errors/Alarms Insertion
SDH/SONET/PDH/DSn Applications E4 Setup and Status LOS: Loss of Signal AIS: Alarm Indication Signal No frame: No frame Distant: Distant No Sync: No synchronization Errors FAS words: Frame Alignment Signal words Pattern error: Pattern error Pattern slips: Pattern slips 5.7.4 Errors/Alarms Insertion Refer to Errors/Alarms Insertion in E1 Setup and Status section. -
Page 157: Aps
SDH/SONET/PDH/DSn Applications 5.8 APS The Automatic Protection Switching (APS) test described in this section is applicable for SDH/SONET/PDH/DSn interfaces. For APS test of OTN interface, refer to in "OTN Application". On SDH/SONET K1,K2 protocol decoding is performed, as well as measurement of average and maximum duration of a specified reference event (alarm/error). -
Page 158: Test Results
SDH/SONET/PDH/DSn Applications Measurement Reference event Condition Use the drop-down menu(s) to select the relevant event (LOS, LOF, OOF etc.). LOS does not appear when using the electrical interface (STM-1eor STS-3). For the PDH interfaces the lists of relevant events are different. Error free period Appears when SDH or SONET layer is present. -
Page 159: Protocol Interpretation
SDH/SONET/PDH/DSn Applications This screen shows the duration of all reference events, both in a list and in a graphic representation. This screen contains the summary field displayed below the list. Summary field Consists of the minimum, maximum, and average automatic switching times in milliseconds, the specified Max. -
Page 160: Event Log
SDH/SONET/PDH/DSn Applications This screen shows a protocol interpretation for the selected port (i.e. detailed decoding information about K1 and K2 during the test). It also contains a set of parameters that allow you configure the requests used in the test. Configuration Select the configuration from below. -
Page 161: Bert
SDH/SONET/PDH/DSn Applications BERT 5.9 BERT The Bit Error Rate Test (BERT) described in this section is applicable for SDH/SONET/PDH/DSn interfaces. For BERT of OTN interface, refer to BERT in "OTN Application". The interface settings on the Ports Setup screen determines whether the current application is SDH, SONET, PDH and/or DSn BERT. - Page 162 SDH/SONET/PDH/DSn Applications BERT Allows you to specify when the measurement is started. Immediate: Starts the measurement when you touch the Start button. Start at: Starts the measurement at the time specified in the Start at field on the right. Stop function Allows you to specify when the measurement ends.
-
Page 163: Thresholds
SDH/SONET/PDH/DSn Applications BERT Touching the Setup button launches the dialog box. Refer to Performance Parameters in "OTN Application" . SDH/SONET-related SDH/SONET G.826, G.828+G.829, M.2101.1(M.2100) Time period 15 minutes, 1 hour, 2 hours, 24 hours, 7 days Allocation [%] 0.00 to 100.00% PDH/DSn-related G.821, G.826, M.2100, G.821 (expired) G.826, M.2100... -
Page 164: Test Results
SDH/SONET/PDH/DSn Applications BERT Choose whether the threshold is specified as an absolute value or a percentage, using the Count, Ratio and Ratio [%] radio buttons, and then specify the value in the Threshold field. Transport Select the check box to enable the transport-related parameters. Interface Select the item to evaluate from OTN, SDH, SONET, E4, E3, E1, DS3 or DS1/J1. -
Page 165: Pointer Movement
SDH/SONET/PDH/DSn Applications BERT Manual 1E-04 to 1E-10 Alternate Burst length If 'Insertion' is set to Manual, touch the button and set the burst length to insert. Normal length If 'Insertion' is set to Alternate, touch the button and set the normal length. Error length If 'Insertion' is set to Alternate, touch the button and set the error length. -
Page 166: Event Log
SDH/SONET/PDH/DSn Applications BERT View all: Shows a graph area with a width as the duration of the test. Custom: This is automatically selected when the graph area is touch- manipulated. Max pointer value Used to set the y-scaling of the view. The maximum amplitude of the plot always originates from the zero line. -
Page 167: Statistics
SDH/SONET/PDH/DSn Applications BERT The test start event (Started) and stop event (Stopped) are always shown in the event log. The View setting applies a port filter. A single port or all ports can be selected. Events with no port association will always pass. The CSV export button is for writing all events (un-filtered) to a file in a CSV format (Comma Separated Values). - Page 168 SDH/SONET/PDH/DSn Applications BERT This screen presents a detailed analysis of the test results. You can choose to view either the total results from measurement start or the results of a specific interval during the test. You can also zoom in on a specific result item.
- Page 169 SDH/SONET/PDH/DSn Applications BERT Alarms/Errors Quality Performance SONET Alarms/Errors Quality Performance Alarms/Errors Performance Alarms/Errors Performance Alarms/Errors Performance DS1/J1 Alarms/Errors Performance Alarms/Errors Performance OTN options appear if the SDH/SONET signal is carried by OTN. Studying a Touch a specific cell in a result table to zoom in on the corresponding result specific result item.
- Page 170 SDH/SONET/PDH/DSn Applications BERT OTN Alarms/Errors Refer to Results in "OTN Application" OTN Performance Refer to Results in "OTN Application" SDH Alarms/Errors Alarms Errors SDH Quality Frequency AU VC-4/3 TU VC-3 TU VC-12/11 Bulk AU Pointer TU Pointer Justification * SDH Performance AU VC-4/3 TU VC-3 TU VC-12/11...
- Page 171 SDH/SONET/PDH/DSn Applications BERT DS1/J1 Alarms/Errors Alarms Errors DS1/J1 Performance FAS errors Pattern errors CRC-6 errors * DS3 Alarms/Errors Alarms Errors DS3 Performance FAS errors Pattern errors *1: Justification appears when 'PDH Rx' or 'DSn Rx' is selected. *2: E-Bit errors appears when 'E-bit' is set to On in Frame tab of E1 receiver.
-
Page 172: Rtd
SDH/SONET/PDH/DSn Applications 5.10 RTD The Round-Trip Delay (RTD) test measures the time that the data which is transmitted by the transmitter returns to the receiver. The RTD test described in this section is applicable for SDH/SONET/PDH/DSn interfaces. For RTD test of OTN interface, refer to in "OTN Application". -
Page 173: Threshold
SDH/SONET/PDH/DSn Applications Measurement period Select the measurement period from 0.5 seconds to 10 seconds. 5.10.2.2 Threshold Touching the Threshold button in the navigation area displays the following items. Threshold Maximum limit Allows you to specify a threshold value of RTD in micro seconds (μs). 5.10.3 Test Results 5.10.3.1 Summary Touching the Summary button in the navigation area will display the screen... -
Page 174: Event Log
SDH/SONET/PDH/DSn Applications Buttons for selecting the relevant port are displayed at the top of the screen, with a color indication of the pass/fail status of the test. This screen presents the detailed results of an RTD test. The result is shown in both list-form and in a graphical presentation. -
Page 175: Ethernet Applications
Ethernet Applications 6 Ethernet Applications This chapter describes the graphical user interface (i.e. screens, sub- screens and major dialogs) related to Ethernet applications. Sub-screens and dialogs are described under the main screen from which they are activated/launched. The following setting and applications are available: Ethernet Setup and Status BERT Cable... -
Page 176: Ethernet Setup And Status
Ethernet Applications Ethernet Setup and Status 6.1 Ethernet Setup and Status Ethernet is globally used for data communication. Ethernet transmits variable length frames up to 1500 bytes in length, each containing a header with the source and destination addresses and a trailer that contains error correction data. -
Page 177: Port Setup (Detailed Mode)
Ethernet Applications Ethernet Setup and Status The quick setup menu contains a number of predefined port configurations (e.g. Electrical | Forced 100 Mbps FDX). The detailed mode dialog allows you to specify the configuration yourself. The detailed mode (Port Setup) dialog box is described in a separate section below. - Page 178 Ethernet Applications Ethernet Setup and Status Port Mode = Off Selecting the Off port mode will shut down the Ethernet port and stop the physical link. Electrical + Selecting the Autonegotiate port mode with interface type specified as Autonegotiate Electrical will display the following parameters: Auto Negotiation Advertisement Allows you to set the speed and duplex capabilities that are advertised to the link partner.
-
Page 179: Ethernet Frame Setup
Ethernet Applications Ethernet Setup and Status Select the Enable check box to enable insertion of the WAN interface sublayer (WIS). WAN interface sublayer is available for BERT application only. 6.1.2 Ethernet Frame Setup 6.1.2.1 WAN Touching the WAN button in the navigation area will display the screen shown below. - Page 180 Ethernet Applications Ethernet Setup and Status This screen contains the setup of the Ethernet frame content transmitted by the Network Master. The exact layout depends on the current selection of layers (i.e. the various encapsulation and protocol headers composing the Ethernet frame).
- Page 181 Ethernet Applications Ethernet Setup and Status The quick selection menu contains a number of predefined frame configurations (e.g. ETH/VLAN/IPv4). The detailed mode dialog box allows you to specify the frame configuration yourself and also provides you with access to all configuration parameters available for the individual layers. The detailed mode (Stream Setup) dialog box is described in detail below.
- Page 182 Ethernet Applications Ethernet Setup and Status Change range is: LSB 8 bits for MAC address and IPv4 address LSB 16 bits for IPv6 address Example is shown below: When copied MAC When copied IPv6 address by setting with address by setting with Increment Decrement 00-00-00-00-00-04...
- Page 183 Ethernet Applications Ethernet Setup and Status OSI layer name Protocol Transport TCP, UDP Network IPv4 , IPv6 , ICMP , ARP IEEE 802.2 LLC Type 1/ LLC1 + SNAP Data Link VLAN , PBB, MPLS-TP, MPLS, Ethernet Electrical / SFP / SFP+, Physical 10 Mbps / 100 Mbps / 1000 Mbps / 10 Gbps, FDX / HDX...
- Page 184 Ethernet Applications Ethernet Setup and Status Custom appears for BERT application only. Length Touch the field to set header length in bytes. The bit pattern with the specified length appears in the Custom pattern field. Touching the Custom pattern field launches the Pattern Editor similar to that of dialog box.
- Page 185 Ethernet Applications Ethernet Setup and Status Custom button appears for BERT application only. Frame Content Touch the Payload patten field to set the pattern for the bit error rate test. Each frame consists of only preamble and payload pattern. One byte for the sequence check will be appended by selecting Enable sequence checking on Stream screen of Test Setup.
- Page 186 Ethernet Applications Ethernet Setup and Status Src MAC The Source MAC address can be specified manually, but the instrument comes with a default unique MAC address for each port. If the Default check box is selected, the default unique MAC address is used.
- Page 187 Ethernet Applications Ethernet Setup and Status MPLS-TP control word enable When selecting the check box, a control word will be inserted in the frame. When MPLS-TP is active the ARP button will be moved away from the primary Ethernet field. Auto increment Selecting the Auto increment check box makes the sequence number in the RFC4448 control word increment automatically instead of being fixed to...
- Page 188 Ethernet Applications Ethernet Setup and Status Allows you to set a VLAN Identifier (VID), a Drop Eligible Indicator (DEI), a Priority Code Point (PCP) and a User Customer Address (UCA). Displays a Tag Protocol Identifier (TPID). Dst MAC The MAC-in-MAC destination address can either be specified manually, or be decided based on an ARP lookup.
- Page 189 Ethernet Applications Ethernet Setup and Status When the VLAN level count is 2, the two VLAN levels will be designated S-VLAN and C-VLAN. S-VLAN is short for Service provider VLAN and C-VLAN is short for Customer VLAN. Ethertype When the Level count is more than one, select the type from 0x8100, 0x88A8, 0x9100 or 0x9200.
- Page 190 Ethernet Applications Ethernet Setup and Status The Protocol ID is fixed to 0, and the Ethertype field depends on the upper protocol layer. 'SNAP' is not possible without 'LLC1'. IPv4 Touching the IPv4 layer button displays the parameters available for the Internet Protocol version 4 layer.
- Page 191 Ethernet Applications Ethernet Setup and Status Version, Header length Shows Version and Header length in the IPv4 header. Total length Shows Total length in the IPv4 header. DSCP/TOS When changing the DSCP/TOS (Differentiated Service Code Point/Type of Service) setting, it is possible to define some handling characteristics of the datagram, originally defined in RFC 791.
- Page 192 Ethernet Applications Ethernet Setup and Status Selecting the Renew lease when link is reestablished check box enables the function that automatically renews the lease when the link is reestablished. Selecting the Get gateway servers through DHCP check box enables the function that automatically assigns the gateway. Selecting the Get DNS setup through DHCP check box enables the function that automatically assigns the DNS server.
- Page 193 Ethernet Applications Ethernet Setup and Status Version Shows Version in the IPv6 header. Traffic class Traffic class is similar to IPv4's DSCP/TOS and is used for the class and priority. This is defined in RFC 2474. Flow label The Flow label indicates that the datagram belongs to a specific sequence of traffic between a source and destination.
- Page 194 Ethernet Applications Ethernet Setup and Status User Datagram Protocol is a core protocol of the Internet protocol suite. The UDP provides a minimal and simple interface between a network layer below and a session layer or application above. This protocol does not guarantee reliable and in-order delivery from sender to receiver.
- Page 195 Ethernet Applications Ethernet Setup and Status Transmission Control Protocol is a core protocol of the Internet protocol suite. It is the intermediate layer between the Internet Protocol below it and the application above it. This protocol guarantees reliable and in-order delivery from sender to receiver.
- Page 196 Ethernet Applications Ethernet Setup and Status Source port identifies the sending port. Dst Port Destination port identifies the receiving port. Seq number If the SYN flag is present, this is the initial sequence number and the first data byte is the sequence number plus 1. If the SYN flag is not present, then the first data byte is the sequence number.
- Page 197 Ethernet Applications Ethernet Setup and Status Open the Pattern drop-down menu to select the relevant pattern. 5555 PRBS9 to PRBS31 HF TEST CRPAT JTPAT SPAT User 32 bit If you select the User 32 bit pattern, a button appears with which you can open the Pattern Editor dialog box.
- Page 198 Ethernet Applications Ethernet Setup and Status Variable No. Select which of the two variables you want to define. Field Use the drop-down menu to select the type of field. Note that the contents of the drop-down list depends on which protocol layers are currently chosen for the Ethernet frame.
-
Page 199: Swap
Ethernet Applications Ethernet Setup and Status 6.1.2.3 Swap Touching the Swap button in the navigation area displays the following screen. Swap button appears in Reflector application. This screen is where you configure the traffic loop by specifying how addresses and/or ports are to be swapped and reflected. Selecting Swap all MAC addresses will transmit/reflect all received frames with their MAC addresses swapped. - Page 200 Ethernet Applications Ethernet Setup and Status The configuration options available in the setup area of the screen are described below. The status information is described in a separate section. Incoming Frames Respond to PAUSE frame Selecting this check box will force the transmitter to pause for a short period of time if a pause frame (defined in IEEE 802.3x) is received, e.g.
-
Page 201: Synce
Ethernet Applications Ethernet Setup and Status Select this check box if you want the configuration frames to support communication with CMA3000 and Network Master V2.X or older. 6.1.2.5 SyncE Touching the SyncE button in the navigation area will display the screen shown below. -
Page 202: Ieee 1588V2
Ethernet Applications Ethernet Setup and Status Combination of Ql Type and Ql G.781 G.781 G.781 G.8264 option I option II option III QL-INV0 QL-STU QL-UNK QL-INV0 QL-INV1 QL-PRS QL-INV1 QL-INV1 QL-PRC QL-INV2 QL-INV2 QL-INV2 QL-INV3 QL-INV3 QL-INV3 QL-INV3 QL-SSU-A QL-TNC QL-INV4 QL-INV4 QL-INV5... - Page 203 Ethernet Applications Ethernet Setup and Status This screen allows you to configure the IEEE 1588 clock (based on the IEEE 1588 Precision Time Protocol (PTP), which is used to distribute absolute time across the Ethernet network). An IEEE 1588 clock can act either as a timing master or as a slave.
- Page 204 Ethernet Applications Ethernet Setup and Status Slave mode Used to specify that the port can only act as a slave clock. Used in both multicast (normal) and unicast mode. Unicast(static) Used to enable the unicast profile. For domains 0 to 3 static unicast is enabled.
- Page 205 Ethernet Applications Ethernet Setup and Status Allows you to choose which mechanism to use for calculating the mean path delay: Delay request/response or Peer delay. Transport You can set up the transport protocol(s) for PTP messages either by protocol selecting one of the predefined configurations from the quick selection menu (e.g.
- Page 206 Ethernet Applications Ethernet Setup and Status The Timing tab page contains the timing-specific parameters. In multicast mode it is important that all IEEE 1588v2 clocks in the same domain uses the same announce interval and announce timeout values. Otherwise the best master algorithm may fail. Sync interval and Min. delay Req.
-
Page 207: Oam
Ethernet Applications Ethernet Setup and Status In the IEEE 1588v2 Protocol dialog box the buttons on the left-hand side allow you to select the relevant layers. The current selection is shown at the top of the Frame Content area. Touching one of the layer buttons in the Frame Content area will display the setup parameters for that layer. - Page 208 Ethernet Applications Ethernet Setup and Status OAM (Operation, Administration and Management) is a group of management functions that provides system or network fault indication, performance monitoring, security management, diagnostic functions, configuration and user provisioning. This screen allows you to configure the OAM application (i.e. the OAM functions).
- Page 209 Ethernet Applications Ethernet Setup and Status OAM Protocol In the OAM Protocol dialog box the buttons on the left-hand side allow you to select the relevant layers. The current selection is shown at the top of the Frame Content area. Touching one of the layer buttons in the Frame Content area will display the setup parameters for that layer.
- Page 210 Ethernet Applications Ethernet Setup and Status State Allows you to set the state of the protocol to either On or Off. Note that when State is set to On, the Link mode, Vendor OUI and Vendor specific info parameters are disabled. Link mode Allows you to set the DTEs to Active or Passive mode.
- Page 211 Ethernet Applications Ethernet Setup and Status The screen contains two views: the default Setup view and the Discovery view. Use the Setup and Discovery buttons at the bottom of the screen to switch between the two views. The Setup view is described below. The Discovery view is described in a separate section.
- Page 212 Ethernet Applications Ethernet Setup and Status Only available if a Data or Test TLV type has been selected. Allows you to specify the length of the TLV. Value Only available if a Data or Test TLV type has been selected. Allows you to specify the value of the TLV.
- Page 213 Ethernet Applications Ethernet Setup and Status Use the drop-down menu to specify the MEG level at which the MEP exists. CCM tab page The CCM tab page contains the following parameter: CCM interval Use the drop-down menu to specify the frequency at which CCMs are transmitted and expected to be received.
- Page 214 Ethernet Applications Ethernet Setup and Status Allows you to specify the Organizationally Unique Identifier for the organization defining a specific format and meaning of ETH-MCC. Data Allows you to specify any required additional information. The type of information depends on the specific application of ETH-MCC. LCK tab page The LCK tab page contains the following parameters: Client MEG level...
- Page 215 Ethernet Applications Ethernet Setup and Status The DMM tab page contains the following parameters: Type Use the drop-down menu to select the relevant operation type (On-demand operation or Proactive operation). Rate Use the drop-down menu to select the rate at which DMM frames are transmitted.
- Page 216 Ethernet Applications Ethernet Setup and Status EXM tab page The EXM tab page contains the following parameter: Data Allows you to specify a string which you can send in a message to other remote maintenance points. VSM tab page The VSM tab page contains the following parameter: Data Allows you to specify a string which you can send in a message to other remote maintenance points.
- Page 217 Ethernet Applications Ethernet Setup and Status Devices will appear in the dialog's list as they are discovered. Select the device in the list and touch the Add button in the dialog box. The device is added to the list displayed on the Discovery view screen. Adding devices To add devices manually, touch the Add button on the left side of the manually...
-
Page 218: Filter
Ethernet Applications Ethernet Setup and Status Accept Touch the Accept button when you have entered the desired data in the dialog box. The identified unit is then added to the list displayed on the Discovery view screen. Note that the Accept button is enabled only when you have entered a value in the MEP ID field. - Page 219 Ethernet Applications Ethernet Setup and Status To specify the set of values and/or masks available for each filter (i.e. the columns of the table), touch the Select Filter button. This will launch the filter editor dialog box, which contains a number of check boxes for enabling filters and masks on different addresses.
-
Page 220: Status Information
Ethernet Applications Ethernet Setup and Status For MPLS/VLAN pattern setting, the dedicated dialog box will launch. MPLS Enter the number of MPLS label and TTL (Time To Live). You can select Bottom of Label Stack or Experimental Bits. VLAN Enter the number of VLAN Priority and VLAN ID. You can select CFI Flag. 6.1.3 Status Information This section describes the status information available in the status area of the Ethernet ports setup screen. -
Page 221: Physical Details
Ethernet Applications Ethernet Setup and Status A summary consisting of the most relevant alarm/error indications is displayed constantly. By touching the summary, you can launch a display that contains all alarms/errors. Monitor Buttons At the bottom of the status area are the following buttons that give you access to various monitor information. -
Page 222: Interface
Ethernet Applications Ethernet Setup and Status This is important information for identifying small frequency differences, which may not be visible by showing the current bit rate difference. The accumulated difference information is accumulated continuously. The accumulation is reset when measurement is started or restarted. Link Indicates whether LOS (Loss of Signal) of the transceiver is occured or not. -
Page 223: Oh Capture
Ethernet Applications Ethernet Setup and Status This screen presents key interface status indicators, with Lamp icons showing the current status. These indicators give a quick overview of the condition of the lines. LAN Status Frame Present: Ethernet frames are detected. MPLS frame: Label of MPLS (Multi-Protocol Label Switching) is detected. -
Page 224: Ieee 1588V2
Ethernet Applications Ethernet Setup and Status Touching the SyncE button in the status area of the Ports Setup screen displays the status shown below. This screen presents information related to the status of synchronous Ethernet. SSM/QL Synchronization Status Message and Quality Level status Last received Shows the latest QL value. - Page 225 Ethernet Applications Ethernet Setup and Status Offset Shows the current offset from the master clock. Mean path delay Shows the mean path delay, which is the time from master to slave back to master again, divided by two. Sync timeout Shows the current status of Sync Message reception.
-
Page 226: Oam
Ethernet Applications Ethernet Setup and Status 6.1.3.7 OAM Touching the OAM button in the status area of the Ports Setup screen displays the status shown below. This screen presents information about the status of the OAM functions. The information is split up on a number of tab pages. Note that the layout of the dialog depends on the currently selected OAM protocol. - Page 227 Ethernet Applications Ethernet Setup and Status 802.1ag status information Message buttons Allows you to send messages either to a remote MEP ID or to a unicast MAC Address. U-LBM: Data-path integrity to/from the far-end to/from one address (unicast). M-LBM: Data-path integrity to/from the far-end to/from multiple addresses (multicast).
-
Page 228: Frame Capture
Ethernet Applications Ethernet Setup and Status Y.1731 status information Message buttons Allows you to send messages either to a remote MEP ID or to a unicast MAC Address. U-LBM: Data-path integrity to/from the far-end to/from one address (unicast). M-LBM: Data-path integrity to/from the far-end to/from multiple addresses (multicast). - Page 229 Ethernet Applications Ethernet Setup and Status This screen allows you to set up and execute capture of transmitted frames. Capture Setup Frame slicing Use the Frame slicing drop-down menu to specify which part of the frame will be captured. The available options are: Whole frame, Top 64 Byte, Top 128 Byte.
-
Page 230: Transceiver
Ethernet Applications Ethernet Setup and Status Error Type The possible values are: Any Type, Fragment, Oversized or undersized, Oversized, Undersized and FCS error. Frame Field Touching the left field opens the Field offset dialog box, which enables you Trigger Definition to specify a value between 0 and 15999 in the field. -
Page 231: Errors/Alarms Insertion
Ethernet Applications Ethernet Setup and Status 6.1.4 Errors/Alarms Insertion This section describes the errors or alarms insertion for the Ethernet layer on Application toolbar. Alarms/Errors/ Select the port to insert errors, and the stimuli type. The settings items vary Others depending on the selected stimulus type. -
Page 232: Ethernet Pcs Alarms/Errors
Ethernet Applications Ethernet Setup and Status 6.1.4.2 Ethernet PCS alarms/errors When Port is set to SFP+ 10 Gbps LAN, the PCS alarms/errors is available in following applications. BERT Mon.Gen. Ch Stat 1. Select Alarms or Errors using the radio button. 2. -
Page 233: Ethernet Wan
Ethernet Applications Ethernet Setup and Status 6.1.4.3 Ethernet WAN When Port is set to SFP+ 10 Gbps WAN, inserting the WAN alarms/errors is available. 1. Select Alarms or Errors/Violations using the radio button. 2. Select Destination using the drop down menu. 3. -
Page 234: Bert
Ethernet Applications BERT 6.2 BERT The Bit Error Rate Test (BERT) described in this section is applicable for Ethernet interfaces. For BERT of OTN interface, refer to BERT in "OTN Application". 6.2.1 Ports Setup and Status The first step in running an application is to set up the port interfaces. This is done on the Ports Setup screen, which also provides port status information. - Page 235 Ethernet Applications BERT field on the right. Stop function Allows you to specify when the measurement ends. Select the relevant option from the drop-down menu: Manual stop: Stops the measurement immediately when you touch the Stop button. Stop at: Stops the measurement at the time specified in the Stop at field on the right.
-
Page 236: Generator
Ethernet Applications BERT 10G WAN appears if Port on the Test Setup screen is set to '10 Gbps WAN'. M.2100 10G WAN G.826, G.826+G.829, M.2101.1(M.2100) BERT Options This option appears in the BERT application. Count lost frames as pattern errors Enabling this function means that if a frame is lost then all test pattern bits in the frame are considered errored and will be included in the pattern error counter. -
Page 237: Stream
Ethernet Applications BERT 6.2.2.3 Stream Touching the Stream button in the navigation area displays the following screen. The Follow button appears when the Port 2 settings can follow Port 1. This screen contains the parameters for specifying a profile and pattern for each stream and for specifying which measurements are made. - Page 238 Ethernet Applications BERT Line load start The line load at which the ramp will start. Line load end The line load at which the ramp will end. (This is the value shown on the line load button.) Step size The step size from start to end. Step duration The duration of each step.
-
Page 239: Thresholds
Ethernet Applications BERT 6.2.2.4 Thresholds Touching the Thresholds button in the navigation area displays the following screen. The Follow button appears when the Port 2 settings can follow Port 1. This screen contains the parameters for setting up the various threshold values (i.e. -
Page 240: Test Results
Ethernet Applications BERT Touch the left-hand number to set the lower limit for "Warning". Touch the right-hand number to set the lower limit for "Fail". The lower limit of "Fail" must be equal to or greater than the lower limit of "Warning" (defining a "Within limits"... - Page 241 Ethernet Applications BERT This screen contains a summary of the results of the Ethernet BERT test. The information includes such things as number of pattern errors, average and maximum disruption time, and number of exceeded thresholds. The three dials showing utilization/throughput results, pattern errors and errored frames can be enlarged by clicking on them.
-
Page 242: Ieee1588V2 Log
Ethernet Applications BERT Transport Displays the results of Transport test. This result appears if 'Transport' check box is selected in the Test Setup screen. Pattern Select the pattern. Pattern Error This provides the same Error insertion as Stimuli setup options in insertion Application Toolbar. -
Page 243: Oam Log
Ethernet Applications BERT Search Message type Select the message type from below. Announce DelayReq DelayResp FollowUp Management PDelayReq PDelayResp PDelayRespFollowUp Signaling Sync Select the search method. Filter Previous Next 6.2.3.3 OAM Log Touching the OAM Log button in the navigation area will display the screen shown below. - Page 244 Ethernet Applications BERT This screen presents a detailed analysis of the test results. You can choose to view either the total results from measurement start or the results of a specific interval during the test. You can also zoom in on a specific result item.
- Page 245 Ethernet Applications BERT Performance Frame Burst Size Distribution Transmit Latency Jitter WAN Alarms/Errors WAN G.826 WAN G.826+G.829 WAN M.2101.1(M.2100) SyncE IEEE 1588v2 802.3ah 802.1ag/Y.1731 OTN options appear if the Ethernet signal is carried by OTN. Studying a Touch a specific cell in a result table to zoom in on the corresponding result specific result item.
- Page 246 Ethernet Applications BERT Performance Results Utilization Throughput Frame rate Frame Results Alarms Good Frames Errored Frames Other Frames Last Received Frame diff. Burst Results Frames Burst Size Size Distribution Results Total Frames Size Dist. Frame Size Transmit Results Traffic Latency Results Latency(us) Jitter Results Jitter(us)
- Page 247 Ethernet Applications BERT About Sequence Error and Sequence Sync Loss Sequence Error and Sequence Sync Loss are measured as following: Ethernet frames sent by Network Master include special bytes that indicates sequence number. When receiving this Ethernet frames, Network master sets the sequence number of next incoming Ethernet frame.
-
Page 248: Cable
Ethernet Applications Cable 6.3 Cable The Ethernet Cable Test uses Time Domain Reflectometry (TDR) to validate and detect open and short circuited CAT5/CAT5E cables. This test is convenient for installation and troubleshooting of cables. Time Domain Reflectometry Principle The TDR method can be used for control of electrical cables. The TDR transmits a short pulse which will be fully absorbed if the cable is perfectly terminated. - Page 249 Ethernet Applications Cable This screen allows you to control and monitor an Ethernet Cable Test. Test setup Color Coding Standard controls Allows you to select the color coding used for the graphical representation of the cables. In the drop-down menu, you can choose between T-568A (CAT5) and T-568B (CAT5E).
-
Page 250: Channel Statistics
Ethernet Applications Channel Statistics 6.4 Channel Statistics The Channel Statistics test separates incoming frames into channels based on a number of defining characteristics (Definitions) and shows information about each channel (Statistics). The test is mostly used for in-service monitoring, where it provides data for detailed analysis of the traffic types present in the network. -
Page 251: Test Results
Ethernet Applications Channel Statistics 6.4.3 Test Results 6.4.3.1 Summary Touching the Summary button in the navigation area will display the screen shown below. This screen presents the results of the Channel Statistics test. The screen contains two lists, one which lists the created channels and another which shows the results for each channel. -
Page 252: Ieee1588V2 Log
Ethernet Applications Channel Statistics Definitions The selected check boxes correspond to the columns currently shown in the channels list on the Summary screen. Statistics The selected check boxes correspond to the columns currently shown in the results list on the Summary screen. Note that the check boxes are placed under categories. -
Page 253: Mon/Gen
Ethernet Applications Mon/Gen 6.5 Mon/Gen Ethernet Monitor/Generate is typically used for out-of-service and performance testing. It is possible to perform a passive, non-intrusive monitoring or at the same time transmit test data, which can be reflected for further evaluation and testing of the network. -
Page 254: Thresholds
Ethernet Applications Mon/Gen This screen contains the parameters for specifying a profile and pattern for each stream and for specifying which measurements are made. Stream selection Use the slide-out panel on the left-hand side of the screen to select the relevant stream. - Page 255 Ethernet Applications Mon/Gen This screen contains a summary of the results of the Ethernet Monitor/Generate test. The information includes such things as number of errored frames and number of exceeded thresholds. The three dials showing utilization/throughput results, pattern errors and errored frames can be enlarged by touching on them.
-
Page 256: Ieee1588V2 Log
Ethernet Applications Mon/Gen Transport Displays the results of Transport test. This result appears if 'Transport' check box is selected in the Test Setup screen. The stream slide-up at the bottom of the screen allows you to configure and inspect the measurements of each individual stream. Display/Hide the slide- up by touching the handle icon. -
Page 257: Statistics
Ethernet Applications Mon/Gen Touching the Event Log button in the navigation area displays the screen providing the event log data. Refer to Event Log of SDH/SONET/PDH/DSn BERT application. 6.5.3.5 Statistics Touching the Statistics button in the navigation area displays the screen shown below. - Page 258 Ethernet Applications Mon/Gen If you have stopped measurement during the interval time, the measurement results of the current interval are discarded. The log of the current interval is not displayed in Back field. In this case, result data are re-calculated excluding the data of the current interval when the measurement is stopped.
- Page 259 Ethernet Applications Mon/Gen Multi Stream Transmit Traffic Multi Stream Throughput Throughput Multi Stream Frame Loss Frame Loss Multi Stream Latency Latency(us) Multi Stream Jitter Jitter(us) SyncE SSM Statistics Alarms Rx SSM QL IEEE 1588v2 Offset Stat. Offset Variance Mean Path Delay Message Stat Clock Status Stat.
-
Page 260: Pass Through
Ethernet Applications Pass Through 6.6 Pass Through Ethernet Pass Through enables non-intrusive in-service monitoring for both fast troubleshooting and detailed analysis of the live traffic on a network. All traffic received on a port is forwarded on the other port and vice versa. Traffic between the two network DUT elements is monitored as illustrated below. -
Page 261: Test Results
Ethernet Applications Pass Through Ethernet When you select the check box, you can enable various thresholds. Touch the Setup button to display the Ethernet threshold setup dialog box. 6.6.3 Test Results 6.6.3.1 Summary When you go to the test results of the Ethernet Pass Through application, the following screen is displayed. -
Page 262: Ping
Ethernet Applications Ping 6.7 Ping The Ethernet Ping test is a quick and easy way for testing, troubleshooting and verification of connectivity and latency. Packets are sent from the source address to the destination address and back again - allowing the user to determine whether traffic is possible. -
Page 263: Test Results
Ethernet Applications Ping 6.7.3 Test Results The results of an Ethernet Ping test relate to a specific port and consist of the Round Trip Times of the ping requests. The data is shown in both list-form and in a graphical presentation. Graphical The graphical presentation consists of a bar diagram of the Round Trip presentation... -
Page 264: Event Log
Ethernet Applications Ping This screen presents the detailed results of an Ethernet Ping test. The results relate to a specific port and consist of the Round Trip Times of the individual Ping requests. The data is shown in both list-form and in a graphical representation. -
Page 265: Reflector
Ethernet Applications Reflector 6.8 Reflector In Ethernet Reflector mode the Network Master loops incoming traffic on a port swapping MAC and/or IP addresses. HDX (Half Duplex) is not possible in 'Reflector' mode. 6.8.1 Ports Setup and Status The first step in running an application is to set up the port interfaces. This is done on the Ports Setup screen, which also provides port status information. -
Page 266: Test Setup
Ethernet Applications Reflector Please refer to the sections relevant for your current port setup requirements. 6.8.2 Test Setup 6.8.2.1 Control Refer to "Control in BERT Test Setup subsection for the operation. 6.8.2.2 Thresholds Touching the Thresholds button in the navigation area displays the following screen. -
Page 267: Test Results
Ethernet Applications Reflector 6.8.3 Test Results 6.8.3.1 Summary When you go to the test results of the Ethernet Reflector application, the following screen is displayed. This screen contains a summary of the results of the Ethernet Reflector test. The information includes such things as number of errored frames and number of exceeded thresholds. -
Page 268: Rfc 2544
Ethernet Applications RFC 2544 6.9 RFC 2544 The RFC 2544 is a benchmarking methodology and defines a number of tests to be used for describing the performance characteristics of a network device (or a complete network). The Network Master includes several physical setups (test modes) and four different tests. - Page 269 Ethernet Applications RFC 2544 This screen allows you to specify your test mode and select which RFC 2544 tests to carry out. Select Test Mode 4 different test modes are available: Switch/Router test Router latency test End to end network test Single ended network test Select the test mode to define your test configuration.
- Page 270 Ethernet Applications RFC 2544 In this test mode, the latency-test sends out ping frames, used for measuring the response time for router equipment. The maximum line load for the Router Latency Test is 1 Mbps. The Network Master is capable of responding to incoming ping frames, and can thus be used to run the Router Latency Test port to port, if required.
-
Page 271: Throughput
Ethernet Applications RFC 2544 Note that you cannot select 'Throughput and Frame Loss' and 'Throughput' / 'Frame Loss' at the same time. Single ended network test This test is used when testing network by reflecting traffic back to the Network Master. This requires a device to reflect the traffic back e.g. a second Network Master. - Page 272 Ethernet Applications RFC 2544 User defined Check boxes for the following predefined sizes are available: 64, 128, 256, 512, 768, 1024, 1280, 1518 and 1519 to 16000(Using the field at right bottom). Stepped Setup of Start frame size, End frame size and Step frame size is available.
-
Page 273: Frame Loss
Ethernet Applications RFC 2544 The Resolution field lets you specify the precision of the auto search. A higher precision extends the duration of the test. Available resolutions are: 0.1, 1.0 and 10.0 %. The check boxes are enabled except when selecting 'End to End network test' on Control screen. -
Page 274: Latency
Ethernet Applications RFC 2544 This screen allows you to configure the following parameters related to an RFC 2544 Throughput and Frame Loss test: Frame Size Line Load Duration The settings for 'Throughput and Frame Loss' are identical to the ones described in the Throughput section above. -
Page 275: Burst
Ethernet Applications RFC 2544 Most of the settings for Latency are identical to the ones described above in the Throughput section. Please see the detailed descriptions in that section in addition to the Latency-specific information provided here. Only run steps where other test passed Allows you to select the other test that must have passed. -
Page 276: Advanced
Ethernet Applications RFC 2544 Stop on no frame loss at maximum burst size If selected, the burst test stops on no frame loss at maximum burst size. Auto search If selected, the burst length is searched automatically. Select the search method from Mode. -
Page 277: Test Results
Ethernet Applications RFC 2544 Use local source addresses for destination on remote side When this function is enabled, the Network Master does not use the IP or MAC addresses for differentiating frames during the RFC 2544 test. An exception is End to End test control, but routing equipment in the network may need the addresses to be set up correctly. -
Page 278: Summary
Ethernet Applications RFC 2544 On the test-specific result screen, you switch between the two modes by using the Graph and Table buttons. 6.9.3.1 Summary When you go to the test results of the Ethernet RFC 2544 application, the following screen is displayed. This screen presents the current status of the test(s) (Configured / Not Started, Running, Completed or Not Configured). -
Page 279: Frame Loss
Ethernet Applications RFC 2544 This screen presents the results from the Throughput test. The most important columns of the tables are the varied main parameters Frame size and Throughput and the performance parameter Frames lost. The order of the tables will vary depending on the test mode and the relation of the ports. -
Page 280: Throughput And Frame Loss
Ethernet Applications RFC 2544 The most important columns of the tables are the varied main parameters Frame size and Throughput and the performance parameter Loss rate. The order of the tables will vary depending on the test mode and the relation of the ports. -
Page 281: Burst
Ethernet Applications RFC 2544 This screen presents the results from the Latency test. The most important columns of the tables are the varied main parameters Frame size and Throughput and the performance parameters Min, Avg and Max latency stated in micro seconds. The order of the tables will vary depending on the test mode and the relation of the ports. - Page 282 Ethernet Applications RFC 2544 Each calculation is done on a one second base. It is possible either to register the maximum throughput (actually showing only the second with the highest throughput), or to register an average throughput per second taken over a selected part of the test period.
-
Page 283: Rfc 6349
Ethernet Applications RFC 6349 6.10 RFC 6349 The RFC 6349 Framework for TCP Throughput Testing describes a practical methodology for measuring end-to-end TCP Throughput in a managed IP network. For using RFC 6349 application, TCP Throughput option is required to the test module. - Page 284 Ethernet Applications RFC 6349 This screen allows you to specify your test mode and select which RFC 6349 tests to carry out. General Connection Port Touch the fields to set the port number. Full Auto Test Sequence If selecting check box, followings are selected: Local ->...
-
Page 285: Mtu / Rtt
Ethernet Applications RFC 6349 Runs a test to determine the Path MTU (Maximum Transmission Unit). If cleared, set the Upstream MTU and Downstream MTU. Baseline RTT Runs a test to determine the Baseline RTT. If cleared, set the Baseline RTT value in the field. - Page 286 Ethernet Applications RFC 6349 If Auto is selected on "Control" screen, following screen appears. If Expert is selected on "Control" screen, following screen appears. BDP (Bytes) Appears when Test mode is set to Auto. If CIR and Baseline RTT are set on "Control"...
-
Page 287: Multi-Service
Ethernet Applications RFC 6349 Select the Enable Threshold check box if enabling the PASS/FAIL test. Touch the % of Ideal field to set the threshold of throughput. Touch the Step Duration field to set the duration of a step. Auto Test parameters are set automatically. -
Page 288: Summary
Ethernet Applications RFC 6349 Graphical The results of the performed RFC 6349 tests can be presented in either presentation tabular form or as graphical representations. The graphical presentation mode provides an overview of the results and the progress of the test. 6.10.3.1 Summary When you go to the test results of the Ethernet RFC 6349 application, the following screen is displayed. -
Page 289: Window Scan
Ethernet Applications RFC 6349 Ideal TCP Transfer Time is calculated from bit rate, MTU and TCP payload bytes. The Maximum Transmission Unit (MTU) is obtained from Path MTU test. TCP Efficiency TCP Efficiency is the ratio of transmitted bytes without retransmission in transmitted total bytes. -
Page 290: Multi-Service
Ethernet Applications RFC 6349 This screen presents the Throughput results in graph or table. Touch the Graph and Table buttons to switch between the tabular form and a graphical presentation of the results. The ideal throughput, RTT and TCP Efficiency are shown in the graphical presentation. -
Page 291: Event Log
Ethernet Applications RFC 6349 This screen presents results by each TCP connection of RTT, Throughput Efficiency. Use the Graph and Table buttons to switch between the tabular form and a graphical presentation of the results. Touching the button in navigation area switches the Test direction of results. The results in Connection are: Connection: Connection number of the stream Min RTT: Minimum Round Trip Time... -
Page 292: Sat 1564
Ethernet Applications SAT 1564 6.11 SAT 1564 Service Activation Test is an out-of-service test used to assess the proper configuration and performance of Ethernet services. The test methodology, which is described in the ITU-T recommendation Y.1564, applies to point-to- point and point-to-multipoint connectivity in the Ethernet layer and to the network portions that provide (or contribute to) the provisioning of such services. - Page 293 Ethernet Applications SAT 1564 This screen allows you to configure the test mode and other general parameters related to a Service Activation Test. Test Mode Use the radio buttons to select the relevant test mode. One-Way Test In this test mode, two Network Master units will work together performing the test.
- Page 294 Service Configuration Test. External GPS sensor is available from Anritsu (part no. G0325A). Use local SRC as DST on remote side Select this to transfer the local source IP address to the remote side, to be used as destination IP address.
-
Page 295: Services
Ethernet Applications SAT 1564 Layer 2 testing For Layer 2 only traffic generation, the network must support transparent connections if One-Way test mode is selected. 6.11.2.2 Services Touching the Services button in the navigation area will launch the screen shown below. If the End to End test setup on the 'Control' screen has been set to asymmetrical service attributes setups, two Services buttons are displayed instead of one: Services L->R button and Services R->L button. - Page 296 Ethernet Applications SAT 1564 Profile In case of Round-Trip Test mode, the drop-down menu at the top allows you to select the service profile as either Data, Video or Voice. Encoding Open the drop-down menu to select the relevant encoding type. The available values depend on the selected profile type.
- Page 297 Ethernet Applications SAT 1564 Allows you to specify the Committed Information Rate (CIR). When set to zero, the CIR test is excluded. If color awareness is enabled (see below), this is the bit rate for green frames. Allows you to specify the Excess Information Rate (EIR). When set to zero, the EIR test is excluded.
- Page 298 Ethernet Applications SAT 1564 Traffic policing margin Only active when the traffic policing test is enabled. Allows you to specify a margin for the pass/fail evaluation during the service configuration test. The test will fail if the throughput is greater than CIR + EIR + Margin. Frame transfer delay / RT Frame transfer delay Allows you to specify the maximum acceptable transfer delay in ms (mean).
- Page 299 Ethernet Applications SAT 1564 Select the Enabled check box to enable color awareness. You can then choose the color method (PCP or IP DSCP), as well as the priority values to mark the green and yellow frames with. Choose PCP to use VLAN priority coloring. This requires that VLAN is enabled.
-
Page 300: Advanced
Ethernet Applications SAT 1564 Touching EMIX sequence field opens the dialog box. Frame size is protocol headers and payload combined. Frame size does not include preamble and interframe gap. 6.11.2.3 Advanced Miscellaneous Allows to select Include addresses in frame filter on receiver check box. -
Page 301: Summary
Ethernet Applications SAT 1564 During a One-Way test, status for the GPS time synchronization is displayed at the top of the screen with colored Lamps - one Lamp for the local side and one for the remote side. Green GPS synchronization is OK. Yellow GPS synchronization has been lost for too long a time. -
Page 302: Performance Test
Ethernet Applications SAT 1564 This screen presents the detailed Configuration Test results for a specific service. Use the drop-down menu at the top of the screen to select which service to view. The results are presented in a table and are related to a specific CIR% (CIR 25.00%, CIR 50.00%, CIR 75.00%, and CIR 100%). -
Page 303: Event Log
Ethernet Applications SAT 1564 Shows the minimum, mean and maximum bit rate in Mbps. Depending on the test setup, the bit rate is either Information Rate (IR). Shows the number of lost frames and the frame loss ratio. The frame loss ratio is frames lost divided by frames transmitted. -
Page 304: Ports Setup And Status
Ethernet Applications Traceroute 6.12 Traceroute The Traceroute test is used to determine the route taken by packets in an IP network. The intermediate routers traversed are identified by the sending of a sequence of ICMP Ping packets to the desired destination, each packet with a too low Time-to-Live (TTL) or hop limit so that it terminates in one of the routers and makes the router return an error message. -
Page 305: Test Results
Ethernet Applications Traceroute Test Duration Number of attempts Used to specify the maximum number of times that Ping packets with each TTL value are transmitted. If no ICMP type 11 or ping reply is received after this number of attempts, the test will move on to a higher TTL value. Max number of hops Used to specify the maximum number of hops performed in the test. -
Page 306: Event Log
Ethernet Applications Traceroute 6.12.3.3 Event Log Touching the Event Log button in the navigation area displays the screen providing the event log data. Refer to Event Log of SDH/SONET/PDH/DSn BERT application. 6.12.3.4 Statistics Touching the Statistics button in the navigation area displays the screen providing the statistics data. -
Page 307: Otn Applications
OTN Applications Traceroute 7 OTN Applications This chapter describes the graphical user interface (i.e. screens, sub- screens and major dialog boxes) related to OTN-only applications. Sub- screens and dialogs are described under the main screen from which they are activated/launched. The following setting and applications are available: OTN Setup and Status BERT... -
Page 308: Otn Setup And Status
OTN Applications OTN Setup and Status 7.1 OTN Setup and Status An OTUk button in the navigation area of the Ports Setup screen gives you access to the OTN setup for the transmitter and/or receiver of the currently selected port. OTN (Optical Transport Networking) provides support for optical networking using wavelength-division multiplexing (WDM). -
Page 309: Otuk Frame Setup
OTN Applications OTN Setup and Status side. Clock Use the drop-down menu to select the clock source. This is fixed to Configuration Received when Transmission is set to Through or OH overwrite. Timing Source Internal: Internal clock of the module External: The clock input to the connector GPS: The clock provided from the external GPS sensor Received: The clock generated from the received signal... -
Page 310: Mapping
OTN Applications OTN Setup and Status Client Signal Multiplexing 1 Multiplexing 2 See a description of the setting options in the Mapping Dialog section below. FEC Control Use the drop-down menu to select whether or not to transmit FEC (Forward Error Correction) data. - Page 311 OTN Applications OTN Setup and Status Touching the Mapping button in the upper left-hand corner of the Ports Setup screen launches the dialog box shown below. This dialog box allows you to define OTUk frame mapping. Output Signal Defines the bit rate the output from the Tx port. OTU1: 2.666 Gbit/s OTU2: 10.709 Gbit/s OTU1e: 11.049 Gbit/s...
-
Page 312: Overhead
OTN Applications OTN Setup and Status ODTU12 (PT=21) : Supports 1.25G Tributary Slot (TS). ODTU2.ts : Supports ODUflex. One to eight TSs can be selected. ODTU01 : Supports 1.25G Tributary Slot (TS). Multiplexing 2 Applicable when there are three levels of multiplexing. Defines into which higher order ODU is multiplexed. - Page 313 OTN Applications OTN Setup and Status BIP-8 byte (Bit Interleaved Parity level 8 code) 3rd byte: Bits 1-4: BIP violations (BEI/BIAE) Bit 5: Signal fail status (BDI) Bit 6: Frame alignment error (IAE) Bits 7-8: Reserved for future use The TTI byte and 3rd byte can both be edited by launching the OTUk SM- TTI dialog box.
- Page 314 OTN Applications OTN Setup and Status GCC0-GCC2 These fields are used to carry transmission management and signaling information. These bytes can be edited in hexadecimal value. TCM1-TCM6 TCM1-TCM6 consists of the following parameters: TTI byte (Trail Trace Identifier) BIP-8 byte (Bit Interleaved Parity level 8 code) 3rd byte: Bits 1-4: BIP violations (BEI/BIAE) Bit 5: Signal fail status (BDI)
- Page 315 OTN Applications OTN Setup and Status 3rd byte Bit 6-8: STAT Bits 6-8 show TCM status. Bits 6-8 TCM status no source TC in use without IAE in use with IAE Reserved Reserved ODUk-LCK ODUk-OCI ODUk-AIS FTFL The FTFL message consists of two 128-byte fields. Launch the ODUk FTFL dialog box to edit the fields.
- Page 316 OTN Applications OTN Setup and Status The TTI byte and 3rd byte can both be edited by launching the ODUk PM- TTI dialog box, which is similar to the dialog box used to edit SM. The TTI (Trail Trace Identifier) is a 64-Byte signal that occupies one byte of the frame and is aligned with the OTUk multiframe.
- Page 317 OTN Applications OTN Setup and Status Bits 1-4 Meaning 0000 NR (No request) 0001 DNR (Do not revert) 0010 RR (Reverse request) 0011 Reserved 0100 EXER (Exercise) 0101 Reserved 0110 WT (Wait-to-restore) 0111 Reserved 1000 MS (Manual switch) 1001 Reserved 1010 SD (Signal degrade) 1011...
- Page 318 OTN Applications OTN Setup and Status Payload type value 0x01 Experimental mapping 0x02 Asynchronous CBR mapping 0x03 Bit synchronous CBR mapping 0x04 ATM mapping 0x05 GFP mapping 0x06 Virtual Concatenated signal PCS codeword transparent Ethernet mapping: 0x07 1000BASE-X into OPU0 0x08 FC-1200 into OPU2e mapping 0x09...
-
Page 319: Tp/Ts
OTN Applications OTN Setup and Status 7.1.1.5 TP/TS Touching a TP button on the Ports Setup screen launches the TP/TS dialog box. Note that the contents and layout of the dialog box depends on which higher order type has been selected. This dialog box allows you to define OTUk frame mapping. -
Page 320: Receiver Setup
OTN Applications OTN Setup and Status Set three bits of PTI (Payload Type Identifier). When setting PTI to 100-Client Management, all transmitting GFP-F frames is Client Management Frame. Set a bit of PFI (Payload Frame Check Sequence Identifier). On presents payload FCS (Frame Check Sequence). -
Page 321: Otuk Frame Setup
OTN Applications OTN Setup and Status The configuration options available in the setup area of the screen are described below. The status information is described in a separate section. Receiver Touch the button to select the interface. Off: No signal input interface. SFP/SFP+: Available bit rate is up to 2.5 Gbit/s for SFP, up to 10 Gbit/s for SFP+. -
Page 322: Tp/Ts
OTN Applications OTN Setup and Status FEC Control Use the drop-down menu to select whether or not to transmit FEC (Forward Error Correction) data. No FEC: FEC Decoding (Error Correction) is set OFF. RS(255,239): FEC Error Correction is active based on RS(255,239) code defined in ITU-T Rec. -
Page 323: Tti Detection
OTN Applications OTN Setup and Status TP/TS dialog box has three screen depending on the Mode setting. 7.1.2.4 TTI detection Touching the TTI detection button in the upper right-hand corner of the Ports Setup screen launches the dialog box shown below. This dialog box allows you to select the detection method for SM, PM, and TCM1-6. -
Page 324: Status Information
OTN Applications OTN Setup and Status The dialog box is used to set the detection method of MSIM (Multiplex Structure Identifier Mismatch). Setup Follow Select the source of the Expected MSI in the drop-down menu. The expected MSI is displayed in the dialog box. (None) : MSIM is not detected. -
Page 325: Alarms And Errors
OTN Applications OTN Setup and Status Touching the topmost summary box in the status area of the Ports Setup screen displays the status shown below. This screen presents detailed information about the current physical status of the optical signal. Signal Level Shows the input level of an optical signal. - Page 326 OTN Applications OTN Setup and Status This screen contains detailed alarm and error information related to the OTN layer. Status is indicated by the use of colored lamp icons. Level-specific If the ODUk is multiplexed, touch the relevant OTU/ODUk level button. alarms Alarms OTU Alarms...
-
Page 327: Oh Capture
OTN Applications OTN Setup and Status tHEC correctable: type Header Error Check Correctable tHEC uncorrectable: type Header Error Check Uncorrectable eHEC correctable: extension Header Error Check Correctable eHEC uncorrectable: extension Header Error Check Uncorrectable Invalid GFP frame: Invalid Transport Generic Frame Procedure Frame Superblock CRC: Superblock where CRC error occurred CSF signal: Client Signal Fail CSF sync: Client Signal Fail synchronization... -
Page 328: Tributary Scan
OTN Applications OTN Setup and Status In the byte-specific dialog box, select the display format (ASCII or Hex) using the Operator Specific Area drop-down menu. 7.1.3.5 Tributary scan Touching the Tributary scan button in the status area of the Ports Setup screen displays the status shown below. -
Page 329: Transceiver
OTN Applications OTN Setup and Status Touching the Detail button enables showing details for a specific ODUk. With the Detail button active, you can see the detail information by touching the button in red. The Tributary details dialog box contains the following information: Path to the selected form (for example, "ODU2-ODTU12(PT=21)-ODU1 #2") -
Page 330: Error/Alarm Insertion
OTN Applications OTN Setup and Status Module Present Green indicates that an optical transceiver is currently mounted. Transceiver Select the information from pull down menu. Information Wavelength and bit rate shows the nominal wavelength and bit rate. Compliance shows the available standards. Vendor information shows the data stored in the optical transceiver. - Page 331 OTN Applications OTN Setup and Status touch the Error Insert icon. Alternate: Repeats error/alarm insertion per specified number of frames. The Error Insert icon shows only status. All: Inserts errors or alarms in all OTU frame. The Error Insert icon shows only status.
-
Page 332: Otn Frequency
Touch the Error Insert icon. The error is inserted once by touching the icon. For O.182 Poisson, refer to the white paper on Anritsu homepage: FEC Efficiency New Test Method - Required by ITU-T New Rec. O.182 - 7.1.4.2 OTN frequency Touch the field to set Frequency Offset. -
Page 333: Aps
OTN Applications 7.2 APS The APS (Automatic Protection Switching) test measures the switching time in protecting the system from failure Switching time is defined below. The start and stop trigger can be selected independently. Trigger event can be selected from the high order OTU and ODU. The pass/fail thresholds for switching time can be set. - Page 334 OTN Applications This screen contains the parameters for setting up the threshold values for errors and Pass/Fail status. Start Trigger, Stop Trigger Use the drop-down menu(s) to select the appropriate trigger. Start and stop triggers include the following: LOF, OOF, ODU-AIS etc. Error Free Period Alarms or Errors set up in stop trigger are not in a measured signal within the time of this cycle, end the switching time measurement.
- Page 335 OTN Applications Buttons for selecting the relevant port are displayed at the top of the screen, with a color indication of the pass/fail status of the test. This screen presents the detailed results of an OTN APS test. The results relate to a specific port and consist of the Automatic Switching times of the APS requests.
- Page 336 OTN Applications BERT 7.3 BERT The Bit Error Rate Test (BERT) described in this section is applicable for OTN interfaces. 7.3.1 Ports Setup and Status The first step in running an application is to set up the port interfaces. This is done on the Ports Setup screen, which also provides port status information.
- Page 337 OTN Applications BERT Stop button. Stop at: Stops the measurement at the time specified in the Stop at field on the right. Duration: Performs the measurement for the duration of time specified on the right. Memory allocation Allows you to specify how the measurement will be stored in the Network Master's memory.
- Page 338 OTN Applications BERT Set the Allocation ratio of OTUk, ODUk or TCMi. These parameters are displayed if Type is M.2401/M.2110. Section Objective (SESR) Set the limit of SESR (Severely Errored Seconds Ratio). SES (Severely Errored Second) is a one-second period which contains 15% or more errored blocks or at least one defect.
- Page 339 OTN Applications BERT Touch the left-hand number to set the lower limit for "Warning". Touch the right-hand number to set the lower limit for "Fail". The lower limit of "Fail" must be equal to or greater than the lower limit of "Warning" (defining a "Within limits"...
- Page 340 OTN Applications BERT Touching the Statistics button in the navigation area displays the screen shown below. This screen presents a detailed analysis of the test results. You can choose to view either the current results (i.e. results measured during one second) or the total results from measurement start.
- Page 341 OTN Applications BERT Selecting type of Open the drop-down menu in the top row plus the drop-down menu below it results to select which results you want displayed on the screen. OTN - Alarms/Errors OTN - Performance Selecting how results are displayed Selecting Select the required notation for the results from the notation drop-down notation...
- Page 342 OTN Applications 7.4 RTD The Round-Trip Delay (RTD) time is the duration time of the network and the network equipments. Network Master measures RTD using a trigger injected in ODU frame. At first, Network Master transmits the trigger signal. Network Master measures the RTD by receiving the trigger signal returned from the network to be measured or the network equipment.
- Page 343 OTN Applications 7.4.2.2 Threshold Touching the Thresholds button in the navigation area displays the following screen. This screen allows you to configure the RTD test conditions for the currently selected port(s). Threshold Maximum limit Allows you to specify a threshold value of RTD in micro seconds (μs). 7.4.3 Test Results 7.4.3.1 Summary Touching the Summary button in the navigation area will display the screen...
- Page 344 OTN Applications 7.4.3.2 Detailed Touching the Detailed button in the navigation area will display the screen shown below. Buttons for selecting the relevant port are displayed at the top of the screen, with a color indication of the pass/fail status of the test. This screen presents the detailed results of an RTD test.
- Page 345 CPRI/OBSAI Applications 8 CPRI/OBSAI Applications This chapter describes the graphical user interface (i.e. screens, sub- screens and major dialogs) related to CPRI (Common Public Radio Interface) and OBSAI (Open Base Station Architecture Interface) applications. Sub- screens and dialogs are described under the main screen from which they are activated/launched.
- Page 346 CPRI/OBSAI Applications CPRI/OBSAI Setup and Status 8.1 CPRI/OBSAI Setup and Status CPRI (Common Public Radio Interface) is an interface designed for the communication inside the base station used for the mobile radio communications. OBSAI (Open Base Station Architecture Initiative) defines the architecture of the cellular base station, including the interface between base band block and RF block.
- Page 347 CPRI/OBSAI Applications CPRI/OBSAI Setup and Status OBSAI Line bit rates Bit Rate Multiplexer × (MBaud) Base bit rate (MBaud) 1 × 768 1536 2 × 768 3072 4 × 768 6144 8 × 768 The CPRI/OBSAI uses the optical ports. MU100010A Connector Panel 8.1.1 Physical Port Setup When the port is set up with a CPRI/OBSAI interface, touching the Port button...
- Page 348 CPRI/OBSAI Applications CPRI/OBSAI Setup and Status GPS: The clock provided from the external GPS sensor Received: The clock generated from the received signal When External or Received is set, the indicator on the right is on if the clock is detected. Transceiver Displays the Transceiver information.
- Page 349 CPRI/OBSAI Applications CPRI/OBSAI Setup and Status Select the port role from Master or Slave. Timing setting will be changed to "Received" if setting to Slave. Protocol If CPRI Link is set to Disabled, select the CPRI Protocol version from 1 or 2. Protocol version 2 appears if the line rate is set to 4915.2 Mbps or more.
- Page 350 CPRI/OBSAI Applications CPRI/OBSAI Setup and Status This screen presents information about the current state of the link. Rx signal level Shows the optical signal level in dBm. If the optical signal detection failed, a red indicator appears on the right. Rx Bit rate Shows the actual bit rate of the receiver (in bps).
- Page 351 CPRI/OBSAI Applications CPRI/OBSAI Setup and Status This screen contains detailed alarm and error information related to the CPRI/OBSAI interface. Status is indicated by the use of colored Lamp icons. Remote and Link are displayed only when the content is set to CPRI. Alarms Signal loss: Optical signal is not detected.
- Page 352 CPRI/OBSAI Applications CPRI/OBSAI Setup and Status 8.1.4 Error/Alarm Insertion This section describes how to configure settings for inserting errors or alarms by using the Application toolbar of CPRI/OBSAI. Alarms/Errors/ Select the port to insert errors, and the stimuli type. The settings items vary Others depending on the selected stimulus type.
- Page 353 CPRI/OBSAI Applications BERT 8.2 BERT This section describes the Bit Error Rate Test (BERT) that is applicable to CPRI/OBSAI interfaces. For BERT of OTN interface, refer to BERT in "OTN Application". 8.2.1 Ports Setup and Status After the application is launched, first configure the port interface in the Ports Setup screen where you can view port status information.
- Page 354 CPRI/OBSAI Applications BERT Stop function Allows you to specify when the measurement ends. Select the relevant option from the drop-down menu: Manual stop: Stops the measurement immediately when you touch the Stop button. Stop at: Stops the measurement at the time specified in the Stop at field on the right.
- Page 355 CPRI/OBSAI Applications BERT Refer to Thresholds of BERT section in "SDH/SONET/PDH/DSn Applications". 8.2.3 Test Results 8.2.3.1 Summary When you go to the test results of the CPRI/OBSAI BERT application, the following screen is displayed. This screen contains a summary of OTN/CPRI/OBSAI BERT results. Statistics The lamp icon in Status column shows the Pass or Fail results for each Category...
- Page 356 CPRI/OBSAI Applications BERT Burst length If 'Insertion' is set to Manual, touch the button and set the burst length to insert. 8.2.3.2 Event Log Touching the Event Log button in the navigation area displays the screen providing the event log data. Refer to Event Log of SDH/SONET/PDH/DSn BERT application.
- Page 357 CPRI/OBSAI Applications BERT If you have stopped measurement during the interval time, the measurement results of the current interval are discarded. The log of the current interval is not displayed in Back field. In this case, result data are re-calculated excluding the data of the current interval when the measurement is stopped.
- Page 358 CPRI/OBSAI Applications BERT Results Results are displayed according to your choice. OTN Alarms/Errors Refer to Results in "OTN Application" OTN Performance Refer to Results in "OTN Application" BERT Results Alarms Errors Frame Results Frame count Round Trip Delay Results Delay Measurement count 8.3 Pass Through MT1000A Network Master Pro...
- Page 359 CPRI/OBSAI Applications Pass Through 8.3 Pass Through CPRI/OBSAI Pass Through enables non-intrusive in-service monitoring. All traffic received on a port is forwarded on the other port and vice versa. Traffic between the two network DUT elements is monitored as illustrated below. 8.3.1 Ports Setup and Status The first step in running an application is to set up the port interfaces.
- Page 360 CPRI/OBSAI Applications Pass Through This screen contains a summary of the results of the CPRI Pass Through test. Transport Displays the results of Transport test. This result appears if 'Transport' checkbox is selected in the Test Setup screen. 8.3.3.2 Event Log Touching the Event Log button in the navigation area displays the screen providing the event log data.
- Page 361 Fibre Channel (FC) Applications Pass Through 9 Fibre Channel (FC) Applications This chapter describes the graphical user interface (i.e. screens, sub- screens and major dialogs) related to Fibre Channel applications. Sub- screens and dialog boxes are described under the main screen from which they are activated/launched.
- Page 362 Fibre Channel (FC) Applications Fibre Channel Setup and Status 9.1 Fibre Channel Setup and Status Fibre Channel (FC) is a high-speed network technology, commonly running at 1, 2, 4, 8, 16 and 20 Gigabit per second rates. It is primarily used to connect computer data storage.
- Page 363 Fibre Channel (FC) Applications Fibre Channel Setup and Status This screen allows you to specify the physical port configuration of the currently selected Fibre Channel port. It can also be used to inspect the current status of the selected port. The configuration options available in the setup area of the screen are described below.
- Page 364 Fibre Channel (FC) Applications Fibre Channel Setup and Status Topology Point to Point is the point to point connection. Select the Login check box to establish the connection. For FC Reflector, selecting the Login check box requires peer to do an actual login. Fabric is the connection using fibre channel switch.
- Page 365 Fibre Channel (FC) Applications Fibre Channel Setup and Status Frame Setup setting is not used in FC BERT. In Fibre Channel Reflector mode you should activate connection to a FC Switch, after you have selected framing as SOF:Header:Data:CRC:EOF. If activating connection to a FC Switch when framing is set to SOF:Data:EOF, all frames outputted from the FC Switch are reflected to it.
- Page 366 Fibre Channel (FC) Applications Fibre Channel Setup and Status This dialog box allows you to configure the frame header for framed Fibre Channel signals. The following parameters can be edited: Seq ID: Unique frame sequence identifier OX ID: Originator Exchange ID Rx ID: Responder Exchange ID The figure below shows the full frame header structure.
- Page 367 Fibre Channel (FC) Applications Fibre Channel Setup and Status This screen presents information about the physical state and current state of the link. Timing Bit rate The currently received bit rate is shown in bits per second (bps). Bit rate difference The current difference between the received signal's bit rate and the nominal bit rate is shown in both parts per million (ppm) and bits per second (bps).
- Page 368 Fibre Channel (FC) Applications Fibre Channel Setup and Status Traffic: Traffic is detected. Pattern Sync: Pattern Sync is detected. Pattern Error: Pattern Error is detected. 9.1.3.4 Transceiver Refer to Transceiver in "Ethernet Setup and Status" section. 9.1.4 Errors/Alarms Insertion This section describes the errors and alarms insertion for the Fiber Channel interface on the Application toolbar.
- Page 369 Fibre Channel (FC) Applications Fibre Channel Setup and Status 9.1.4.3 Fibre Channel frequency Touch the field to set Fibre Channel frequency. Enter the desired deviation in the Tx Deviation field. A positive value increases the frequency. 9.2 BERT MT1000A Network Master Pro Page 369...
- Page 370 Fibre Channel (FC) Applications BERT 9.2 BERT BERT stands for Bit Error Rate Testing or BER Testing. The bit error rate is a key parameter in assessing systems that transmit digital data from one location to another (that is, systems such as radio data links, fiber-optic data systems, Ethernet etc.).
- Page 371 Fibre Channel (FC) Applications BERT Stop function Allows you to specify when the measurement ends. Select the relevant option from the drop-down menu: Manual stop: Stops the measurement immediately when you touch the Stop button. Stop at: Stops the measurement at the time specified in the Stop at field on the right.
- Page 372 Fibre Channel (FC) Applications BERT Touching the Generator button in the navigation area displays the following screen. This screen contains the traffic-related parameters. Traffic duration Allows you to set conditions concerning frames transmission. Choosing Continuous will make a continual test sequence. Alternatively, the duration can be set manually in either Seconds or Frames, coupled with a specification of the number of seconds/frames in the adjacent field.
- Page 373 Fibre Channel (FC) Applications BERT Stream profile Line load Refer to "Line load in "Ethernet Applications" for the operation. Frame size Touch Constant field to set the fixed frame size for the duration of the test. Set the Frame size to a multiple of 4. Stream Select one or more of the measurements (Jitter, Latency and Service Measurement...
- Page 374 Fibre Channel (FC) Applications BERT Transport This setting appears in case of BERT on OTN. When you select the check box, you can enable alarm or error thresholds. Interface Fixed to OTN. Evaluation item Select the item to evaluate. If selecting other than Any Alarm or Error, another menu appears.
- Page 375 Fibre Channel (FC) Applications BERT The three dials showing utilization/throughput results, pattern errors and errored frames can be enlarged by touching on them. The black needle points the measured value in the latest period. Refer to the Summary of BERT in "Ethernet Application". When Fibre Channel is selected on 'Threshold' of the Test Setup screen, the Fibre Channel information appears in the upper right-hand corner, shows pass/fail status summary.
- Page 376 Fibre Channel (FC) Applications BERT Selecting the Touch the Total button to switch the total values measured in all interval interval time times. The start time of measurement is displayed on the button. Touching the button in left side Back field shows the measured values in the interval time.
- Page 377 Fibre Channel (FC) Applications BERT Selecting how results are displayed Selecting Select the required notation for the results from the notation drop-down notation menu. Unformatted - e.g. 71892 SI prefix - e.g. 71.891 k (k means "kilo") Engineering - e.g. 71.892E3 Scientific - e.g.
- Page 378 Fibre Channel (FC) Applications BERT Link Reset Link Reset Response Not Operational Offline R_RDY Receiver Ready 9.3 Reflector MT1000A Network Master Pro Page 378...
- Page 379 Fibre Channel (FC) Applications Reflector 9.3 Reflector In Fiber Channel Reflector mode, the Network Master loops incoming traffic on a port, swapping ID addresses. 9.3.1 Ports Setup and Status The first step in running an application is to set up the port interfaces. This is done on the Ports Setup screen, which also provides port status information.
- Page 380 Fibre Channel (FC) Applications Reflector 9.3.2.2 Thresholds Touching the Thresholds button in the navigation area displays the following screen. The Follow button appears when the Port 2 settings can follow Port 1. Transport settings appear if the FC signal is carried by OTN. For operation of Fibre Channel and Transport, refer to Thresholds in BERT...
- Page 381 Fibre Channel (FC) Applications Reflector When Fibre Channel is selected on 'Threshold' of the Test Setup screen, the Fibre Channel information appears in the upper right-hand corner, shows pass/fail status summary. Touching the Details button allows you to inspect the individual pass/fail status. Transport Displays the results of Transport test.
- Page 382 Fibre Channel (FC) Applications Reflector This screen presents a detailed analysis of the test results. You can choose to view either the total results from measurement start or the results of a specific interval during the test. You can also zoom in on a specific result item.
- Page 383 Utility Applications Reflector 10 Utility Applications This chapter describes the applications on Utilities screen of Application Selector. The following applications are available: PDF Viewer Wireshark 10.1 PDF Viewer MT1000A Network Master Pro Page 383...
- Page 384 Utility Applications PDF Viewer 10.1 PDF Viewer PDF Viewer allows you to view PDF files, for example, Operation Manual, report files created by the Network Master, etc. Opening the PDF file Touching the File Open icon ( ) on Application Toolbar openes the dialog box, where you can select a PDF file you want to open.
- Page 385 Utility Applications 10.2 VIP Video Inspection Probe (VIP) application allows you to view the edge surface of an optical fiber by using the optional accessory Video Inspection Probe. The captured image and analysis results can be saved to files. 10.2.1 Application Toolbar Icons for VIP use appear on Application Toolbar.
- Page 386 Utility Applications Replace the adaptor of the Video Inspection Probe with one that matches the optical connector. For handling the Video Inspection Probe, refer to the operation manual that came with the Video Inspection Probe. Network Master also supports following the Video Inspection Probes. OPTION-545VIP USB 200/400x Video Inspect Probe G0293A Video Inspection Probe Lite At the lower left area of the screen, this icon indicates the connection...
- Page 387 Utility Applications File Prefix Touch the field and set the string used in the file name. Start Number Touch the field and set the start number of value used in the file name. Include Date If selecting the check box, date will be appended in the file name. The file name to be generated first is displayed under this item.
- Page 388 Utility Applications Wireshark 10.3 Wireshark Wireshark allows users to analyze captured Ethernet frames. Wireshark is used to analyze the capture files. There are some restrictions on functions because Ethernet interface is not connected. For example, "Capture" and "Telephony" menus are not available. When Wireshark is started, the following screen appears.
- Page 389 Specifications Wireshark 11 Specifications 11.1 MT1000A MT1000A Network Master Pro Page 389...
- Page 390 Specifications MT1000A 11.1 MT1000A This section contains specifications for the Network Master Pro, MT1000A (mainframe). 11.1.1 Configuration - Main Frame - MT1000A Network Master Pro - Standard Accessories - J1565A Line Cord USA J1566A Line Cord Europe J1567A Line Cord UK J1568A Line Cord Australia J1594A...
- Page 391 Specifications MT1000A Input device Power switch, Touch panel 9 inch display with WVGA resolution (800x480 pixels). On, Standby, Charge Speaker Built-in monaural speaker Storage Memory 1GB for User use 11.1.4 Environment Performance Voltage 18 V 100 V to 240 V, 50/60 Hz (with dedicated AC adaptor) Dedicated 10.8 V Rechargeable smart Li-ion Battery...
- Page 392 Specifications MU100010A, 10 G Multirate Module 11.2 MU100010A, 10 G Multirate Module In the following you find specifications for the Network Master Pro MU100010A module. The MU100010A specification lists the functionality added to the basic Network Master Pro by installing the MU100010A option. Refer to the Specifications, MT1000A section for further information about the Network Master Pro's basic functionality.
- Page 393 Specifications MU100010A, 10 G Multirate Module 11.2.2 External Interfaces Test signal SFP/SFP+: 2 Slots interface SFF-8431, SFF-8472 compliant IEEE 802.3ae-2002, IEEE802.3-2008 compliant RJ45: 2 Sockets IEEE802.3-2008 10BASE-T, 100BASE-TX, 1000BASE-T compliant Auto MDI-X 10/100 Mbps Full/Half Duplex, 1000 Mbps Full Duplex RJ48: 2 Sockets ITU-T G.703 compliant...
- Page 394 Specifications MU100010A, 10 G Multirate Module Bit rate offset Relative to Rate: range of PDH/DSn: -125 to +125 ppm transmitter SDH/SONET:-50 to +50 ppm -50 to +50 ppm Ethernet: -100 to +100 ppm CPRI/OBSAI: -100 to +100 ppm Bit rate tolerance Relative to Rate: of receiver...
- Page 395 Specifications MU100010A, 10 G Multirate Module 2M to 139/45/156M Input Bit Rate Refer to Rate. Code/Interface 2.048,34.368 Mbit/s HDB3, BNC 75 Ω (Balance) 44.736 Mbits/s B3ZS, BNC 75 Ω 139.264,155.52 Mbits/s CMI, BNC 75 Ω Sensitivity TERMINATE: (2.048Mbit/s) Up to 40 dB cable attenuation, nominal impedance MONITOR: 20 dB to 26 dB linear attenuation and up to 6 dB cable attenuation, nominal impedance...
- Page 396 Specifications MU100010A, 10 G Multirate Module Size MU100010A only: 163(H) x 257.6 (W) x 38.5(D) (Excluding projections) When combined to MT1000A: 163(H) x 257.6 (W) x 77(D) (Excluding projections) Mass MU100010A only: 1.1 kg max. When combined to MT1000A: 2.7 kg max. (Including battery (G0310A)) 11.3 Measurement functionality MT1000A Network Master Pro Page 396...
- Page 397 Specifications Measurement functionality 11.3 Measurement functionality 11.3.1 Ethernet Measurements Cable test Identifies failures on electrical cables like short-circuits or breaks of a wire pair and indicates the distance from the instrument to the fault. Transmitter Clock Reference Clock Internal clock External clock BITS SETS...
- Page 398 Specifications Measurement functionality Minimum delay request interval IEEE 1588 clock results: Clock state Announce count Sync count Follow-up count Delay request count Delay response count Delay follow-up count Peer delay request/response/response-follow-up counters Maximum/Minimum/Average offset Maximum/Minimum/Average offset deviation Maximum/Minimum/Average offset variance Maximum/Minimum/Average mean path delay Maximum/Minimum/Average peer mean path delay Maximum/Minimum/Average path delay variation...
- Page 399 Specifications Measurement functionality User-defined Jumbo frame size upper limit (1519 to 16000 bytes) *: Only for Ethernet 10/100/1000 Mbps (cannot use 10Gbps) Traffic generator Line load profile Constant: 0.0008% - 100% Ramp: Line load: start, end, step (0.0001% resolution) Duration: 3 to 3600 seconds Ramp mode: Keep end line load, Repeat ramp, Invert ramp Frame size profile Constant...
- Page 400 Specifications Measurement functionality Performance statistics Maximum/Minimum/Average utilization Maximum/Minimum/Average user and total throughput Maximum/Minimum/Average frame rate Maximum/Minimum/Average frame latency Maximum/Minimum/Average packet jitter Frame statistics Total frames Total valid frames Unicast/multicast/broadcast frames Pause frame VLAN frame MPLS frames MPLS-TP frame PBB frame VLAN Max/Min level MPLS Max/Min level Fragmented frames...
- Page 401 Specifications Measurement functionality TCP/UDP source and destination port User-defined pattern at a defined offset Adjustable thresholds Utilization Throughput Errored frames Collision rate Unicast frames Multicast frames Broadcast frames Pause frames Fragmented frames Undersized frames Oversized frames FCS errored frames IFG violations (Ethernet 10/100/1000 Mbps) Preamble violations Difference between Tx and Rx DHCP...
- Page 402 Specifications Measurement functionality Frame slicing Whole frame, Top 64 Bytes, Top 32 Bytes Buffer handling Stop when full, Overwrite Capture transmitted frames on, off Trigger Type Manual, Error, Field match Trigger Position Top, Middle (Only when Trigger Type is Error/Field match) Error Type Any Type, Fragment, Oversize or undersize, Oversize, Undersize, FCS error...
- Page 403 Specifications Measurement functionality Traceroute Trace the IP route over the IP network. User-defined max no. of hops (1 to 255) Information per hop: Maximum/Minimum/Average ping time and number of ping timeouts Ethernet OAM Y.1731 (Service Layer OAM) option IEEE 802.1ag (Connectivity layer OAM) and IEEE 802.3ah (Access Link OAM) VLAN Number of VLAN tag...
- Page 404 Specifications Measurement functionality User programmable UDP/TCP address In stream 1 a BER test can be made. Statistics Available information per stream: Frame loss count/rate Frames and bytes received Frames and bytes transmitted Throughput Latency/Jitter RFC2544 Switch/router test and Single ended network test modes: installation and Throughput commissioning...
- Page 405 Specifications Measurement functionality Round-trip Service Configuration Test: With subtests for: Committed Information Rate Excess Information Rate Traffic Policing Committed Burst Size Excess Burst Size Step duration: 1 sec to 60 sec (user programmable) Number of steps: 1 to 10 (user programmable) Slope: rising or falling Results: Pass/Fail indication...
- Page 406 Specifications Measurement functionality IP packet count, rate IP bytes IP throughput IP header bytes IP fragments TTL threshold violations IPv4 statistics IPv4 packet count, rate IPv4 bytes IPv4 throughput IPv4 header bytes IPv4 header errors IPv6 statistics IPv6 packet count, rate IPv6 bytes IPv6 throughput IPv6 header bytes...
- Page 407 Specifications Measurement functionality SDH Mappings STM-64 - AU4-64c - VC4-64c - Bulk STM-64/STM-16 - AU4-16c - VC4-16c - Bulk STM-64/STM-16/STM-4 - AU4-4c - VC4-4c - Bulk STM-64/STM-16/STM-4/STM-1/STM-1e - AU-4 - VC-4 - Bulk STM-64/STM-16/STM-4/STM-1/STM-1e - AU-4 - VC-4 - E4 STM-64/STM-16/STM-4/STM-1/STM-1e - AU-4 - VC-4 - TU-3 - VC-3 - Bulk STM-64/STM-16/STM-4/STM-1/STM-1e - AU-4 - VC-4 - TU-3 - VC-3 - DS3 STM-64/STM-16/STM-4/STM-1/STM-1e - AU-4 - VC-4 - TU-3 - VC-3 - E3...
- Page 408 Specifications Measurement functionality Manual, Rate (For ERR-TRANS) Manual : Burst length : 1 to 8000 (bit) (Excluding Pattern error) Burst length : 1 to 4000 (bit) (For Pattern error) Rate: 1*10 , 1*10 , 1*10 , 1*10 , 1*10 , 1*10 , 1*10 , 1*10 The available highest rate varies depending on the error item.
- Page 409 Specifications Measurement functionality OH Capture Item SOH: 64 Frames POH: 64 Frames Pathtrace: J0/J1/J2 (Displays in ascii characters) Timing Single Repeat : Update period 1s Transceiver Module Present Transceiver Information Alarm, Wavelength and bit rate, Compliance, Vendor Information, Output Control Power monitor Through Mode Mode :...
- Page 410 Specifications Measurement functionality SONET Mappings OC-192 - STS-192c - STS-192c SPE - Bulk OC-192/OC-48 - STS-48c - STS-48c SPE - Bulk OC-192/OC-48/OC-12 - STS-12c - STS-12c SPE - Bulk OC-192/OC-48/OC-12/OC-3/STS-3 - STS-3c - STS-3c SPE - Bulk OC-192/OC-48/OC-12/OC-3/STS-3 - STS-3c - STS-3c SPE - E4 OC-192/OC-48/OC-12/OC-3/STS-3 - STS-3c - STS-3c SPE - TU-3 - VC-3 - Bulk OC-192/OC-48/OC-12/OC-3/STS-3 - STS-3c - STS-3c SPE - TU-3 - VC-3 - DS3 OC-192/OC-48/OC-12/OC-3/STS-3 - STS-3c - STS-3c SPE - TU-3 - VC-3 - E3...
- Page 411 Specifications Measurement functionality Insertion : Manual, Rate, Alternate (Excluding ERR-TRANS) Manual, Rate (For ERR-TRANS) Manual : Burst length : 1 to 8000 (bit) (Excluding Pattern error) Burst length : 1 to 4000 (bit) (For Pattern error) Rate: 1*10 , 1*10 , 1*10 , 1*10 , 1*10...
- Page 412 Specifications Measurement functionality Graph : Pointer movement OH Capture Item TOH: 64 Frames POH: 64 Frames Pathtrace:J0/J1/J2 (Displays in ascii characters) Timing Single Repeat : Update period 1s Transceiver Module Present Transceiver Information Alarm, Wavelength and bit rate, Compliance, Vendor Information, Output Control Power monitor Through Mode...
- Page 413 Specifications Measurement functionality 11.3.2.3 PDH Number of ports Max. 2 Frame format Non PCM frame Bit rate : Refer to Rate. Framed Bit rate (Format) E1 2.048Mbit/s (30,31ch with or without CRC4, Sa-bit, CAS) E3 34.368Mbit/s (G.751) E4 139.264Mbit/s (G.751) DS1 1.544Mbit/s (T1.107, SF/ESF/Japan ESF, CAS) DS3 44.736Mbit/s (T1.107, M13/C-bit) Mux/DeMux...
- Page 414 Specifications Measurement functionality Timing : Manual, Burst Error/Alarm Alarm detection detection LOS, AIS, No Frame, No CRC4 MF, Distant, No sync, No CAS MF, Distant E3/E4 LOS, AIS, No Frame, Distant, No Sync LOS, AIS, OOF, RAI, LLS LOS, AIS, LOF, RAI, IDLE, LSS Display : Second Error Detection FAS, Pattern error, CRC4, CRC4 MFAS, E-bit, Code, Pattern slip, Frame...
- Page 415 Specifications Measurement functionality Mapping OTU2 (Client PRBS) OTU2-ODU2/OPU2-PRBS OTU2-ODU2/OPU2-ODTU2.1-ODU0/OPU0-PRBS OTU2-ODU2/OPU2-ODTU12(PT=20,21)-ODU1/OPU1-PRBS OTU2-ODU2/OPU2-ODTU12(PT=20,21)-ODU1/OPU1 -ODTU01-ODU0/OPU0-PRBS OTU2-ODU2/OPU2-ODTU2.ts-ODUflex-PRBS OTU2 (Client Null) OTU2-ODU2/OPU2-NULL OTU2-ODU2/OPU2-ODTU2.1-ODU0/OPU0-NULL OTU2-ODU2/OPU2-ODTU12(PT=20,21)-ODU1/OPU1-NULL OTU2-ODU2/OPU2-ODTU12(PT=20,21)-ODU1/OPU1 -ODTU01-ODU0/OPU0-NULL OTU2-ODU2/OPU2-ODTU2.ts-ODUflex-NULL OTU2 (Client Ethernet) OTU2-ODU2/OPU2-ODTU2.1-ODU0/OPU0-GbE OTU2-ODU2/OPU2-ODTU12(PT=20,21)-ODU1/OPU1 -ODTU01-ODU0/OPU0-GbE OTU2-ODU2/OPU2-ODTU2.ts-ODUflex-Ethernet OTU2 (Client SDH/SONET) OTU2-ODU2/OPU2-STM64(Async)/STS192(Async) OTU2-ODU2/OPU2-STM64(Sync)/STS192(Sync) OTU2-ODU2/OPU2-ODTU2.1-ODU0/OPU0-STM4/STS12 OTU2-ODU2/OPU2-ODTU2.1-ODU0/OPU0-STM1/STS3 OTU2-ODU2/OPU2-ODTU12(PT=20,21)-ODU1/OPU1 -STM16(Async)/STS48(Async) OTU2-ODU2/OPU2-ODTU12(PT=20,21)-ODU1/OPU1 -STM16(Sync)/STS48(Sync) OTU2-ODU2/OPU2-ODTU12(PT=20,21)-ODU1/OPU1 -ODTU01-ODU0/OPU0-STM4/STS12 OTU2-ODU2/OPU2-ODTU12(PT=20,21)-ODU1/OPU1...
- Page 416 Specifications Measurement functionality OTU1 (Client Null) OTU1-ODU1/OPU1-NULL OTU1-ODU1/OPU1-ODTU01-ODU0/OPU0-NULL OTU1 (Client Ethernet) OTU1-ODU1/OPU1-ODTU01-ODU0/OPU0-GbE OTU1 (Client SDH/SONET) OTU1-ODU1/OPU1-STM16(Async)/STS48(Async) OTU1-ODU1/OPU1-ODTU01-ODU0/OPU0-STM4/STS12 OTU1-ODU1/OPU1-ODTU01-ODU0/OPU0-STM1/STS3 OTU1 (Client FC) OTU1-ODU1/OPU1-FC200 OTU1-ODU1/OPU1-ODTU01-ODU0/OPU0-FC100 OTU1 (Client CPRI) OTU1-ODU1/OPU1-2457.6 M(CPRI) OTU1-ODU1/OPU1-ODTU01-ODU0/OPU0-1228.8 M(CPRI) OTU1-ODU1/OPU1-ODTU01-ODU0/OPU0-614.4 M(CPRI) OTU1e/2e (Client PRBS) OTU1e-ODU1e/OPU1e-PRBS OTU2e-ODU2e/OPU2e-PRBS OTU1e/2e (Client Null) OTU1e-ODU1e/OPU1e-NULL OTU2e-ODU2e/OPU2e-NULL OTU1e/2e (Client Ethernet)
- Page 417 Specifications Measurement functionality OH Edit All OTU, ODU bytes except MFAS and BIP8 TTI, FTFL bytes with multi-frame manner TTI measurement Condition for detecting TIM can be selected. TCM measurement On/Off MSIM Detection Expected MSI bytes are set from Tx Data or Received Data. 11.3.3.2 OTN Stimuli Alarm Insertion OTU, ODU...
- Page 418 Specifications Measurement functionality Error Detection OTU, ODU FAS, MFAS, SM-BIP8, SM-BEI, FEC Corrected, FEC Uncorrectable, PM-BIP8, PM-BEI, TCMi-BIP8, TCMi-BEI (i=1-6) Multiplexed ODU FAS, MFAS, PM-BIP8, PM-BEI cHEC corrected, cHEC uncorrectable, tHEC corrected, tHEC uncorrectable, CSF Signal, CSF Sync, Invalid GFP Frame, Superblock CRC, eHEC corrected, eHEC uncorrectable, FCS, CMF Sync, CMF Signal, SSF, PTI Mismatch, UPI Mismatch Client...
- Page 419 Specifications Measurement functionality Content FOX, ALL5555, PRBS 9, PRBS 11, PRBS 15, PRBS 20, PRBS 23, PRBS 29, PRBS 31, BHFTEST, BCRPAT, BJTPAT, BSPAT, USER_32, ZERO Alarm Insertion Item Link reset, Link reset response, Not optional, Offline Error Insertion Item Bit, Symbol, R_RDY, CRC Insertion timing Manual, Burst...
- Page 420 Specifications Measurement functionality no HDLC, 240 kbit/s, 480 kbit/s, 960 kbit/s, 1920 kbit/s, 2400 kbit/s, Highest possible Ethernet On, Off Pointer: 20 to 63 Alarm Insertion Item Signal Loss, LOS, LOF, LSS, Remote-LOS, Remote-LOF, RAI, SDI, Reset Error Insertion Item LCV, SHV, K30.7, Pattern error Insertion timing Manual, Rate...
- Page 421 Optical modules for the MU100010A comply with optical safety standards in IEC 60825-1. Specifications Specification of optical modules purchased from Anritsu for the MU100010A (each with 1 transmitter and 1 receiver) with LC connectors (subject to change without further notice): Description Min.
- Page 422 Specifications Optical Modules Description Min. Input Input Output Output Order No./ Name (Approx. Distance) Sensitivity Wavelength Power Wavelength G0356A 8G FC/10G SR 850 nm 840 to 860 -8.2 to -1 840 to 860 8G FC/10G SR 850 nm -11.1 dBm SFP+ SFP+ MT1000A Network Master Pro...
- Page 423 Support Optical Modules 12 Support This chapter contains information about general maintenance of the Network Master. It also contains information on how to obtain support or service assistance. 12.1 Maintenance and Cleaning MT1000A Network Master Pro Page 423...
- Page 424 WARNING There are no user-serviceable parts in the Network Master. Possible service or repair should be performed by Anritsu authorized personnel only. 12.1.2 Cleaning From time to time the Network Master needs to be cleaned. The surfaces of the Network Master can be cleaned with any mild detergent that does not contain solvents.
- Page 425 When performance test of the instrument is ordered to Anritsu, contact an Anritsu Service and Sales office. Contact information is available in a separate file on the DVD version of this manual.
- Page 426 Support Formatting the data area in the Network Master 12.3 Formatting the data area in the Network Master Occasionally it is required to remove customer data from Network Master such as after instrument rental. With Software tools you can format Network Master internal data area.
- Page 427 In case your Network Master needs support or service, follow the instructions given in the sub-sections below. 12.4.1 Before you obtain assistance To ensure fast help the Anritsu representative or the Anritsu Customer Services need detailed information about the Network Master and the problems concerning the Network Master. The minimum information required is listed below: A file containing the system information.
- Page 428 Support Transporting and Disposal 12.5 Transporting and Disposal This section describes the precautions to observe when transporting and disposing of the main frame at the end of its useful life. 12.5.1 Repackaging Use the original shipping materials, or an approved optional transit case, when repacking the unit for transport.
- Page 429 In addition, this warranty is valid only for the original equipment purchaser. It is not transferable if the equipment is resold. Anritsu Corporation shall assume no liability for injury or financial loss of the customer due to the use of or a failure to be able to use this equipment.
- Page 430 All listed software packages are copyrighted by their respective authors. Please see the source code for detailed information. 12.6.5 Availability of Source Code Anritsu Corporation has the full source code of the GPL licensed software, including any scripts to control compilation of the object code. 12.7 Software License Document...
- Page 431 12.7 Software License Document Network Master comes with the package software as described in following Table. Note, however, that the package software is not covered by the Anritsu Software License Agreement. Go to the following website for details of each license. http://www.anritsu.com/en-us/products-solutions/products/mt1000a.aspx...
- Page 432 Support Software License Document Software License (Continued) Name Version License harfbuzz 0.9.24-1 hicolor-icon-theme 0.12-2 GPL2 hplip 3.14.1 custom icewm 1.3.7 inputproto 1.4.4 jack 0.121.3-7 GPL,LGPL kbproto 1.0.3 keyutils 1.5.8-1 GPL2,LGPL2.1 kobs-ng 12.09.01 krb5 1.11.4-1 custom lcms2 2.5-2 libcap 2.22-5 GPL2 libcups 1.7.0-2 libdbus...
- Page 433 Support Software License Document Software License (Continued) Name Version License libxi 1.7.2-1 custom libxinerama 1.1.3-2 custom libxkbcommon 0.3.2-1 custom libxkbfile 1.0.5 libxml2 2.6.28 libXmu 1.0.4 libXpm 3.5.7 libXrandr 1.3.0 libXrender 0.9.4 libXt 1.0.4 libxtst 1.2.2-1 custom libxxf86vm 1.1.3-1 custom linux-gpib 3.2.20 GPL2 linux_kernel...
- Page 434 Support Software License Document Software License (Continued) Name Version License talloc 2.1.1-1 GPL3 tcpdump 4.5.1-1 tcp_wrappers timezone 2006n tslib LGPL u-boot Jan-13 udev wayland 1.3.0-1 wget 1.15-1 GPL3 wireless_tools wireshark 1.12.1 GPL2 wpa_supplicant 0.5.9 x11vnc 0.9.13-6 GPL2 xcb-proto xcmiscproto 1.1.2 xextproto 7.0.3 xf86bigfontproto...
- Page 435 4. This EULA allows you to install one copy of this Software on one piece of Equipment. 2. Disclaimers To the extent not prohibited by law, in no event shall Anritsu be liable for personal injury, or any incidental, special, indirect or consequential damages whatsoever, including, without limitation, damages for loss of profits, loss of data, business interruption or any other commercial damages or losses, arising out of or related to your use or inability to use this Software.
- Page 436 6. Reparations If Anritsu suffers any loss, financial or otherwise, due to your violation of the terms of this EULA, Anritsu shall have the right to seek proportional damages from you.
- Page 437 CE Conformity Marking 12.9 CE Conformity Marking Anritsu affixes the CE conformity marking on the following product(s) in accordance with the Council Directive 93/68/EEC to indicate that they conform to the EMC and LVD directive of the European Union (EU).
- Page 438 EN 61000-3-2:2006 + A1:2009 A2:2009 (Class A equipment) LVD: EN 61010-1:2010 (Pollution Degree 2) 12.9.4 Authorized Representative Murray Coleman Name: Head of Customer Service EMEA ANRITSU EMEA Ltd 200 Capability Green, Luton Address, City: Bedfordshire, LU1 3LU Country: United Kingdom 12.9.5 CE Declaration...
- Page 439 Support CE Conformity Marking 12.9.5 CE Declaration 12.10 C-Tick Conformity Marking MT1000A Network Master Pro Page 439...
- Page 440 Support C-Tick Conformity Marking 12.10 C-Tick Conformity Marking Anritsu affixes the C-Tick mark on the following product(s) in accordance with the regulation to indicate that they conform to the EMC framework of Australia/New Zealand. 12.10.1 Product Model Model: MT1000A Network Master Pro 12.10.2 Applied Standards...
- Page 441 Support Laser Safety 12.11 Laser Safety 12.11.1 Laser Safety Classifications Class 1 indicate the danger degree of the laser radiation specified below according to IEC 60825-1:2007. Class 1: Lasers that are safe under reasonably foreseeable conditions of operation, including the use of optical instruments for intrabeam viewing. WARNING The laser in the plug-in unit provided for this equipment is classified as Class 1 according to the IEC 60825-1:2007 standard, and is safe under reasonably...
- Page 442 Support Laser Safety Table 2 Specifications of Laser Built into MU100010A Max. Optical Pulse Width Emitted Beam Model Output Power (s)/ Repetition Wavelength Divergence (mW)* Rate (nm) (deg) (a) G0311A 31.9 (b) G0312A 1310 11.5 (c) G0313A 1550 11.5 (d) G0315A 1310 11.5 (e) G0316A...
- Page 443 Support Laser Safety 12.11.3 Laser Radiation Markings Figure 1: Locations of laser beam aperture Figure 2: Locations of affixed labels 12.12 Wireless Certification MT1000A Network Master Pro Page 443...
- Page 444 Support Wireless Certification 12.12 Wireless Certification 12.12.1 Japan MIC MT1000A is certified the certification of construction type of specified radio equipment. 12.12.2 North America (USA FCC and Canada IC) This device complies with Industry Canada license-exempt RSS standard(s). Operation is subject to the following two conditions: 1.
- Page 445 (RF) de la FCC lignes directrices d'exposition et d'exposition aux fréquences radioélectriques (RF) CNR-102 de l'IC. 12.12.3 Europe CE Hereby, Anritsu Corporation, declares that this instrument is in compliance with the essential requirements and other relevant provisions of Directive 1999/5/EC. 12.12.4 Brazil ANATEL...
- Page 446 Support Wireless Certification 12.12.5 China SRRC 12.12.6 Indonesia SDPPI MT1000A is certified SDPPI wireless certification. 12.12.7 Israel MoC MT1000A Network Master Pro Page 446...
- Page 447 Support Wireless Certification 12.12.8 Mexico IFETEL IFETEL certification number: RCPANMT14-0759 The operation of this equipment is subject to the following two conditions: 1. It is possible that this equipment or device may not cause harmful interference. 2. This equipment or device must accept any interference, including interference that may cause undesired operation.
- Page 448 2012/19/EC (the "WEEE directive") in European Union. For products placed on the EU market after August 13, 2005, please contact your local Anritsu representative at the end of the product's useful life to arrange disposal in accordance with your initial contract and the local law.
- Page 449 5. Remove the battery. 6. Insulate the battery terminals with adhesive tape. 7. Mail it to your Anritsu Service or Sales office, or to the address shown below. ANRITSU COMPANY 490 Jarvis Drive, Morgan Hill, CA 95037-2809, USA 12.13.4 Information for the Chinese Market Only...
Need help?
Do you have a question about the Network Master Pro MT1000A and is the answer not in the manual?
Questions and answers