Anritsu MT1000A Quick Reference Manual
Network master pro
otdr modules
Hide thumbs
Also See for MT1000A:
- Remote scripting operation manual (996 pages) ,
- Operation manual (605 pages) ,
- Configuration manual (24 pages)
Table of Contents
Advertisement
Quick Links
Quick Reference Guide
Network Master Pro
Battery
• Additional safety and warning information is
provided within the "MT1000A Network Master Pro
OTDR Modules" Operation Manual.
• Please refer to that document before using the
equipment.
• Keep this manual with the equipment.
MT1000A
OTDR Modules
Fourth Edition
Touch Screen display
Document No.: M-W3811AE-4.0
Power button
Advertisement
Table of Contents

Related Manuals for Anritsu MT1000A


Summary of Contents for Anritsu MT1000A
- Page 1 Touch Screen display Power button Battery • Additional safety and warning information is provided within the “MT1000A Network Master Pro OTDR Modules” Operation Manual. • Please refer to that document before using the equipment. • Keep this manual with the equipment.
-
Page 2: Table Of Contents
Loading the file ................. 27 Creating the report ............29 Copying a file ..............31 Copyright © 2015-2018, ANRITSU CORPORATION All rights reserved. No part of this manual may be reproduced without the prior written permission of the publisher. The contents of this manual may be changed without prior notice. -
Page 3: Panel
Panel MU100021A panel is shown below. MU100020A and MU100022A do not have the OTDR/OLS (0.85/1.3 m) connector. *: OTDR/OLS (1.31/1.55/1.625 m) is printed on MU100022A. VFL: Visual Fault Locator (Option 002) Visible red light is output. OPM: Optical Power Meter Input port for the power measurement. -
Page 4: Power
Power Power button indication shows the following status. Gray: Power off Orange flashing (fast): Booting on AC power Green flashing: Booting on battery Orange flashing (slow): Charging Orange: Stand by Green: Operating To Power Up AC Operation Connect the AC adaptor to the Network Master. The power button flashes in orange during booting and remains on after booting. -
Page 5: To Power Down
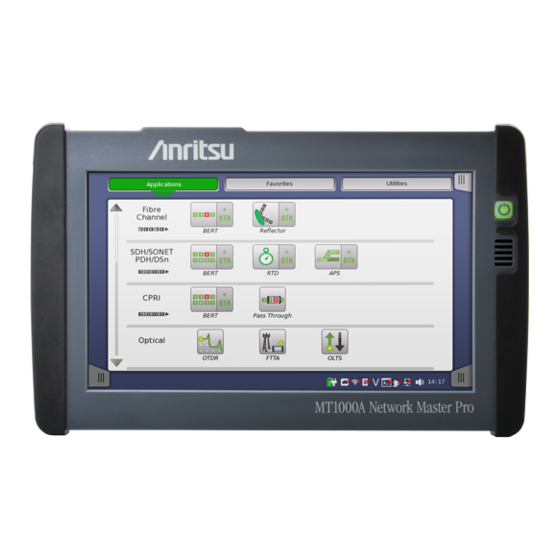
Battery Operation Press the power button. The Network Master shows a model name and flashes the power button in green during booting. Then, the Network Master enters Operating status and shows the Application Selector. To Power Down When you press the Power button, a pop-up menu containing Shut Down will appear. -
Page 6: Toolbars
Toolbars General functionalities such as start/stop of test, creation of the report, displaying the help etc. are placed in expandable toolbars. Application toolbar Instrument toolbar Start Averaging Instrument information Network setting and Stop the measurement General settings (ex. Start Realtime* Date, Language) Skip a measurement* File manager... -
Page 8: Standard Otdr (Optical Time Domain Reflectometer)
Standard OTDR (Optical Time Domain Reflectometer) To locate where the reflection happens, and measure the fiber loss, touch Standard OTDR in the Application selector. Measurement condition setup To display the Setup screen, touch SETUP at the bottom of the screen. For MU100021A, touch Port in the navigation area. - Page 9 Connection Check: If selecting the check box, confirms whether or not the fiber is connected correctly to the OTDR measurement port. Active Fiber Check: If selecting the check box, performs a "live fiber" check on the currently attached fiber under test to detect whether the fiber is carrying traffic before firing any OTDR laser sources.
-
Page 10: Test Setup
Test setup To display the Test screen, touch TEST at the bottom of the screen. Touch Fiber in the navigation area. Set the length of the patch code connecting to the fiber under the test. If Output port is set to Single Mode, set the splitter configuration. - Page 11 Touch Auto Detect. Set the thresholds to detect events automatically. Touch Pass/Fail. Set the thresholds to judge results to pass or fail.
-
Page 12: Measurement
Measurement After cleaning the connector of the optical fiber, connect it to the measurement port of the Network Master. Touch (Start Averaging) or (Start Realtime) on the Application toolbar. During the measurement icon blinks to indicate that laser is output from the measurement port. If Connection Check is selected, the connection check runs. -
Page 13: Fiber Visualizer
Fiber Visualizer Touching the Fiber Visualizer button in the navigation area will display the following screen. Latency to Far End event Wavelength Output Port Distance of Far End event Fiber Distance Range Pulth Width Average Time Schematic Event icon Trace image of Pass/Fail result display area Total Results... - Page 14 Event distance Event number Distance from previous event Event icon Connection loss at event point Fiber loss Reflection at event point "S" appears if the reflection level is saturated. Trace image of the event Start of the fiber Splitter Event Reflective Event End of the fiber Non-Reflective Event...
-
Page 15: Trace
Trace Touching the Trace button in the navigation area will display the following screen. When this icon is green, allows users to zoom the trace in by dragging area on the trace window. When this icon is green, allows users to zoom out the trace by touching a point on the trace window. - Page 16 Event Table The event type is shown by the icon at event position of the trace or in the event table. Event Types Reflective Event Reflection from a splice point, such as a Fresnel reflection caused by a mechanical splice or connector. Non-Reflective Event Non-reflective events include such low loss events as fusion splices and Macro Bends.
- Page 17 Cursor Cursor display varies depending on the selected loss type. Touch A, B, or LSA1 to LSA4. Touch the position where moving the cursor. Touch < or > to adjust the cursor position.
- Page 18 Soft keys Switches between Auto and Manual. When Manual is set, Parameter soft key is available. Selects the wavelength using for the test. When Test Mode is set to Manual, opens dialog box to set Distance Range, Pulse Width, Sampling Mode, and Average Time.
-
Page 19: Ftta (Fiber To The Antenna)
FTTA (Fiber to the Antenna) FTTA application is the optimized application for the short range fiber measurement such as between the antenna and controller in the radio base station. Touch FTTA in the Application selector. The Setup screen appears in the same way as in Standard OTDR application. However the measurement parameters are more simplified than Standard OTDR application. -
Page 20: Construction
Construction Construction application is optimized for performing multiple fiber measurements sequentially. Touch Construction in the Application selector. The Setup screen appears in the same way as in Standard OTDR application. Touch Project and enter the value in Number of Fiber. Touch Measurement in the navigation area. - Page 21 When using the template trace, touch Template in the navigation area. For Test setup, refer to page 8 to 9. Touch on the Application toolbar. The Information dialog box appears. After cleaning the connector of the optical fiber, connect it to the measurement port of the Network Master.
- Page 22 If Preview has set to On during the measurement, the Summary dialog box is displayed after the measurement. Close the Summary dialog box and touch to resume the next fiber measurement. When Preview is set to Off, the traces are erased automatically after the measurement.
-
Page 23: Olts (Optical Loss Test Set)
OLTS (Optical Loss Test Set) OLTS applications allows users to measure an optical fiber loss. The optical power and the optical loss are displayed as the test results. To measure an optical loss Touch OLTS in the Application selector. Connect the light source (OTDR/OLS) and OPM via adaptor. Confirm that fiber type and the core diameter are appropriate. - Page 24 Remove the optical fiber from the adaptor, and then connect the device under test. Device under test Adaptor Optical fiber OTDR/OLS Network Master Measurement result appears in Loss.
- Page 25 Select Threshold check box. Touch the field to set the threshold value for pass/fail judgment. 10. Touch Loss Table in the navigation area. 11. Touch the Add soft key. Measurement result will be added to the table.
- Page 26 Adds the measured loss value to the table. Overwrites the loss value to the row of the selected number. Deletes the last row from the table. Deletes all rows from the table. Opens the dialog box for editing the comment. Switches the output of VFL.
- Page 27 To measure an optical loss by using two Network Masters When a reference of the power meter cannot be measured directly, touch the Reference field and input a power value. In the transmitter side Network Master, setting the Output Mode of Light Source to Wave Code sends the wavelength and the its power meter reference modulating output light.
- Page 28 Wavelength: All (SM) Output Mode: Wave Code Set Network Master 1 Light Source to On. Network Master 2 detects wavelengths and reference values received from Network Master 1. Wavelength of the power meter is set automatically and a loss is displayed.
-
Page 29: File Saving And Loading
File saving and loading Saving the file Touch on the Application toolbar. Touch the File name field to enter the file name. Touch Save Setup to save the test setup parameters. The test setup is appended to Favorites in the Application Selector if selecting Add to Favorites check box. - Page 30 Touch a button: Loads a setup file (*.cfg). Loads a test result file (*.sor or *.zip). If loading a result file (*.sor), the primary trace is overwritten. Loads a test result file (*.sor or *.zip). If loading a result file (*.sor), the primary trace is overwritten and the application test setup will change according to parameters in the loaded file.
-
Page 31: Creating The Report
Creating the report Touch on the Application toolbar. Select the file format of Report file, and set Logo in Report Generator dialog box. Touch Next. Select check boxes of items outputting to the report, and set the VIP (Video Inspection Probe) file. Touch Generate. Touch the File name field to enter the file name. - Page 32 The message appears when the report has been generated. To confirm the PDF, touch View PDF. After PDF viewer launched, the report is displayed.
-
Page 33: Copying A File
Copying a file File Manager allows users to copy the report file to a USB memory stick. Attach a USB memory stick to Network Master. Touch on the Instrument toolbar. Internal folder is the storage in Network Master. Information (Free Space etc.) is displayed at bottom of window. - Page 36 Printed on Recycled Paper Printed in Japan...
Need help?
Do you have a question about the MT1000A and is the answer not in the manual?
Questions and answers